What is Usabilty
Usability is a suite of reports that show the User Experience (UX) on a page. This is a helpful way to visualize customer interaction data for UX Designers and content and marketing teams as well as product teams. A Snapshot is taken of a page on the website or app where the Discover is running to aggregate the metrics for all visitors to the page within the replay timeframe.
Overlay metrics
There are five different overlays that can be used on a Snapshot.
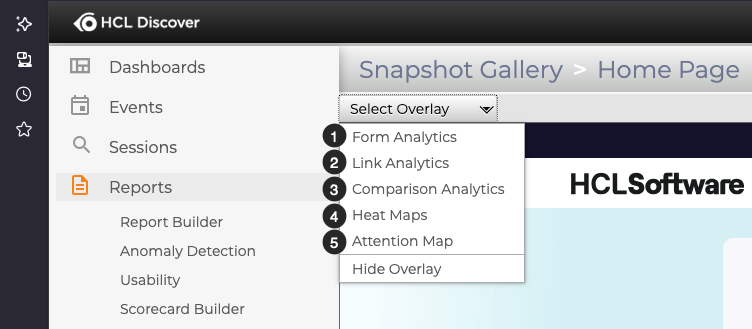
- Form Analytics show the success rate on interactions with form fields
- Link Analytics show the rate of interaction with links on the page
- Comparison Analytics show testing and experimentation results for campaigns on the page
- Heat Maps show the depth of interaction for all visitors with temperature color coding
- Attention Maps show the scroll depth, or length of viewing time on each part of the page as the visitors' scrolled vertically
How to create a Snapshot
Once you select a page to analyse, you'll need to capture a Snapshot. This quick walk through demo will show you:
- How to install and setup the required browser extension in Firefox
- How to capture a Snapshot
- How to use the overlays on a Snapshot