Introduction to Using Discover
Today, gaps exist within organisations ability to understand why their web and mobile experiences succeed, or fail to meet their business performance goals, their KPI's.
Organisations often have a wealth of siloed solutions and associated data, IT with application and system / server logs; customer services with email feedback, survey data, and customer testimonials; and finally, business teams with reports and business / commerce trend data. None deliver the why, unlocking these peripheral data silos.
Filling the gap with Discover provides organisations with an unprecedented visibility into every visitor's unique online interaction and behaviour -- information that is foundational to answering why?
- Why are customers not able to complete their purchase?
- Why do some of my campaigns convert better than others?
- Why are customers having problems logging in?
- Why do customers search but not purchase?
- How much is this costing my business?
How does it do this?
- It captures the users journey from start to finish, every detail
- It then mines the journey data
- It tracks and reports on positive and negative behaviour
With this visibility, Discover provides organisations with the evidence to prioritise fixes that deliver the business performance figures quicker.
Not a customer?
Get access to Discover and then read on. Get up and running in minutes.
Visitor Sessions
Most web or application servers need to be able to differentiate between visitors and or devices accessing them. Discover is no different in this respect and needs to identify the 100's of individual interactions a single visitor may make from any other visitor concurrently visiting the site.
Visitor interactions also happen over time, so it's important to know who, with what and when independently.
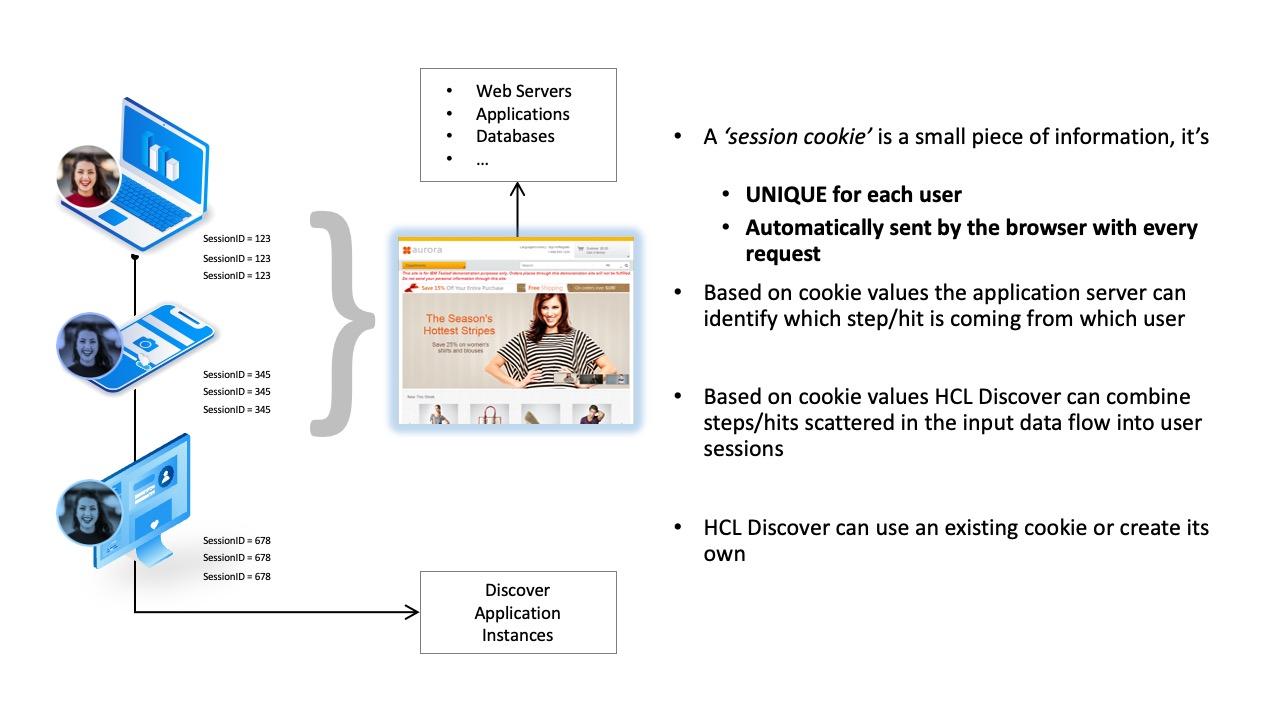
Along with knowing who is accessing the site, Discover is capturing the interactions they make. At a high level these interactions take the form of what is called a 'Hit' and can be understood as 'request (REQ) < > response (RSP) pairs' exchanging data between the visitor and the website. In later sections on events this is discussed in more detail, however for now this data exchange is collated into what is referred to as a 'session'; the visitors experience bundled together along with a 'session cookie'.
The 'session cookie' is a unique identifier stored within the browser for the duration of the session and is visible via the browsers 'developer web tools cookie' menu.
Using the left page navigation the following section on events, HITs, dimensions, and reporting will show you how session data is used to fill the visibility gap organisations are challenged with.
Portal Orientation
Portal
The screenshot shown below is referred to at the Portal, the Portal is where all business user tasks take place including system administration and DMS -- Discover System Management functions. Other system management tasks / configuration can take place elsewhere within the solution infrastructure and is discussed later in this guide.
After login the business user is presented with the screenshot shown below. The way the Portal is presented at login can differ based upon configuration, by default the UI will show the Portal management page.
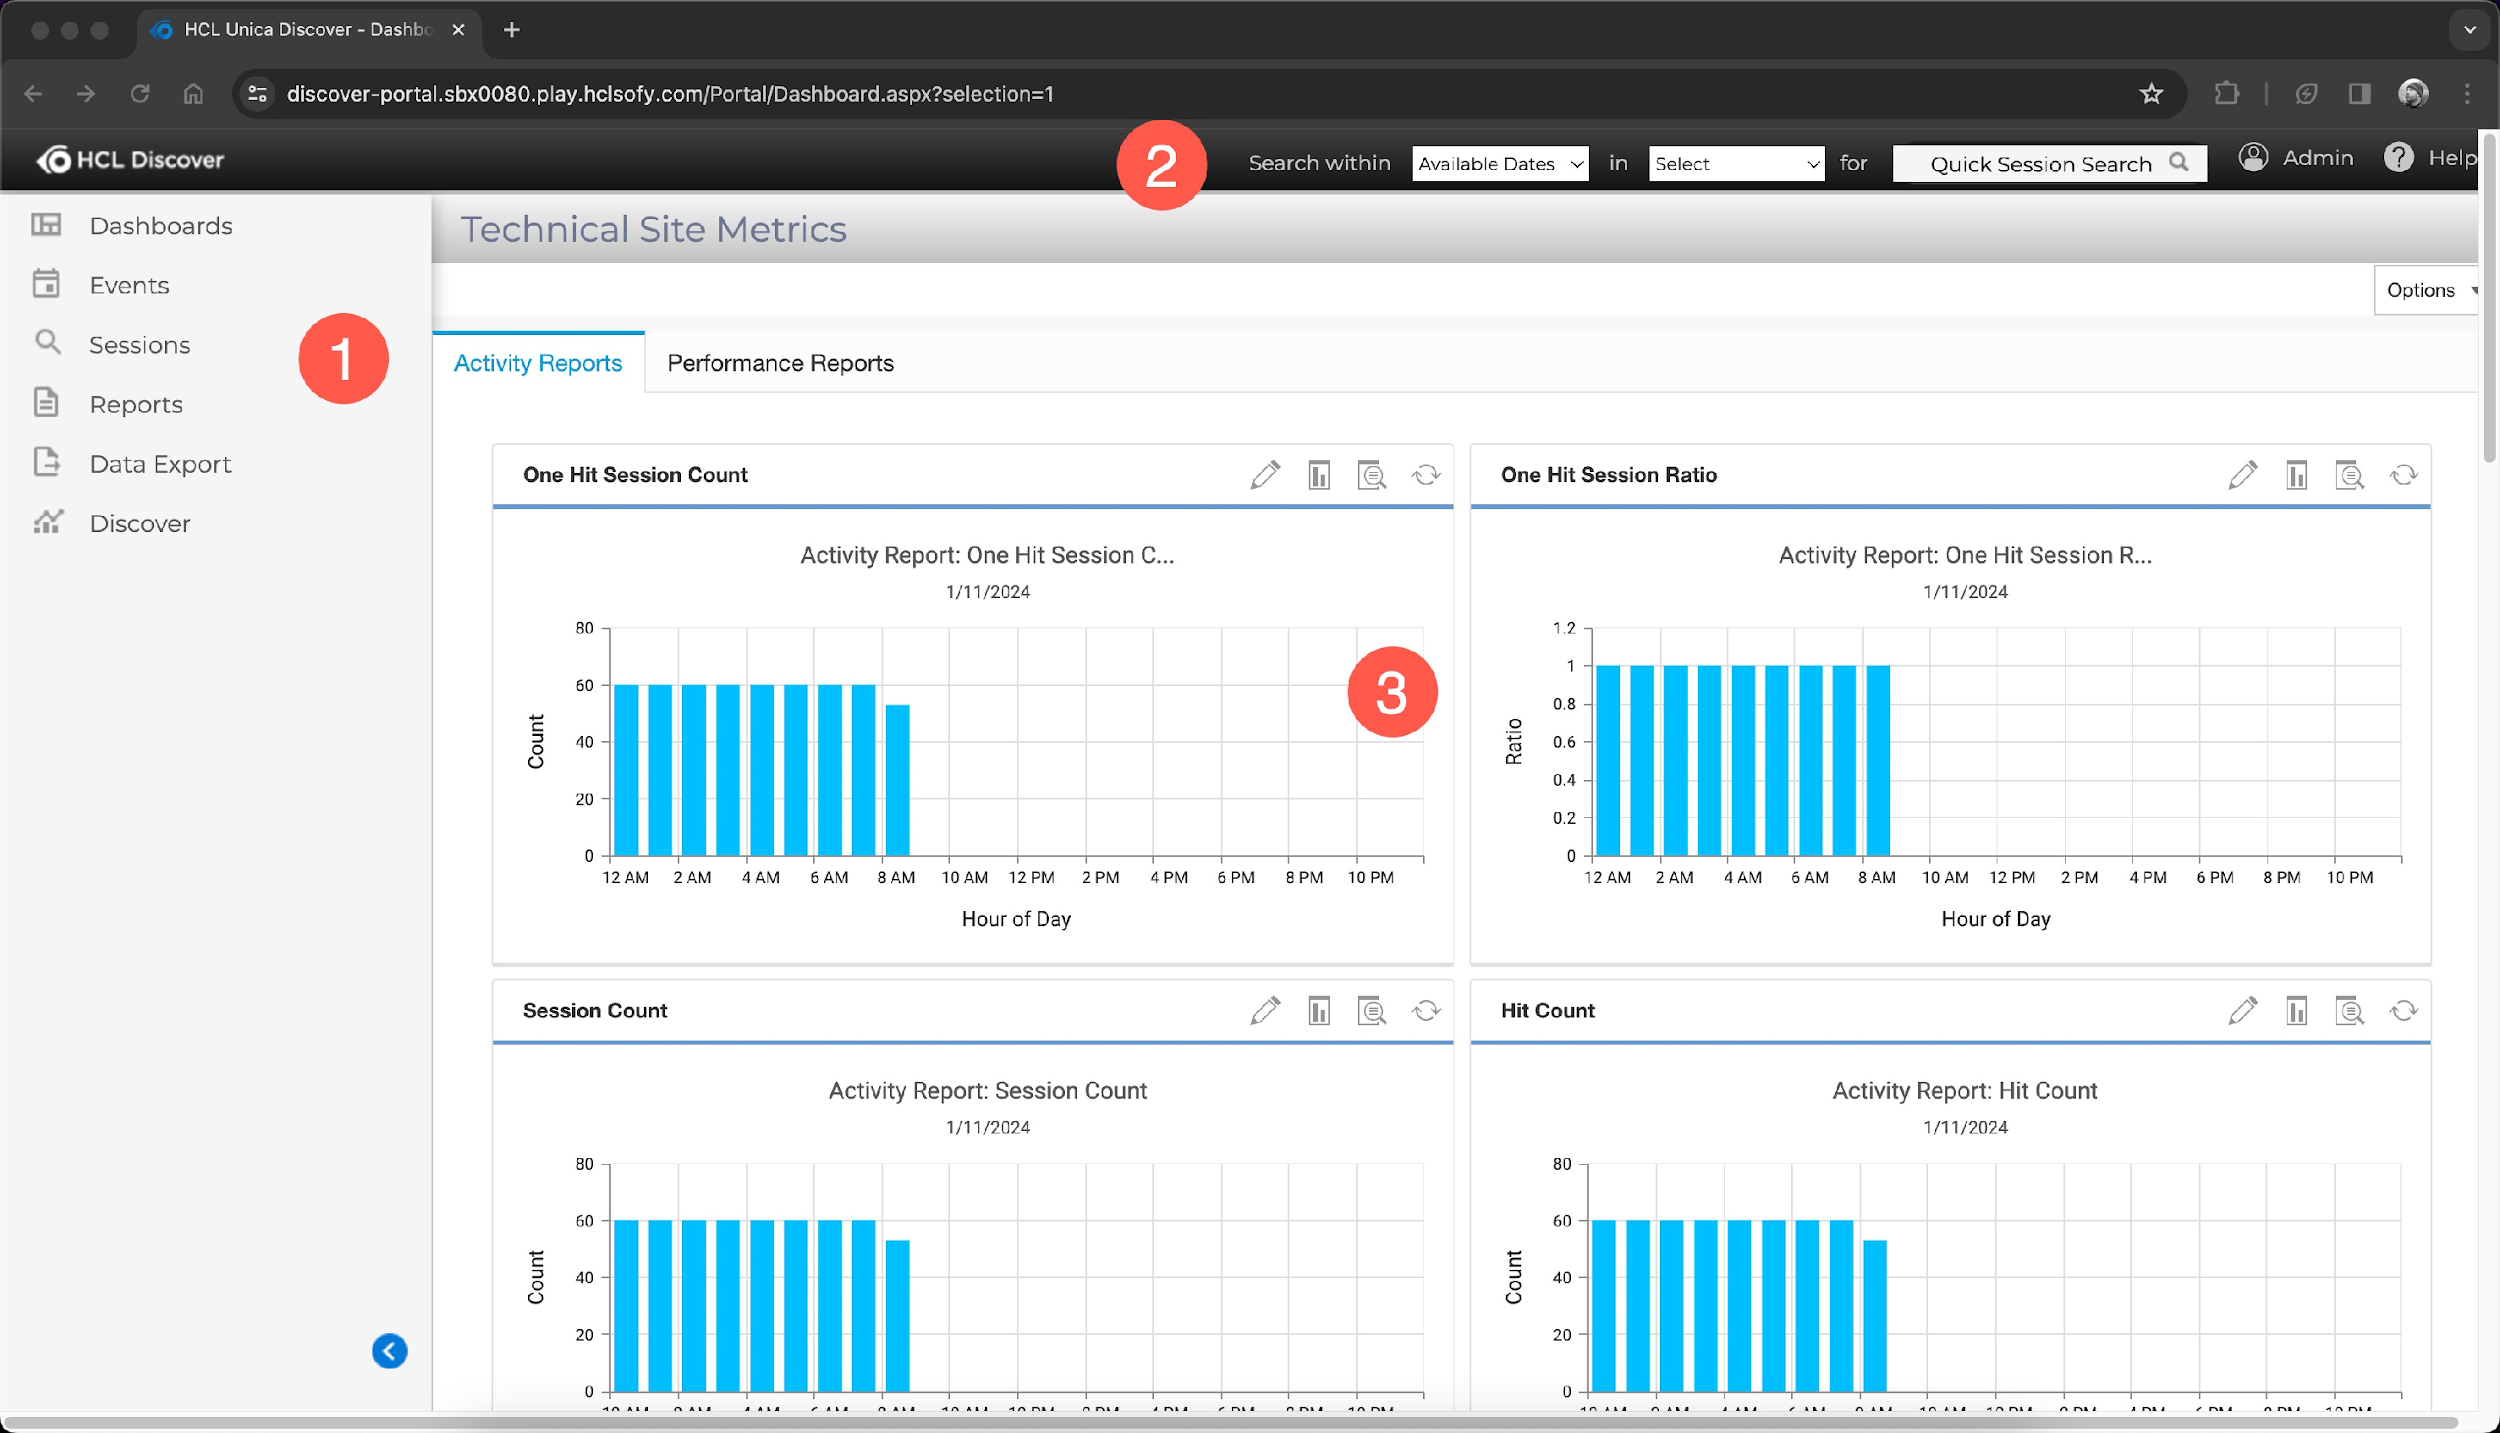
1. Left Navigation Menu. The main Portal menu, this may differ for some users as can be configured to restrict the capabilities shown based upon group membership.
| Area | Description |
|---|---|
| Dashboards | The dashboard menu provides direct link access to default and custom dashboards and dashboard management. Dashboard access is limited by user group access so may differ by user. |
| Events | The event menu when expanded provides the functionality to support event management (creation, editing, etc...), event monitoring and alert creation. |
| Sessions | The sessions menu allows you to search all visitor sessions, active only and complete sessions. |
| Reports | The reports menu provides access to building reports for dashboards, defining anomaly detection, usability and building scorecards / segments. Additionally, managing reports for dashboards as well as scorecards. |
| Data Export | Data exports allow access to define export jobs and visitor session archiving. |
| Discover | The Discover menu provides access to the systems status, system logs, system statistics, system user activity, portal management and the portal services aka the DMS. Portal management subsequently allows administrators (or defined user groups) to manage servers within the solutions, administer users and groups, administer general/scorecard settings, view logs, announcements, and backup/restore data. The DMS allows administrators to configure the system, manage jobs, view pipeline status and advanced functions. |
2. Quick Search. The quick search menu that allows users to search for text that appears in the visitor's session, either response or request document. Usefully you can also specify a timeframe of all dates to the last 7 days.
Examples of using the quick search function are:
- Searching for an email address entered at login, this would be part of the request document
- Searching for an error message returned; this would be part of the response document
- Searching for a coupon code entered as part of a checkout process, this would be part of the request document
3. Workspace. The main functional area of the Portal resides for user interaction, e.g., the Dashboard(s) a user may view, Report Builder, Replay & Usability, Session Search and results, Session Lists, and many other functions.
Event Manager
From the Portal UI, navigation provides access to key capabilities within the solution such as Events, Sessions, Reporting, and others. Within each of these capabilities are the functions such as the 'Event Manager' described here.
The Event Manager supports the business user with capabilities required to build and manage events, including Hit and Session Attributes, Import / Exporting and access to useful components such as the 'Event Tester'.
Point 1, depicts the main Event Manager navigation, this may differ for some users (or may not be available) as can be configured to restrict the capabilities shown based upon group membership.
| Area | Description |
|---|---|
| Events | Creation and management of Events and Event Labels. |
| Hit Attributes | Creation and management of Hit Attributes and HA Groups. |
| Dimensions | Creation and management of Dimensions, also known as segmentation, and Report Groups. Report groups may also be referred to verbally as Dimension Groups, they provide a function to collate dimensions for segmenting reports. |
| Session Attributes | Creation and management of Session Attributes used for data long running or changing visitor session data. |
| Alerts | Create and manage Alerts for Events, Anomaly Detection, Anomaly Detection Reports, and Canister Alerts. Alerts can also be grouped here. |
| Anomaly Detection | Configure Anomaly detection and Ratios. |
| Import | Import Events, this will include associated supporting components. |
| Export | Export Events, this will include associated supporting components. |
| Event Tester | Access the Event Tester, this is described in more detail later in this guide. |
| Save Changes | After creating an 'event' it will be in Draft, 'Save Changes' will commit these to the system. |
| Revert All | Revert any draft changes to their previous saved state. |
| History | Review History of saved changes over a two week period. |
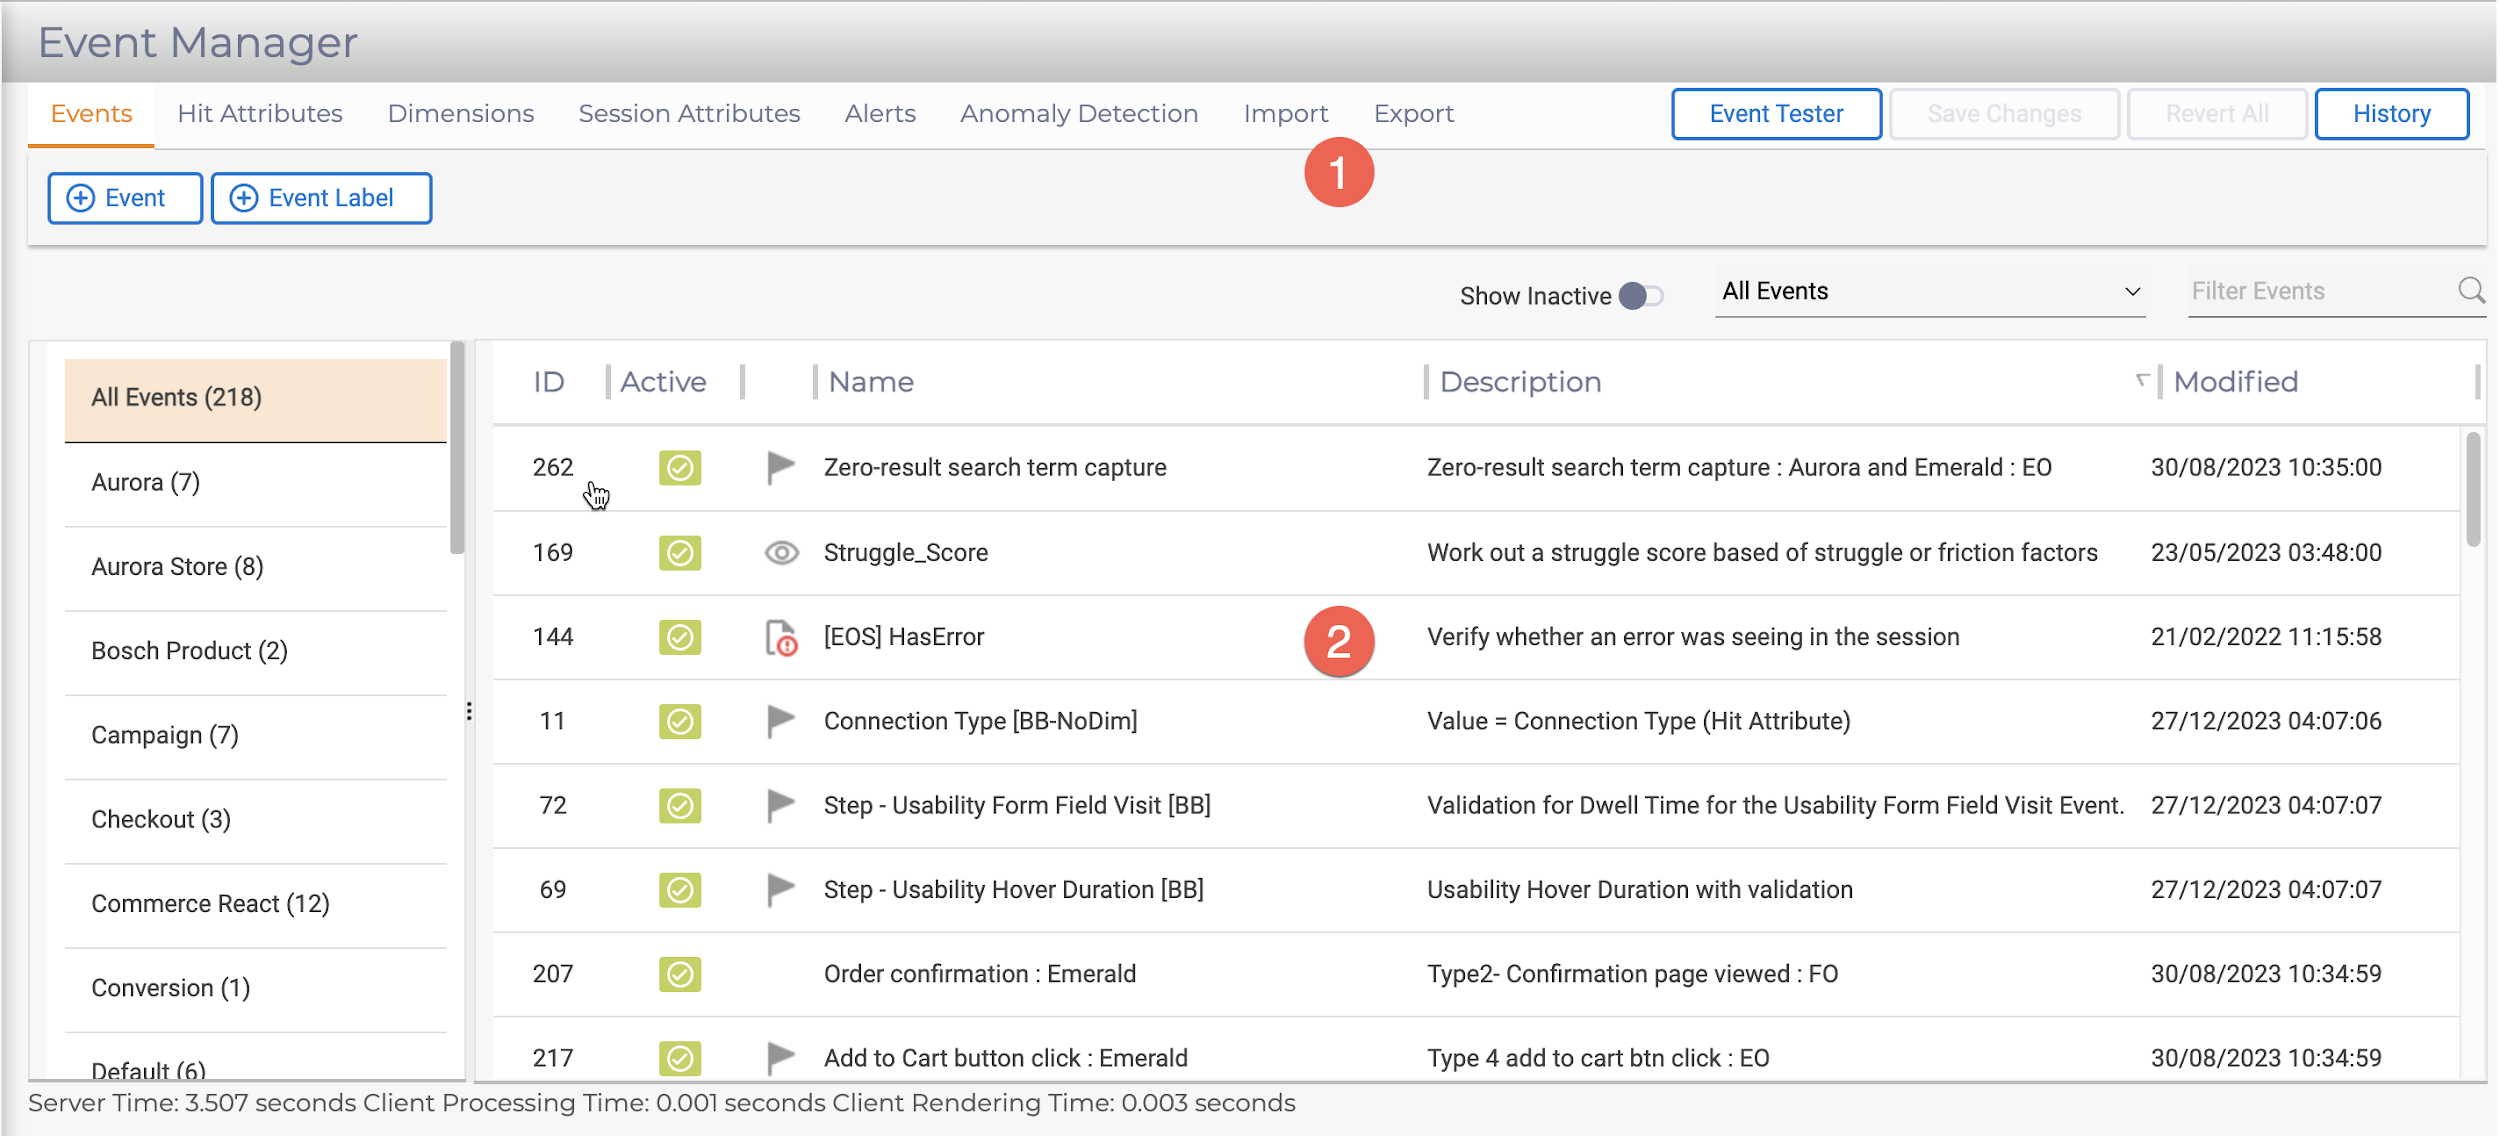
Point 2, depicts the main summary or list view of each tab's contents, shown in the screenshot above is the list of events filtered by the labels they are grouped by.
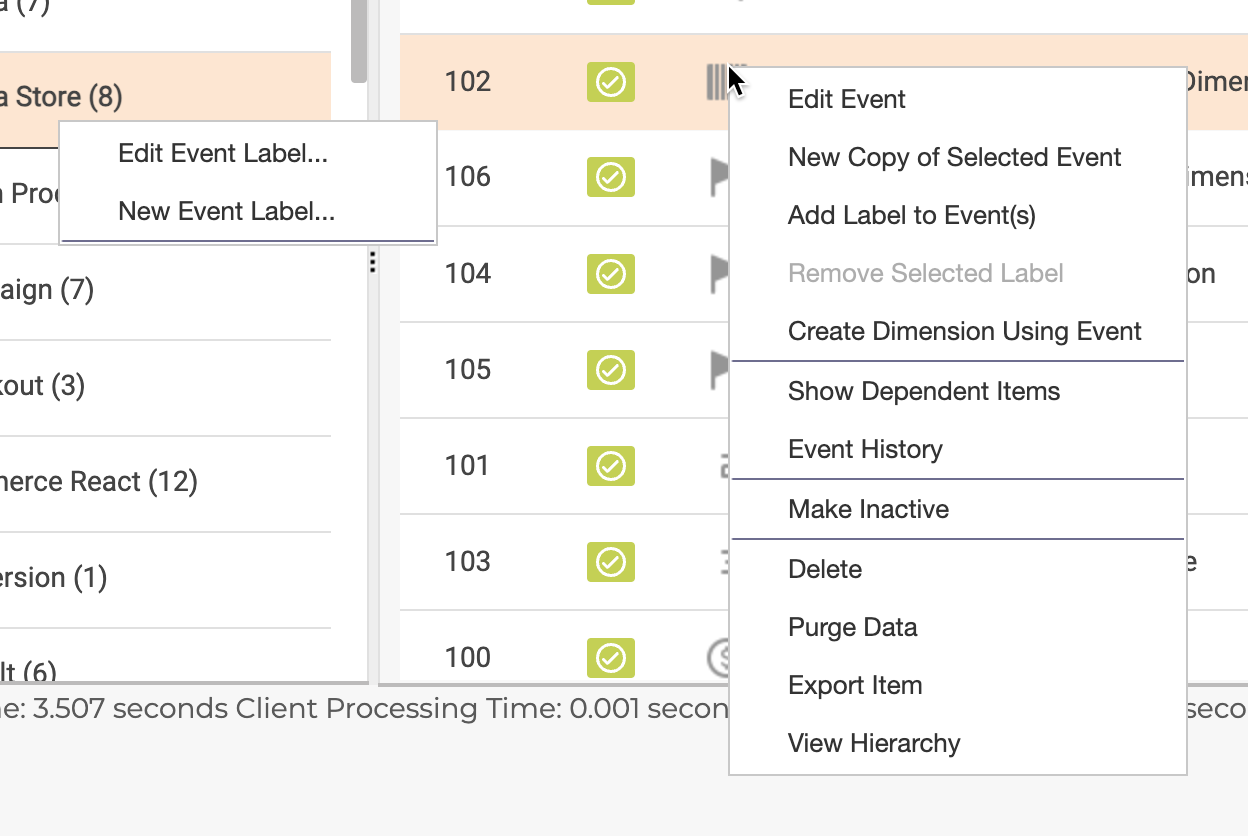
Right-clicking in the navigation or event list view reveals additional options to work with the event or event label.
Session Search
The session search UI provides you with the ability to quickly locate sessions of interest, typically for identifying visitor behaviours using 'replay' or analyst 'event' building purposes also via replay.
Sessions can be initially filtered by searching either between sessions that are in progress 'Active' or have 'Complete'
100's or 1000's of sessions may be stored within Discover, so session search is useful to allow you to identify specific sessions. Adding fields from the 'Search Fields' menu and inputting values will narrow the list of returned sessions after clicking the 'Search' button.
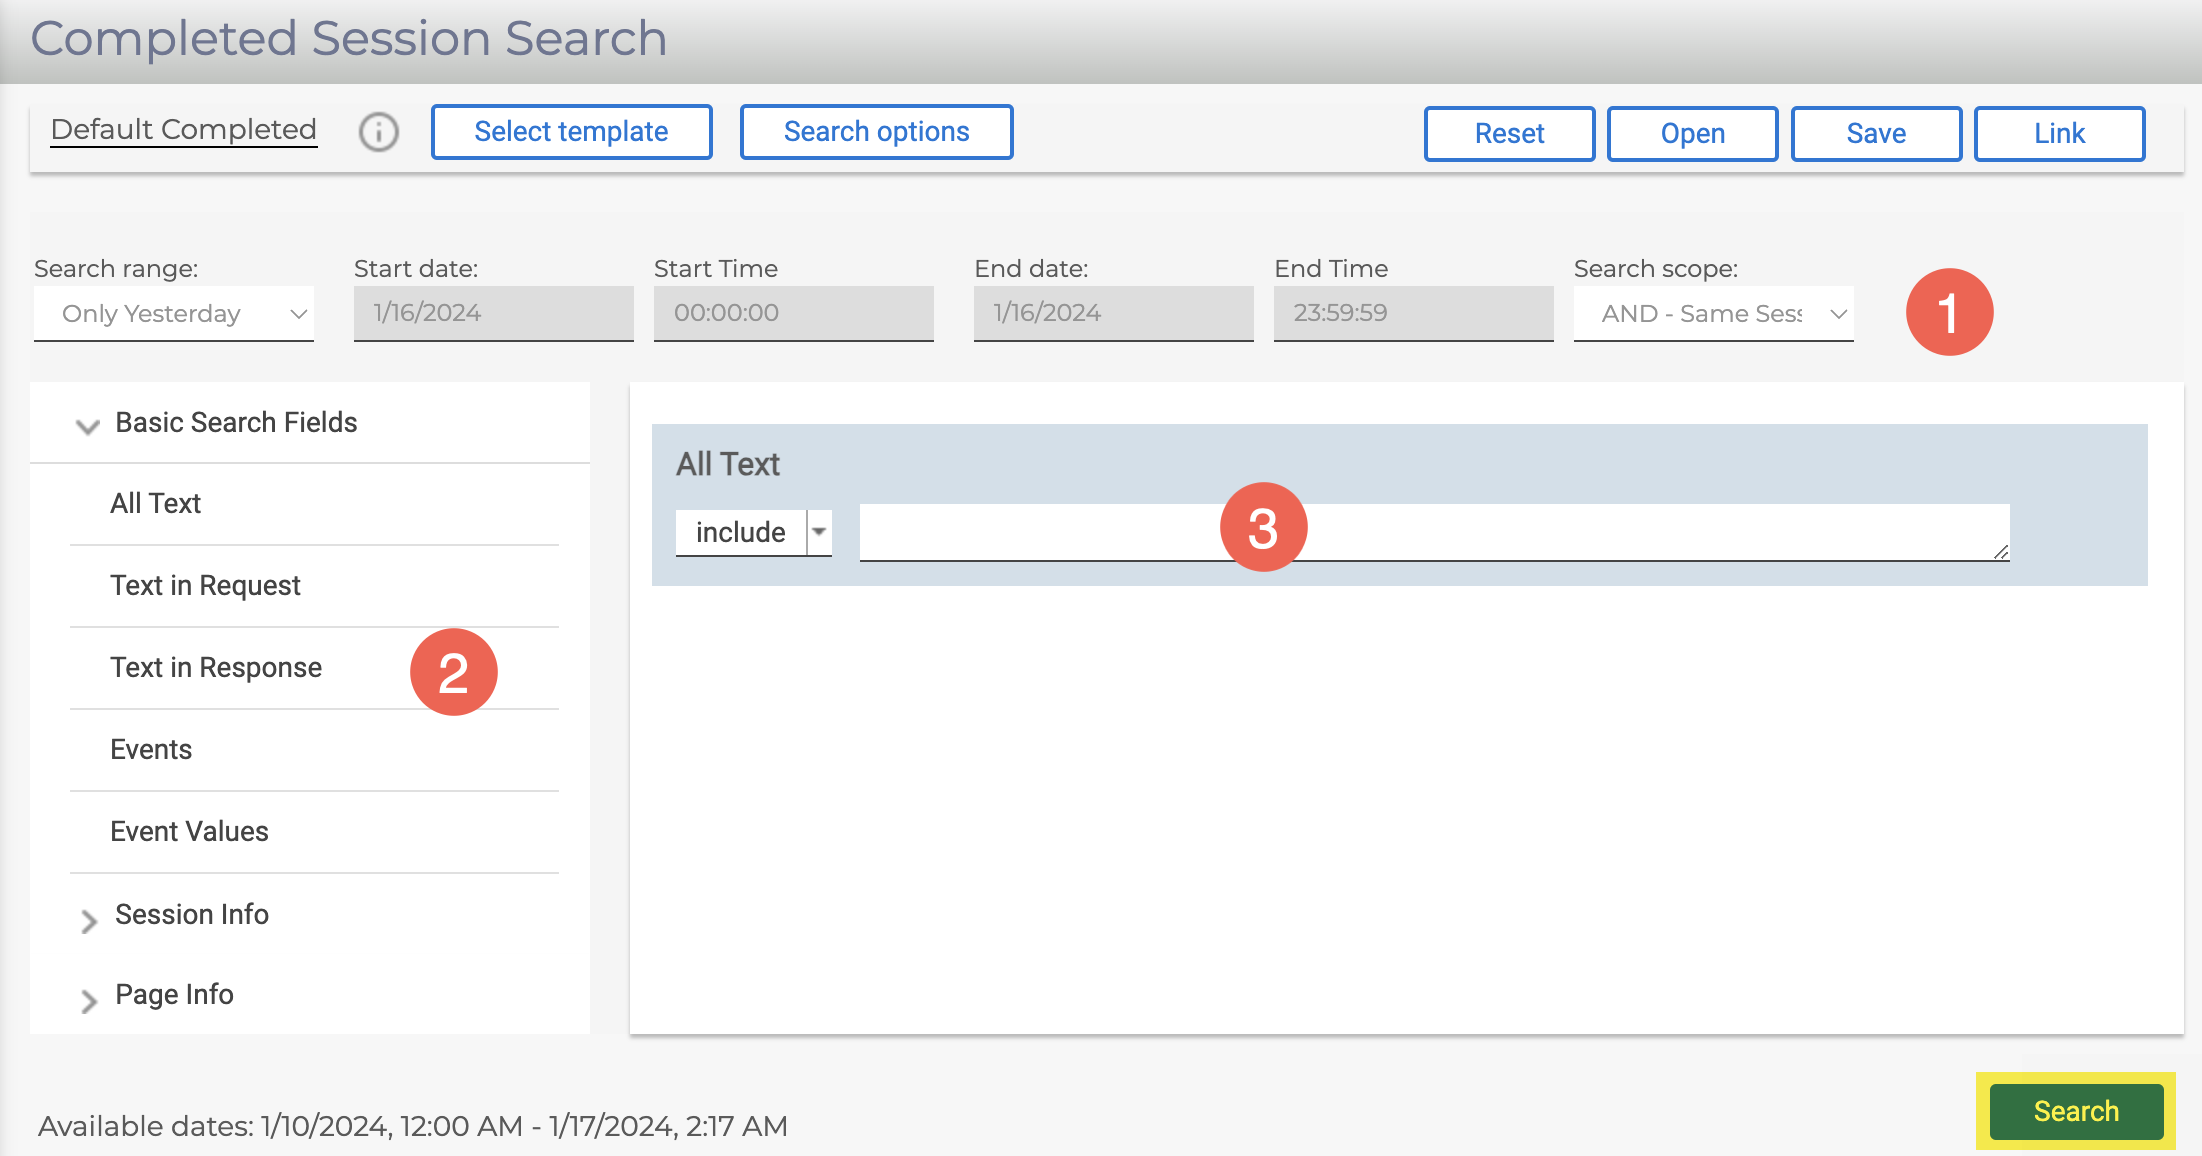
Point 1, depicts the 'search range' is used to narrow the resulting session list returned. The default is 'Available Dates' (e.g., all sessions), however with large volumes it is better to reduce this to specific hours or days.
Point 2, by clicking the individual 'search fields' adds them to the search input area (3) where they can be updated to locate content within the sessions.
Point 3, the 'search input' allows for individual fields to 'Include or Exclude' content, multiple fields and content can be used to reduce and pinpoint the sessions including the information required.
Report Builder
From the Portal UI, access to the Report Builder UI is via the main navigation where it provides the interface to create new and amend existing reports that are used throughout the system.
The report builder is used/available when:
-
Accessing the Report Builder via the main Port UI navigation.
-
Viewing a report via drill-down from a Dashboard.
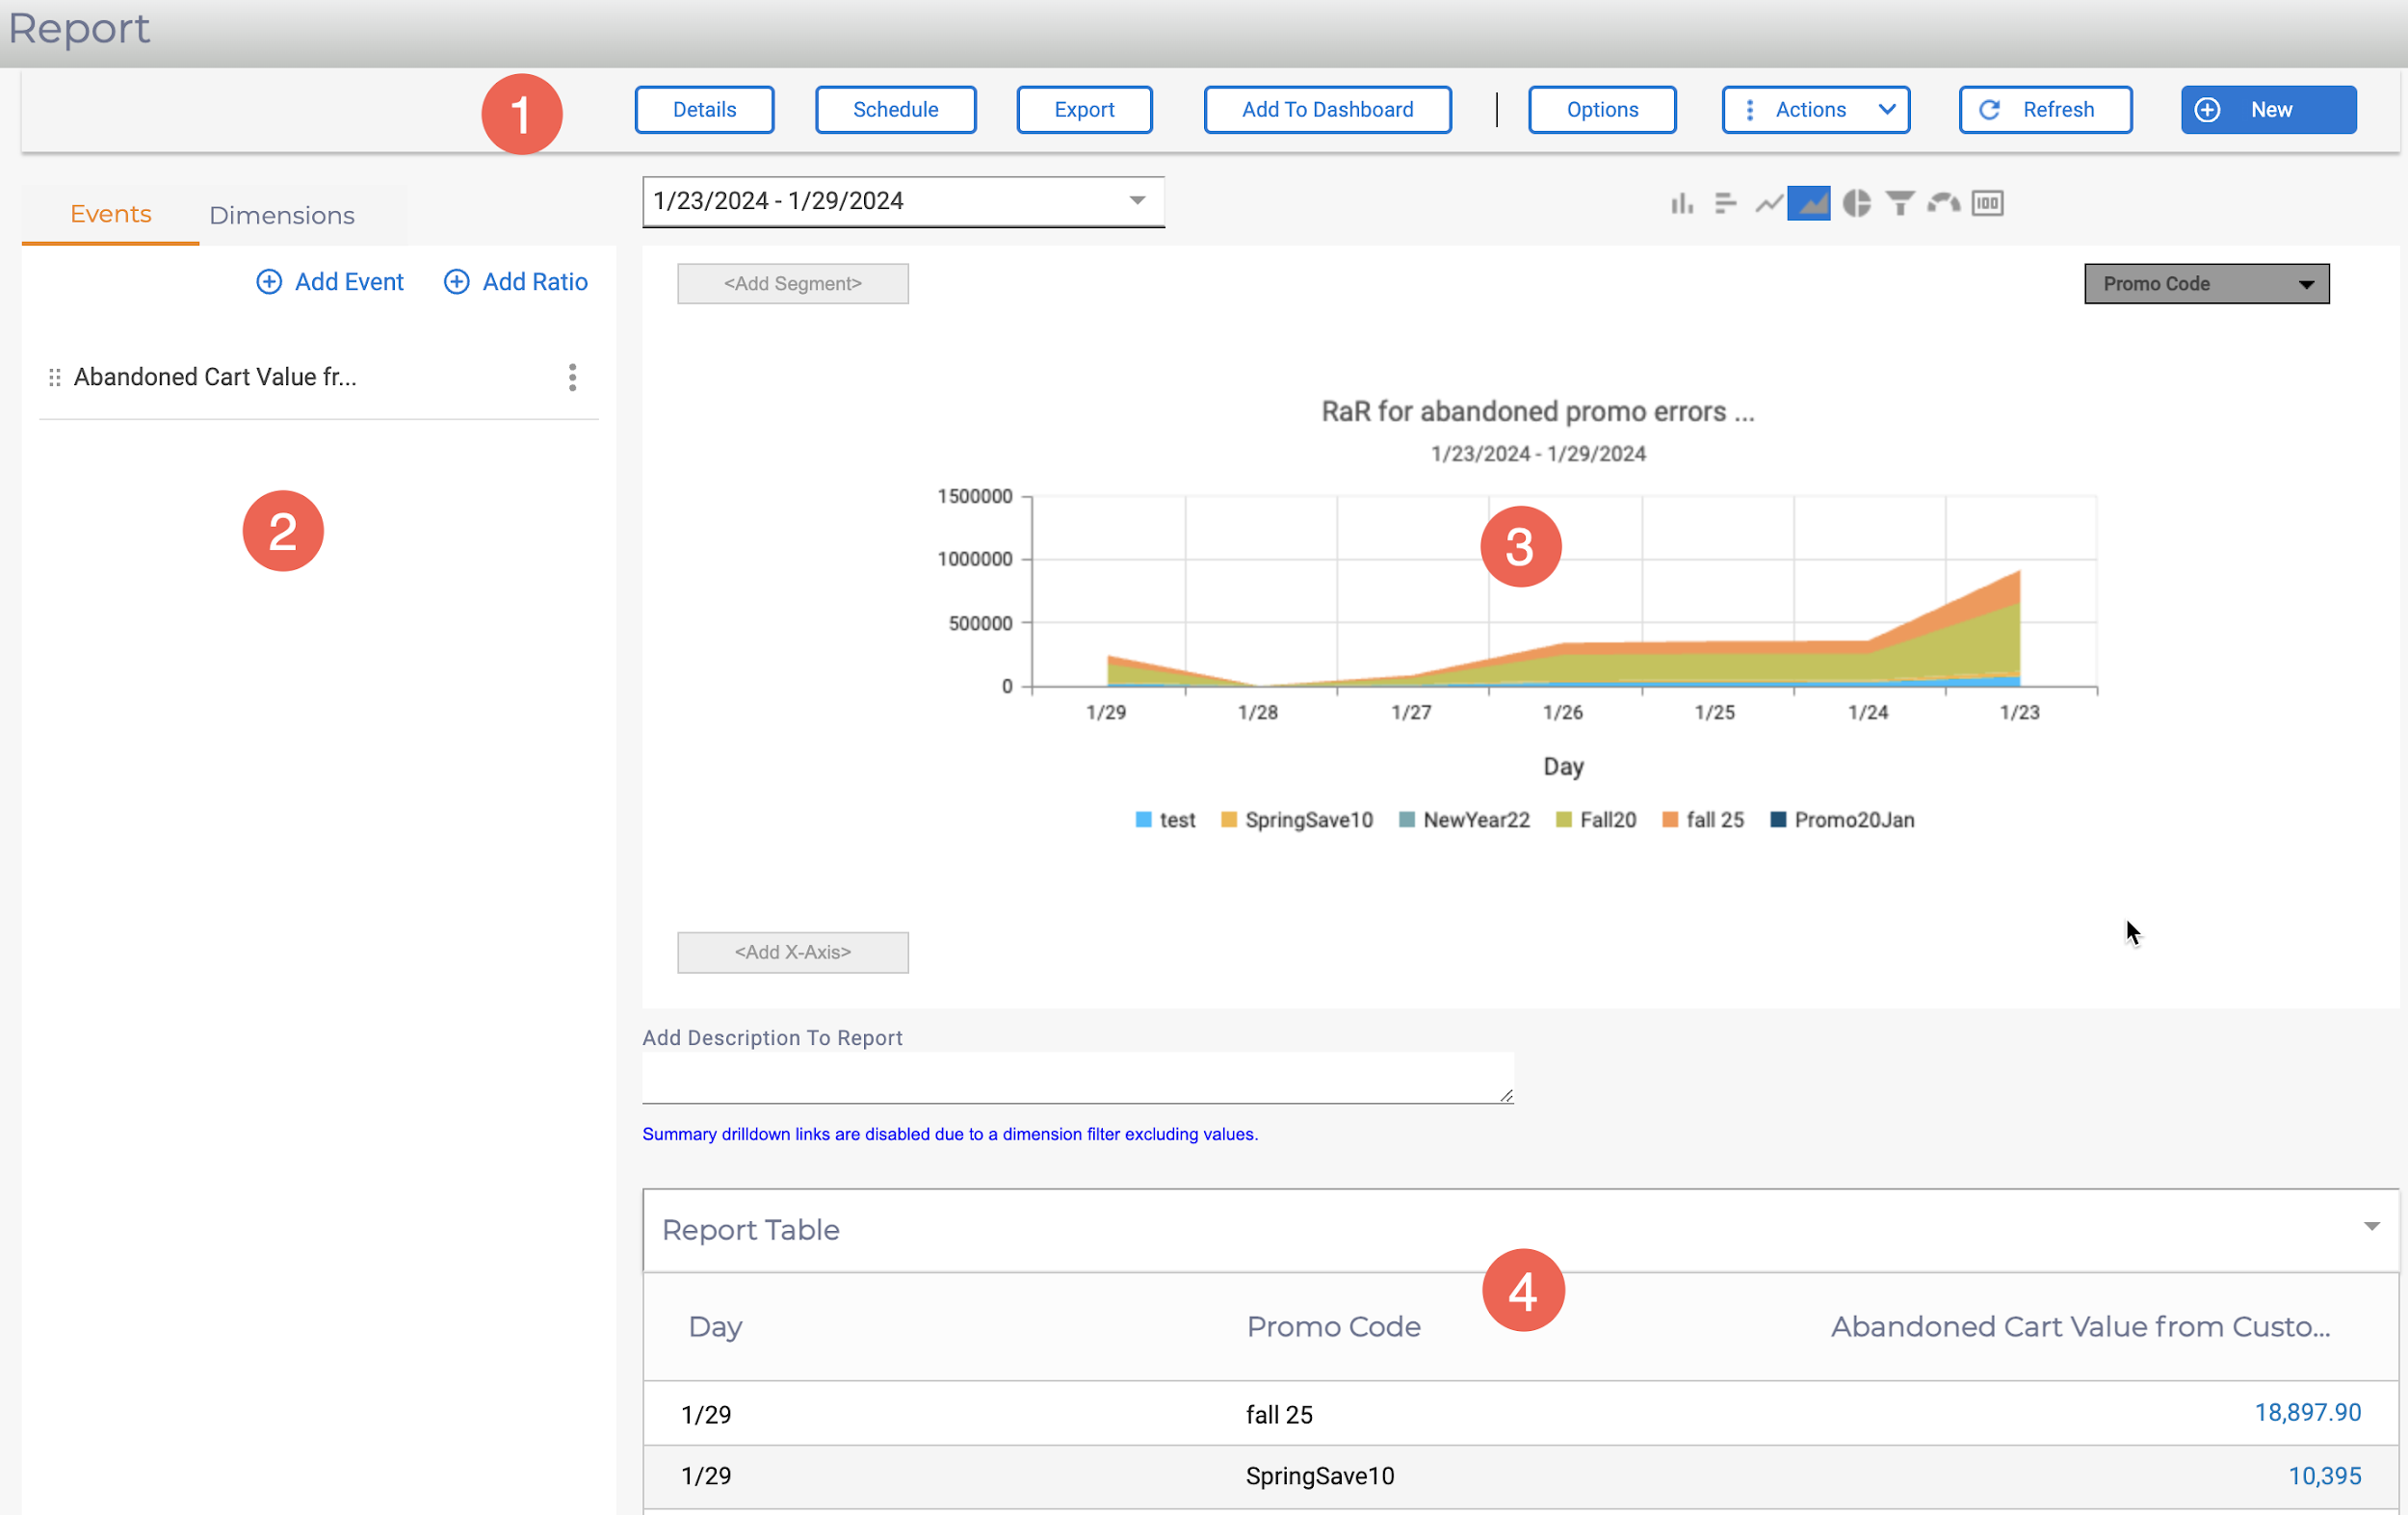
Point 1, depicts the main report building menu.
| Area | Description |
|---|---|
| Details | The options provides information about the current report being viewed. It displays 'report' information such as Name, Description, current Date Range, Metrics (what the report is based upon), and any Axis data, Segmentation or Filtering. |
| Schedule | schedule provides access to extend the report to email, including options to provide data in Excel or PDF formats. Email can be scheduled by Date ranges, Delivery time and set the report to a defined Time period (current day, week, etc...).Email to/cc/bcc recipients are defined through a comma separated format. |
| Export | Options to export the current report to Excel, PDF or Email as required. Exports include the chart information as well as the session list information. |
| Add to Dashboard | Option to add the current report to a specific dashboard and tab. Details can be configured for Colour, Type (Chart/Table), Placement, Update frequency, Drill-down capability, and Time period. |
| Options | Report options allow reports to be configured for Display, Metrics and Axis, Data Order and Security. This is a key configuration component for reports when placing them on dasgboards. |
| Actions | Actions allow the current report to be Saved, Saves As, Deleted, or a new report Opened. |
| Refresh | Refreshes the current report data. |
| New | Clears the current report and creates a new blank report for configuring. |
Point 2, depicts where events (and event ratios) and dimensions can be added to or updated for a report using simple drag/drop.
Dimensions can be dragged onto axes or segments. Report data/charting will update accordingly.
Point 3, defines the area where the report chart type, and segmentation can be applied. Chart types can be:
- Vertical and Horizontal Bar
- Line and Area
- Pie
- Funnel
- Doughnut
- Card
Point 4, is the 'Report Table'. Automatically populated with visitor session data aggregated by period (date, e.g., Day).