Analysis List and Document
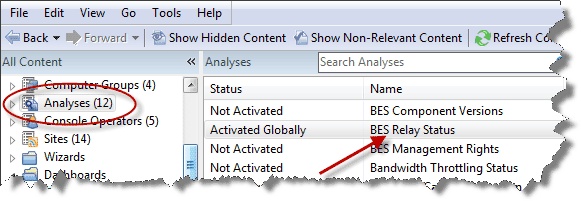
A list of Analyses is displayed when you click Analyses, or any of its child nodes, from the Domain Panel navigation tree.

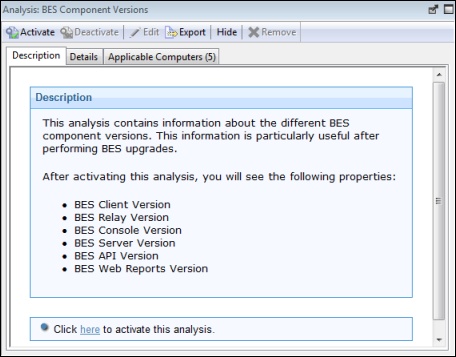
An Analysis document is displayed in the Work Area of the Console when you click an item from this list.

At the top of the Analysis document is the name of the analysis. There is a toolbar at the top of the window, with the following choices:
- Activate: Start the specified Analysis. This option is only available if the Analysis is currently deactivated.
- Deactivate: Stop the specified Analysis. This option is only available if the Analysis is currently activated.
- Edit: Make changes to this Analysis. This option is only available if this is a custom Analysis.
- Export: Save a copy of this Analysis to import it into a different Console or deployment or to edit it in an external editor.
- Hide Globally: Hide this Analysis from all Consoles.
- Hide Locally: Hide this Analysis from the local Console only.
- Remove: Delete the Analysis. This option is only available for custom Analyses.
There are several tabs in an Analysis document. They include:
- Description: An HTML page describing the Analysis, along with a link to activate or deactivate the Analysis.
- Details: An HTML page listing the various Analysis attributes, including Properties and Relevance. At the bottom of the page is a text box for entering a Comment attached to the Analysis.
- Results: A dialog displaying the results of the Analysis. This tab is only visible for an activated Analysis.
- Applicable Computers: A list of the Clients where this Analysis is applicable. This is a typical filter/list panel for computers; click a filter in the left panel to narrow down the list of computers in the right panel.
To display an Analysis list, click the Analyses icon (or any of its child nodes) in the Domain Panel navigation tree.
An Analysis document is opened whenever you open an item in an Analysis list.