Example Use Cases
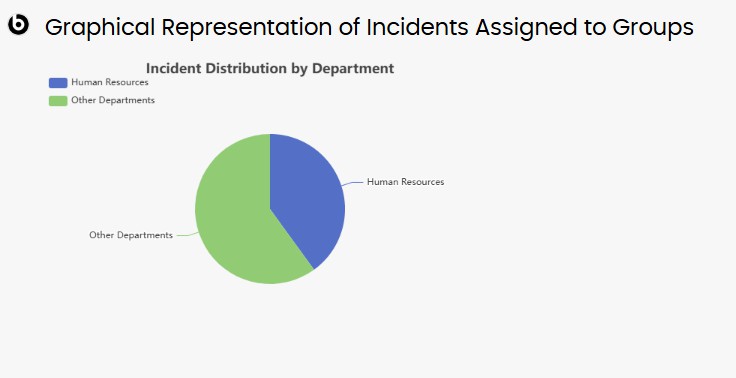
Incident Analytics
- Sample User Query - Show the number of incidents assigned to the “Catalog Manager
Group” and other groups in a graphical representation
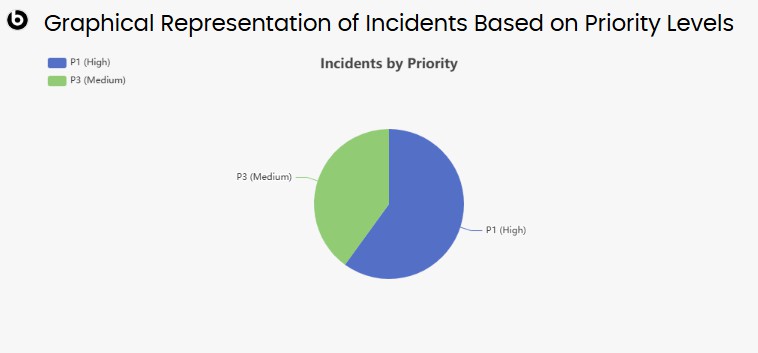
Priority Breakdown
- Sample User Query - Provide a graphical representation of incidents based on their
priority levels, showing how many incidents fall into each priority
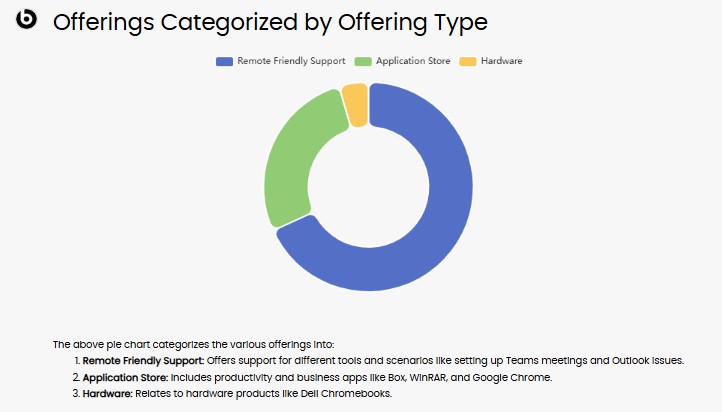
Service Offering Overview
- Sample User Query - Display the different types of offerings you provide in a
graphical view, categorized by offering type
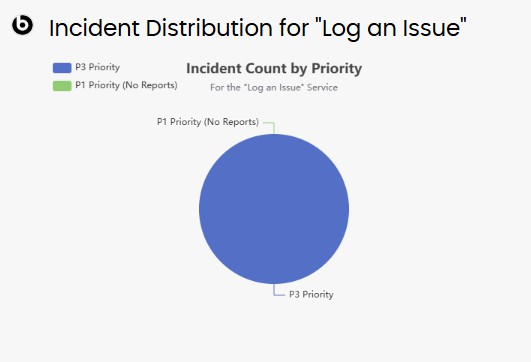
Service-Specific Trends
- Sample User Query - Show the number of incidents raised for the service "Log an Issue"
using a pie chart