Manage
- Site Setting
- Configuration
- Processing
- Health Status
Site Setting
This section enables users to manage the component details within the environment. In the top navigation bar, click on Manage → Site Settings.
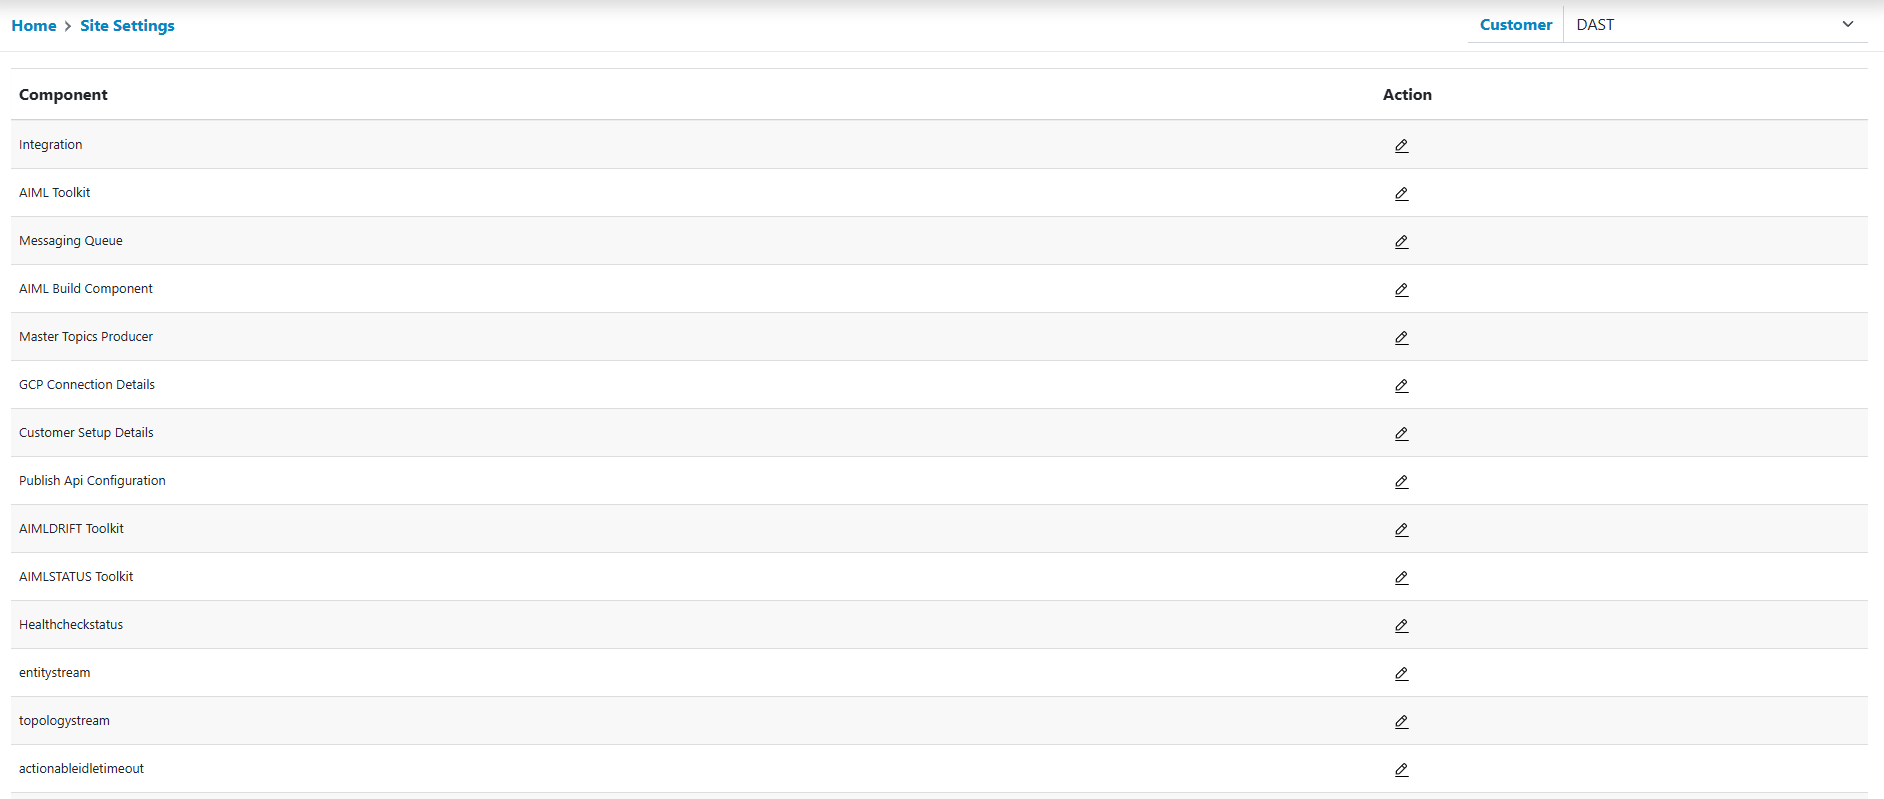
All components are listed here:
- Like with other pages, the user can act based on its role on the screen.
Possible actions are edit/view. Only the user with edit action can make changes to the
setting details.
Figure 2. Edit Action 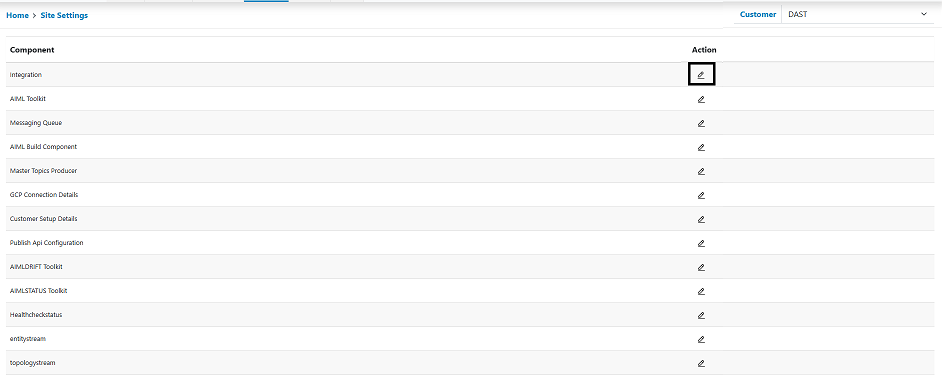
Figure 3. Site Settings Page 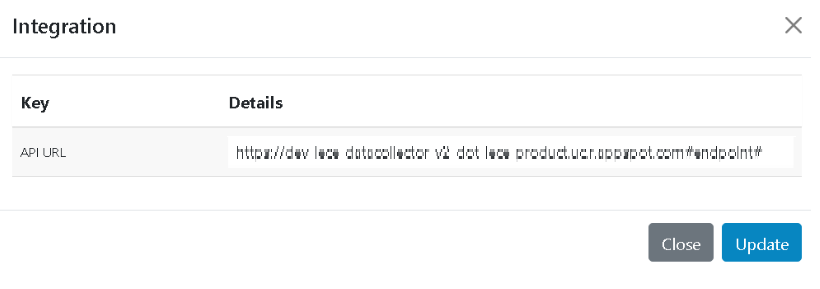
- Click on the configure icon next to a component. The following popup is displayed wherein all the requested details are displayed in key/value format.
- Update the details and click on Save.Note:For the user with view access the save button will be disabled.
- On successful update the following message “Component Updated Successfully” is prompted
to user.
Figure 4. Alert Message 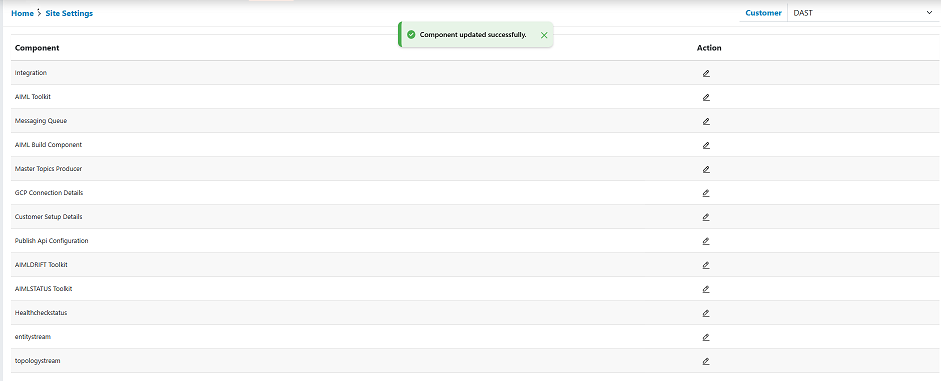
- Users will be redirecting the control back to the list page.
- Apart from the API URL Key, users have messaging Queue - Kafka, GCP Connection Details
where in the broker details need to be provided as separate list.
Figure 5. GCP Connection Details 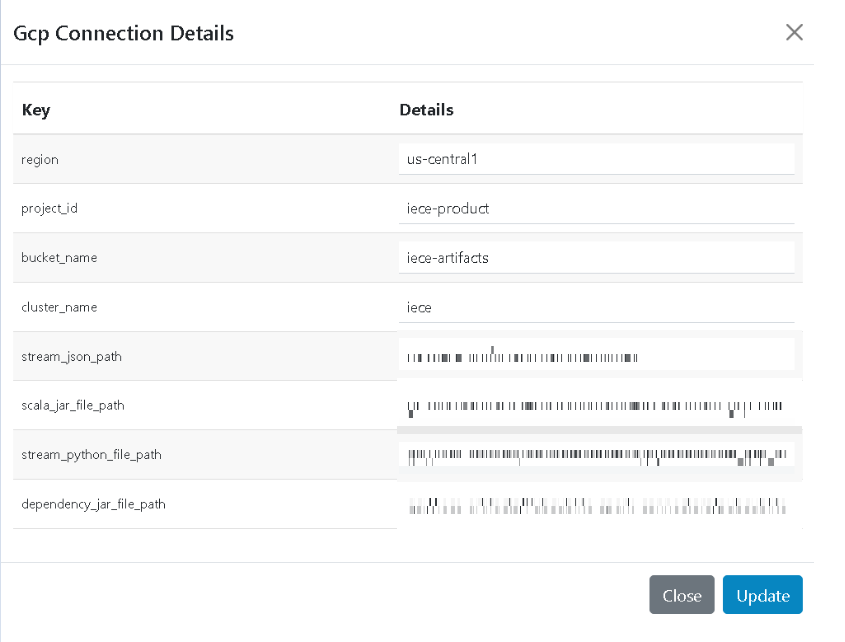
Configuration
- This section enables users to manage the configurations within the iECE environment. In the top navigation bar, click on Manage 🡪 Configurations to open this page.
- Default configurations property groups are displayed which is applicable for the
complete environment. Click on the configure icon next to the group, all its associated
keys with the default values will be displayed.
Figure 6. Configuration Page 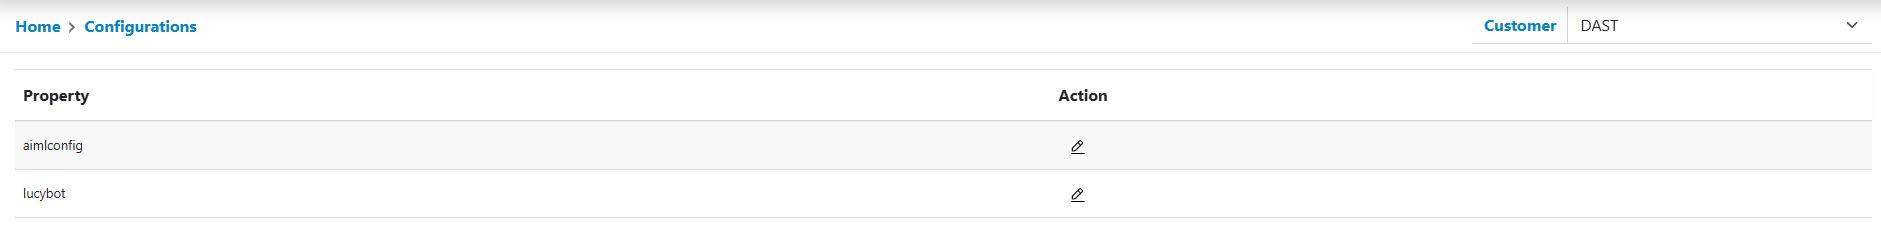
- These are key value pairs, where the expected values unit are displayed along with the
key detail only. As the values are changed, click on Save for the same to be effective.
Like with other pages, as Save is clicked, on success a confirmation message is displayed.
Click Ok to go back to the main view.Note:
Like with other pages, a user’s role controls whether editing can be performed by him/her, or they can just view the data.
- In addition to the default configuration, users can specify customer specific key values as all. Clicking on the Dropdown displays all the customers created within the environment.
- As users select the customer, keys which can be overridden customer wise will be
displayed which at present are only Lucy Bot details as shown below:
Figure 7. Alpha Customer 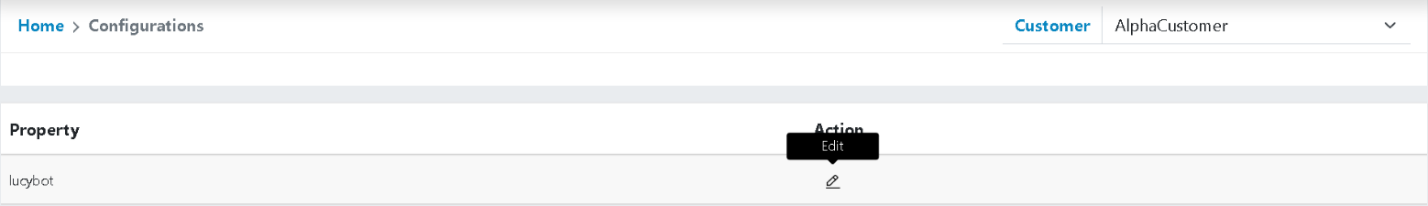
- Clicking Configure helps us capture the customer specific Lucy Bot details. Clicking
Save will display a confirmation message. Clicking Ok in the confirmation dialog box will
redirect the control back to the list page.
Figure 8. Lucy Chatbot 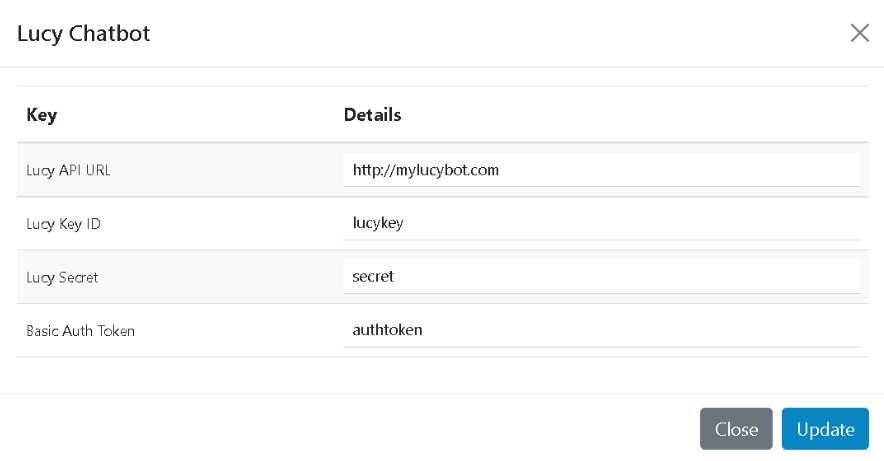 Note:
Note:This page is for the system admin user only and is not to be made available to generic admin or operations users. As this controls the related processing functionality.
Figure 9. Alert Message 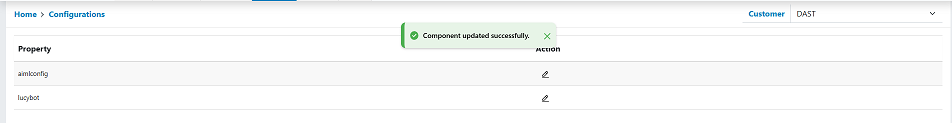
Processing
This section enables us to manage the processing enabled within the iECE environment.
- In the top navigation bar, click on Manage -> Processing to open this
page.
Figure 10. Processing Page 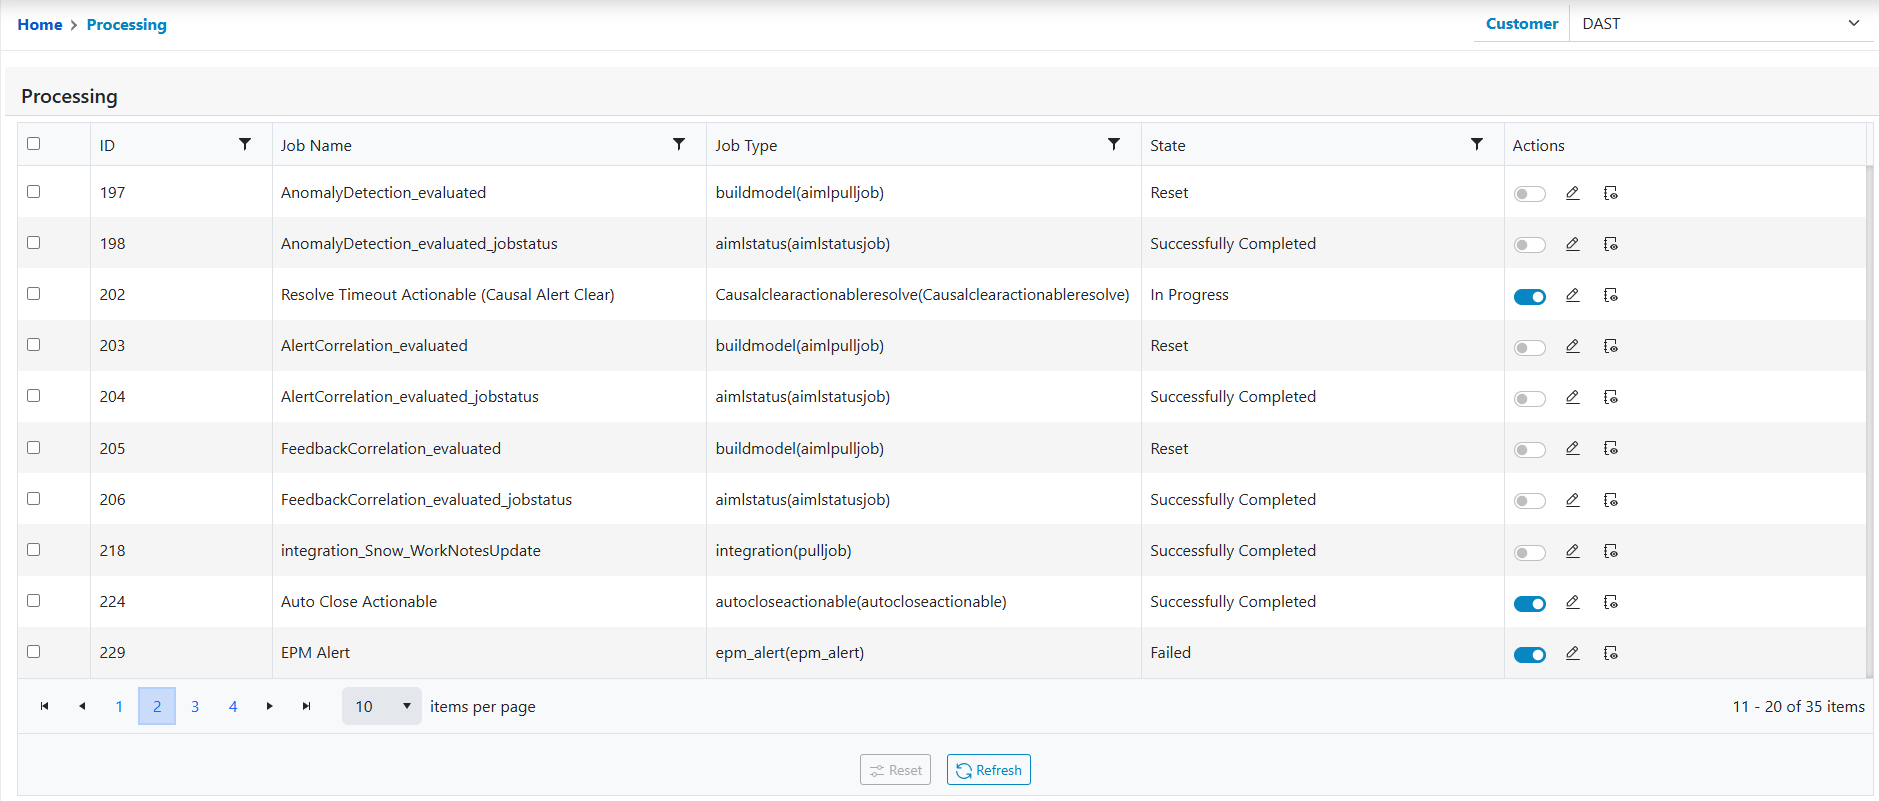
- All processes that are running in the environment are displayed here. Like with other
pages user can act on this screen depending on its role. Actions available on the screen
are:
- Customer Dropdown
- Enable/Disable
- Edit
- Reset
- Clone
- Delete
- View Logs
Customer Dropdown
The steps involved in viewing the jobs as per customer selection:- In the navigation, click on Manage, then go to the Processing Screen.
- Click on Select a customer dropdown as shown in the panel. A dropdown list of customers configured in the environment will be displayed.
- Click on the customer to be selected for achieving a customer specific view.
- Processing jobs will be displayed for the selected customers.
Figure 11. Selecting a Customer Dropdown for Processing 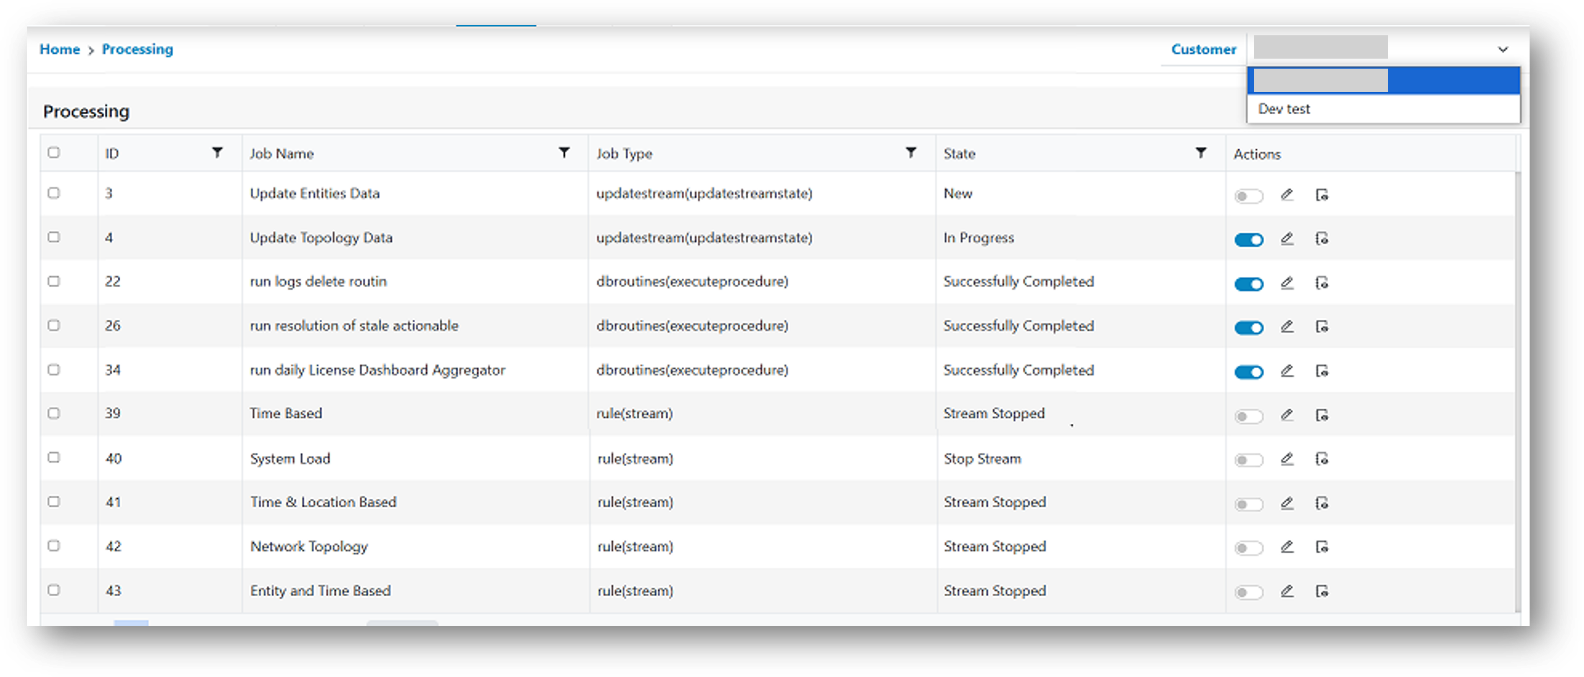
Enable/Disable
- Click on the Toggle icon in the Enable column next to the processing ID whose enablement
status is to be changed as shown:
Figure 12. Enable/Disable 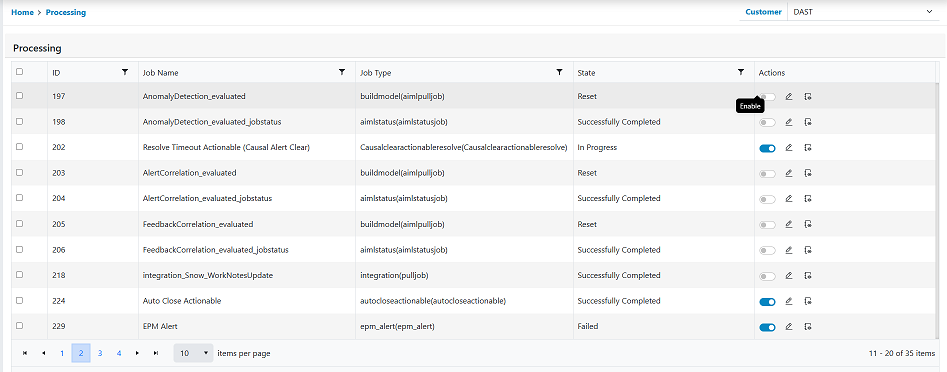
- If the processing is enabled, it is identified by a blue toggle button, toggling will disable the processing. For example, parse let us disable processing id 1. As can be seen it has enabled Click on the toggle button. On successful update the button will be disabled, and a successful prompt is displayed.
- If the processing is disabled identified by a greyed-out toggle button, toggling will
enable the processing. Let’s enable the processing id 1 again. As its disabled in the
previous step, it will appear Click on the Toggle button. Like in Step 2, on successful
enablement, the enable button changes to blue and the following prompt is displayed.Note:When the processing jobs are added in the environment, primarily they are in disabled mode, user need to enable them from this screen to start it.
- However, if users require the enabled processing jobs to temporarily stop for some time without deleting the processing jobs, then from this screen the user can disable them temporarily, this will stop the respective processing till it’s enabled again.
Reset
Reset action enables us to reset the current state of the running jobs. This action is used if the processing’s seems to be stuck e.g., it’s lying in picked state or in in progress state in case of scheduled jobs where the expected state is to be either completed or failed, this can happen if there’s an issue with the underlying processing component.
In such scenarios, users can use this action to reset the states, so that it can be picked and processed again. Note this also enables us to reinitiate the long running jobs as user ll such as the consumer or streaming jobs, in both cases resetting will restart the respective processing.
- Select the processing’s by either clicking on the check boxes next to them or by using Select All.
- As the records are selected, the icons in the footer will be enabled. Click on the Reset
icon.
Figure 13. Reset Action 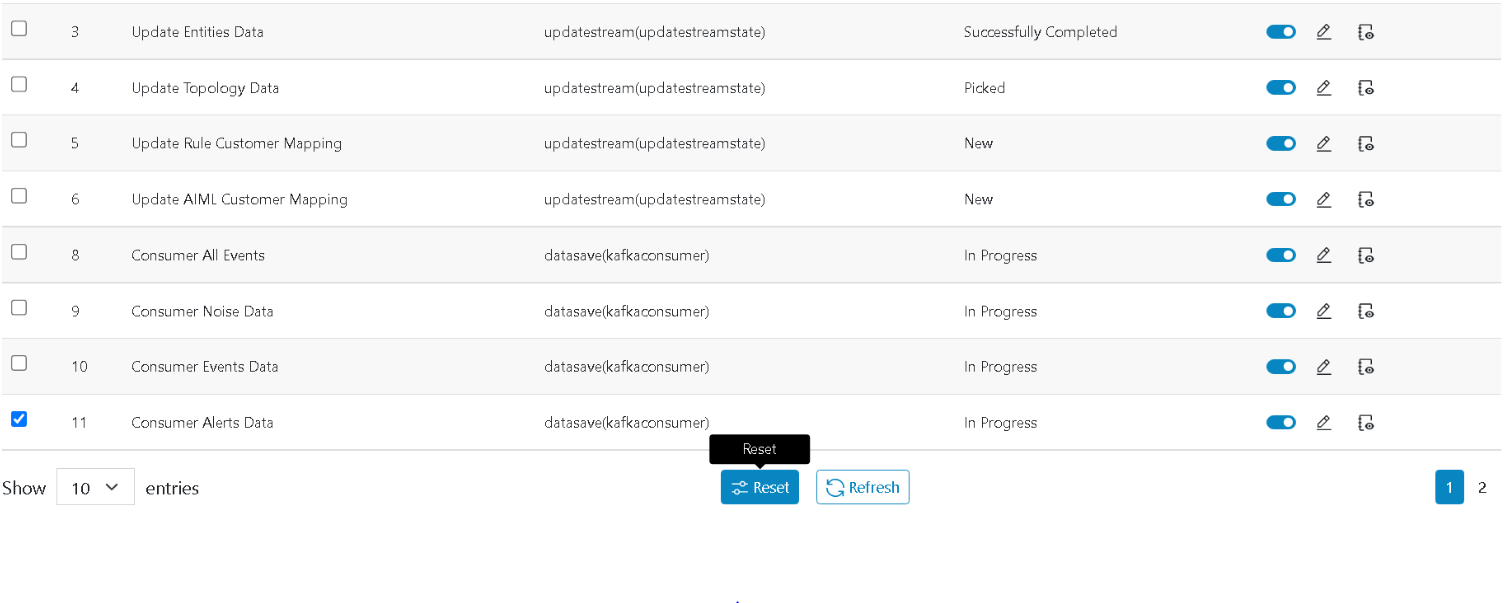
- Users will be prompted for confirmation.
Figure 14. Confirmation Pop-Up 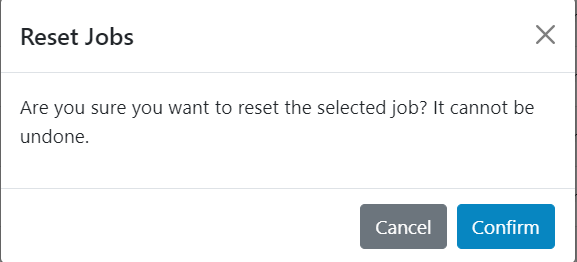
- Click on Confirm.
- On successful update, the following confirmation box will be prompted. Click on Close to
remove the prompt message.
Figure 15. Alert Message 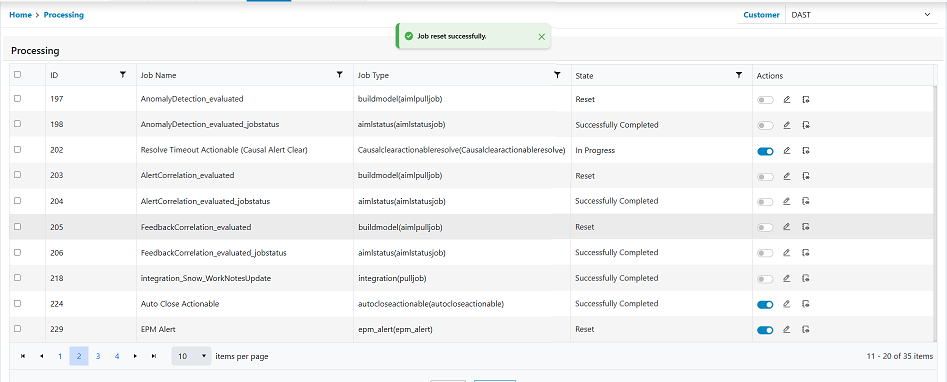
Edit
This action enables us to update processing specific details such as name, its associated parameters, schedule details in case of a scheduled job.
- Click on the Edit icon next to the processing whose details are to be
edited.
Figure 16. Update Processing 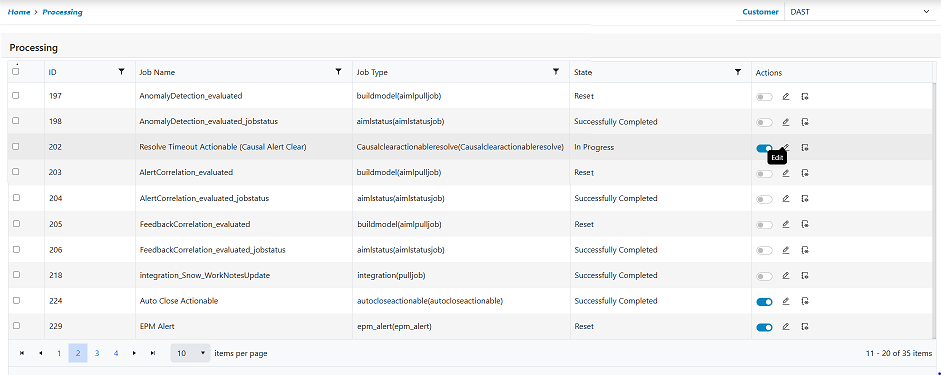
- The following slider opens, prepopulated with the saved data. The default two tabs are enabled for all General and Parameter. However, if it is a Scheduled processing, a scheduled tab will also be enabled, enabling the users to manage the scheduling property for the processing. Also note that the details in the parameter tab vary as per the Job Type.
- The parameter section displays few read only details and the ones which are editable
either have a dropdown with values to select from or have help text associated to help
enable the expected values.
Figure 17. Updating Values 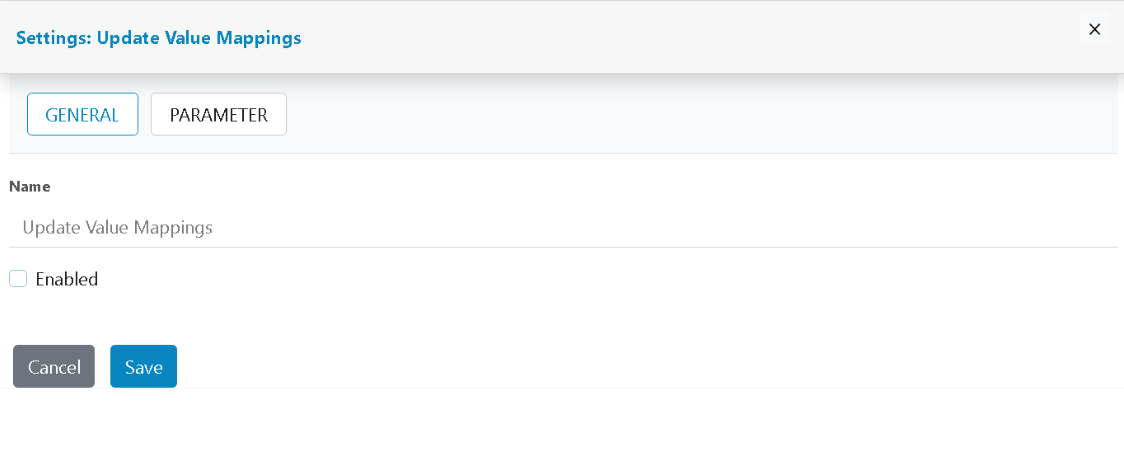
Figure 18. Updating Parameter 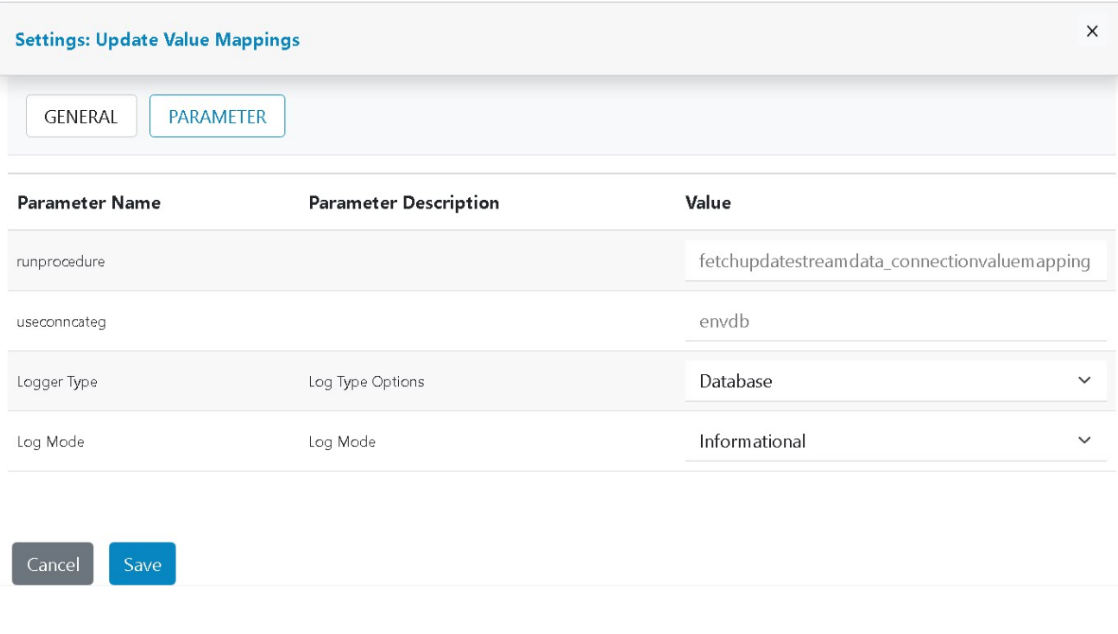
- When the desired changes are done, click on the Save button.
- On successful update, a confirmation message is prompted.
Figure 19. Alert Message 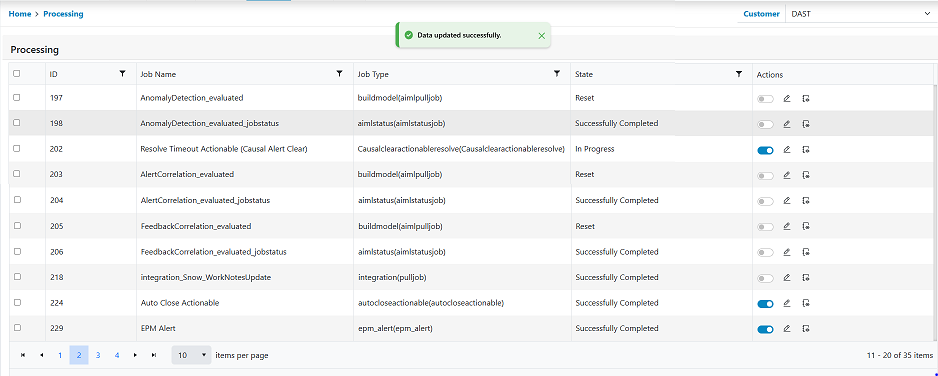
- Return to the main grid.
Figure 20. Processing Main Grid 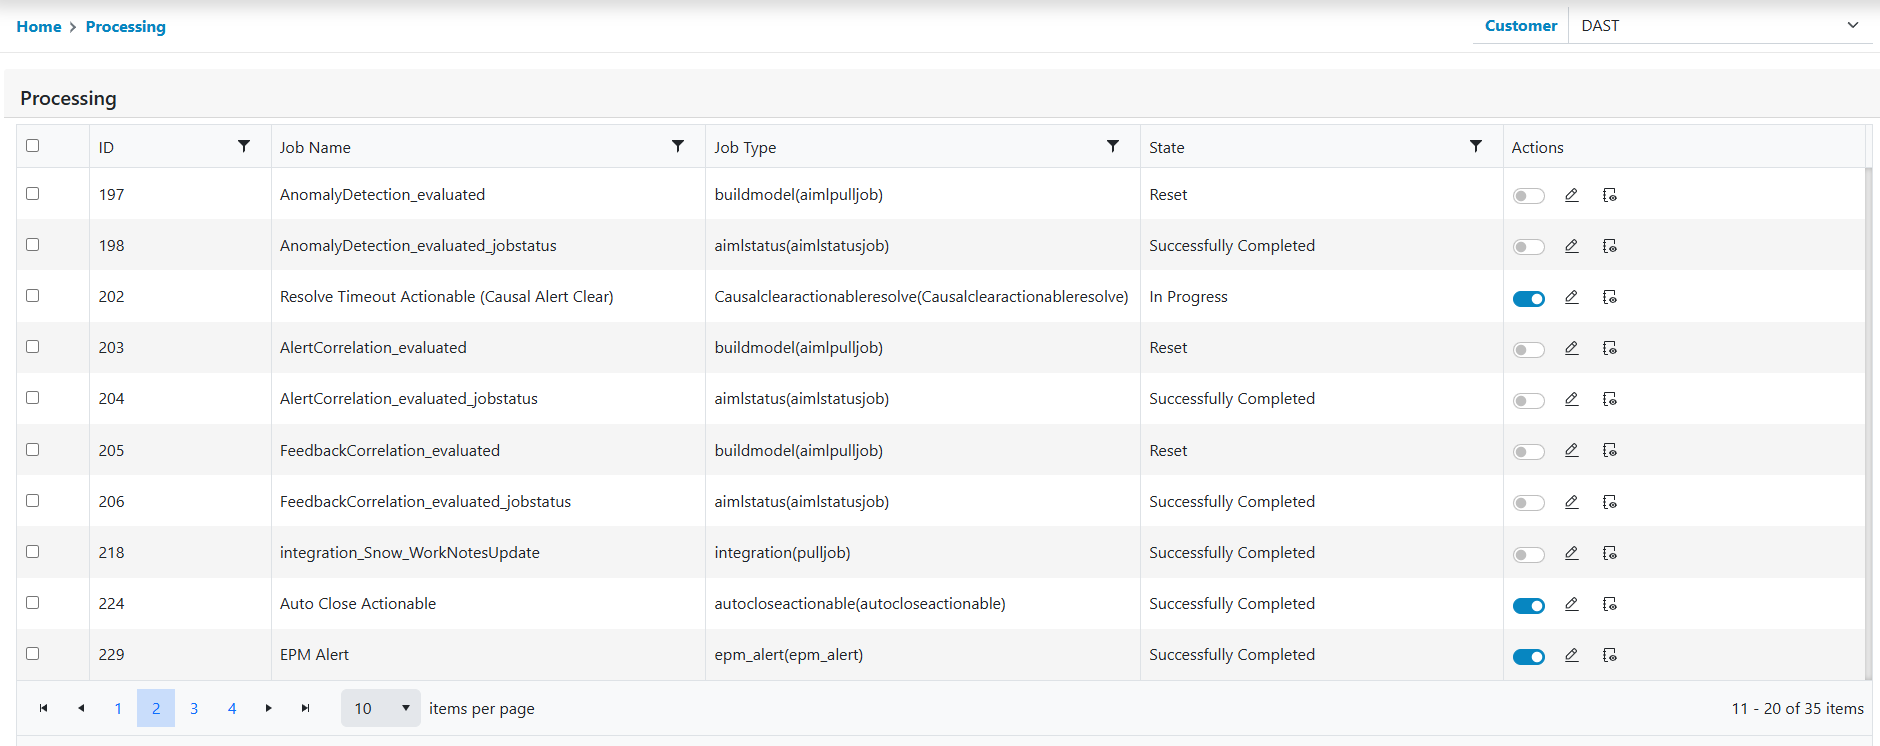
View Logs
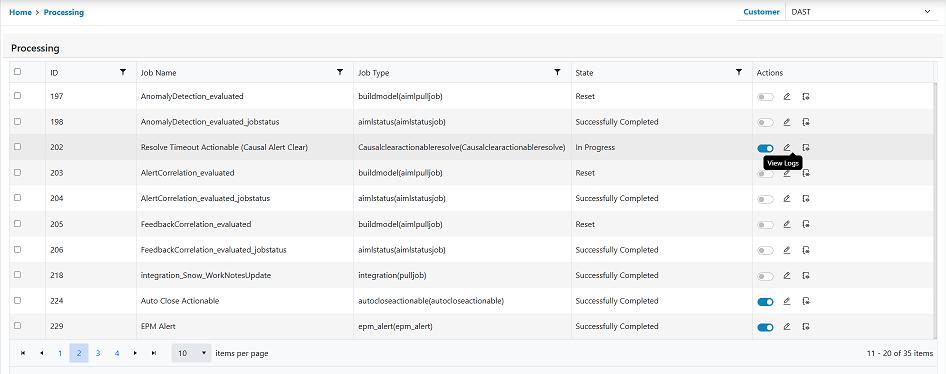
- Click on the Log icon next to the processing id whose log is to be seen.
- The following slides open where the logs are displayed for the selected processing id. The icon color depicts whether the log is informational or is an error. Red icon denotes error.
- Copy icons in the message column can be used to copy and paste the text in the local
text editors such as notepad when the message is long and is not properly visible in the
column.
Figure 22. View Logs Routine 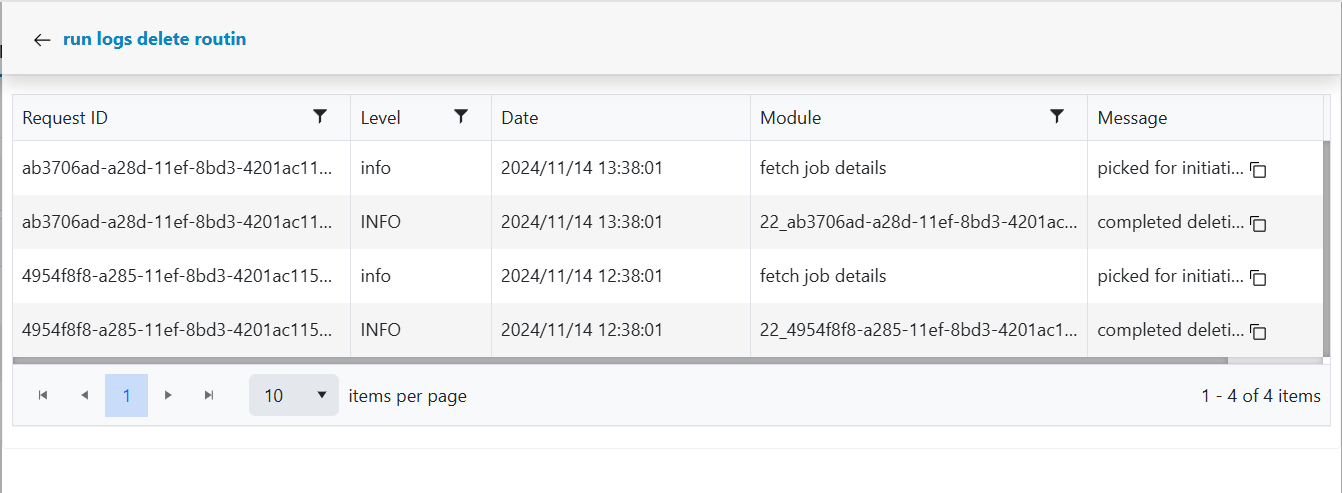
- Normal grid search and sort functionality works in this grid as user ll. Click on the back arrow next to close the slider and return to the main grid.
Apply Filter
The steps involved in Apply Filter the Noise/Maintenance Window Data as per customer selection.
- Click on the Apply Filter available action button presents at the below header
of the console.
Figure 23. Apply Filter Operation 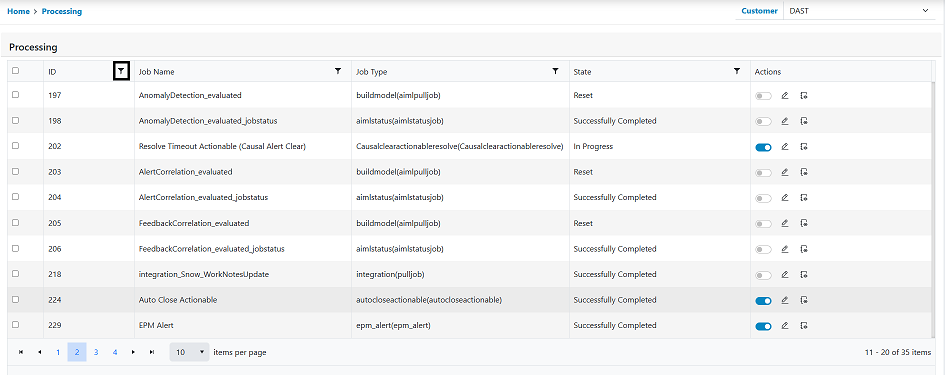
- The form will appear from there user can select Filed and operator from drop down list
and must write value. Then click on the apply button.
Figure 24. Apply Filter Operation 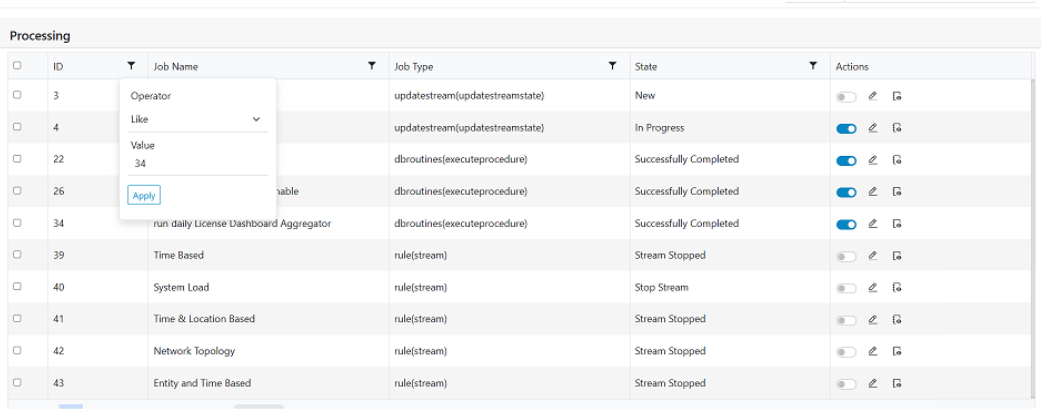
- Users can see the result of applied filter.
Figure 25. Apply Filter Result 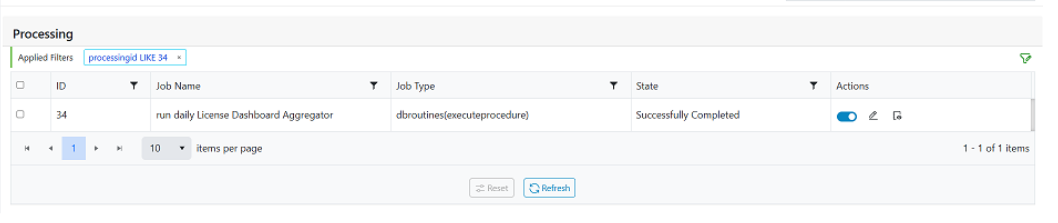
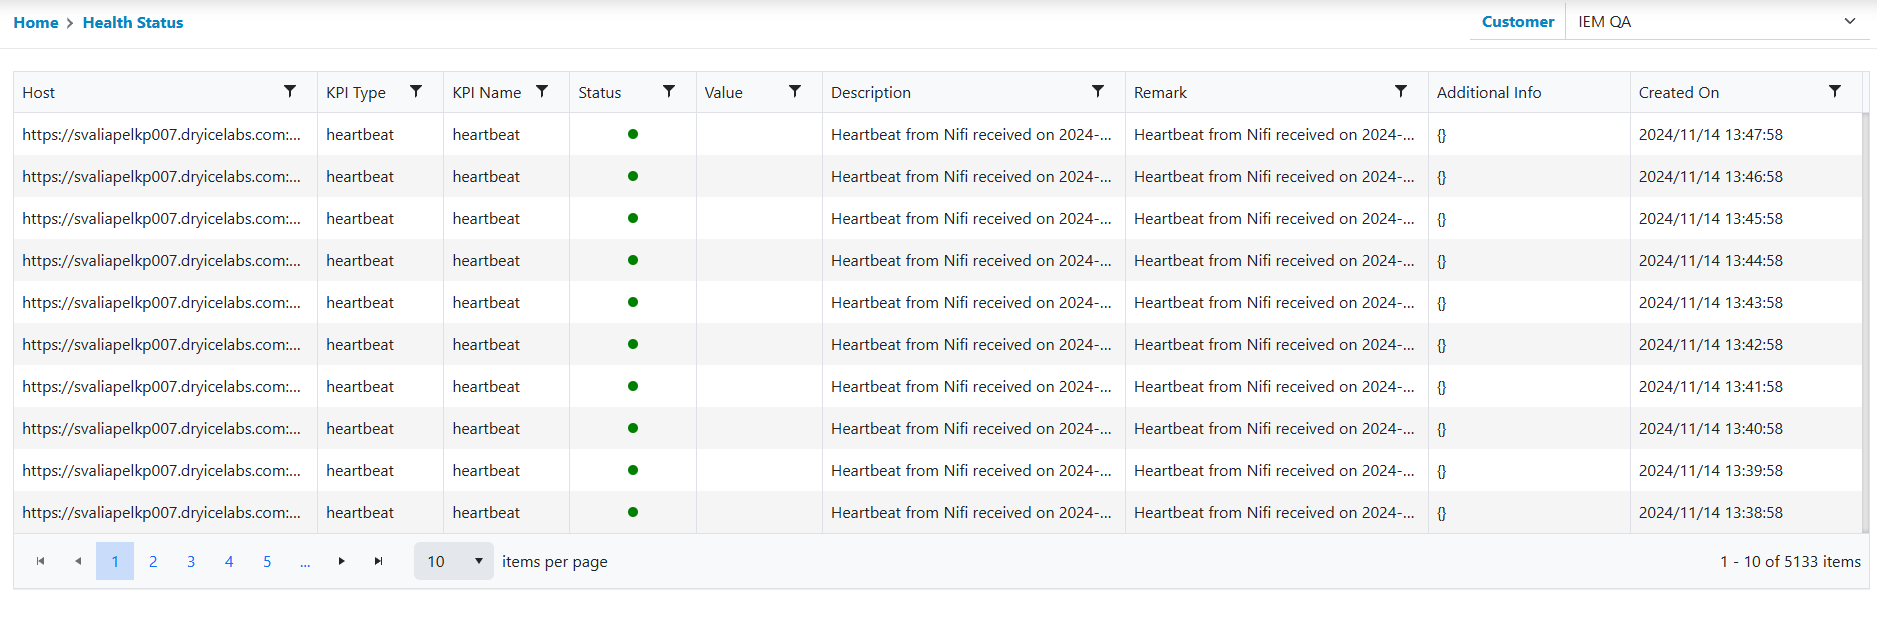
Health Status