Ticket Evaluation Report
Users can evaluate any built model for an organization, its module, and the mapped runbook tool.
- On the main menu bar, Click Logs and then click Ticket Evaluation Report.
Figure 1. Ticket Evaluation Report 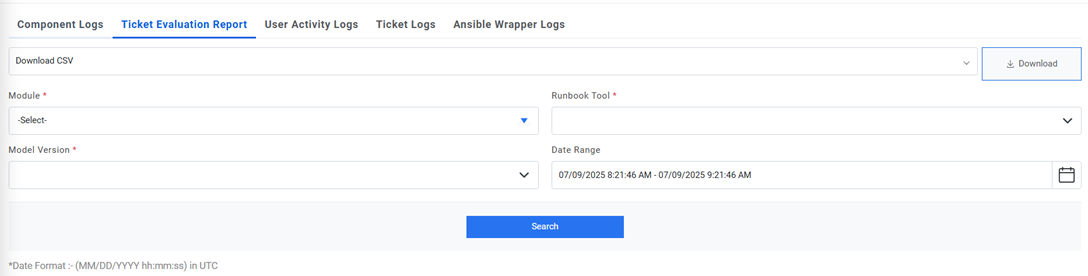
- Select Module, Runbook Tool, Model Version, and the time for which user needs to see the data.
- Then click on Search. All the ticket data that has been processed during the
selected time will be shown in the form of a graph with a Month on x-axis, Success
% on left y-axis and Successful Count and Failed Count on right y-axis.
Figure 2. Ticket Evaluation Report 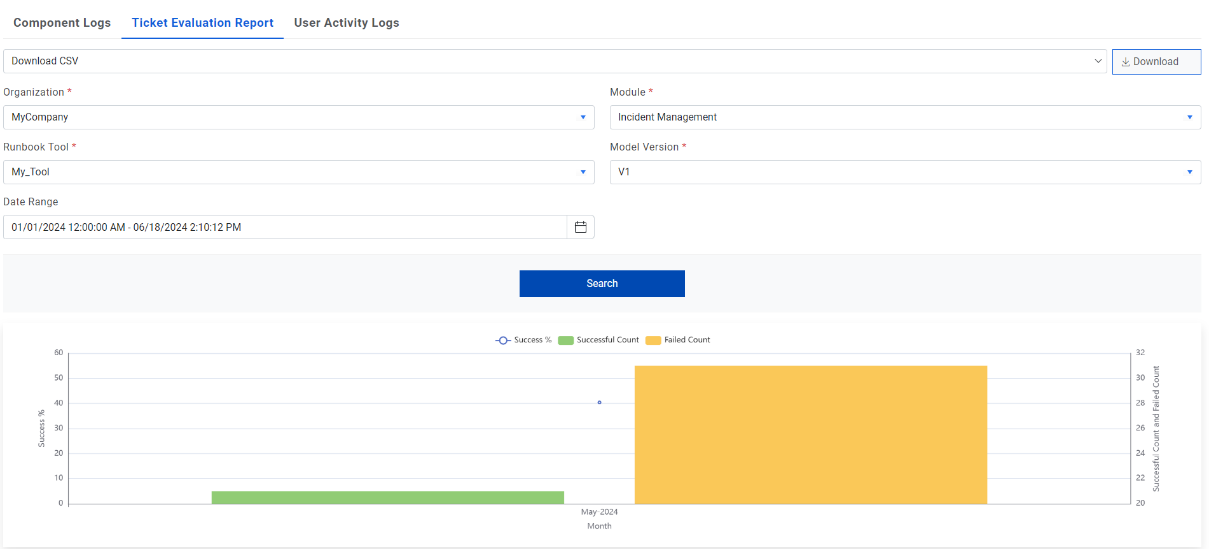
- When hovered on the Successful Count graph, it displays the no. of successful
tickets for the defined period. When hovered on Failed Count graph, it displays the
no. of failed tickets for the defined period and when hovered on the Success %, it
shows the percentage of successful tickets for the mentioned period.
Figure 3. Graphical Display of Ticket Evaluation Report 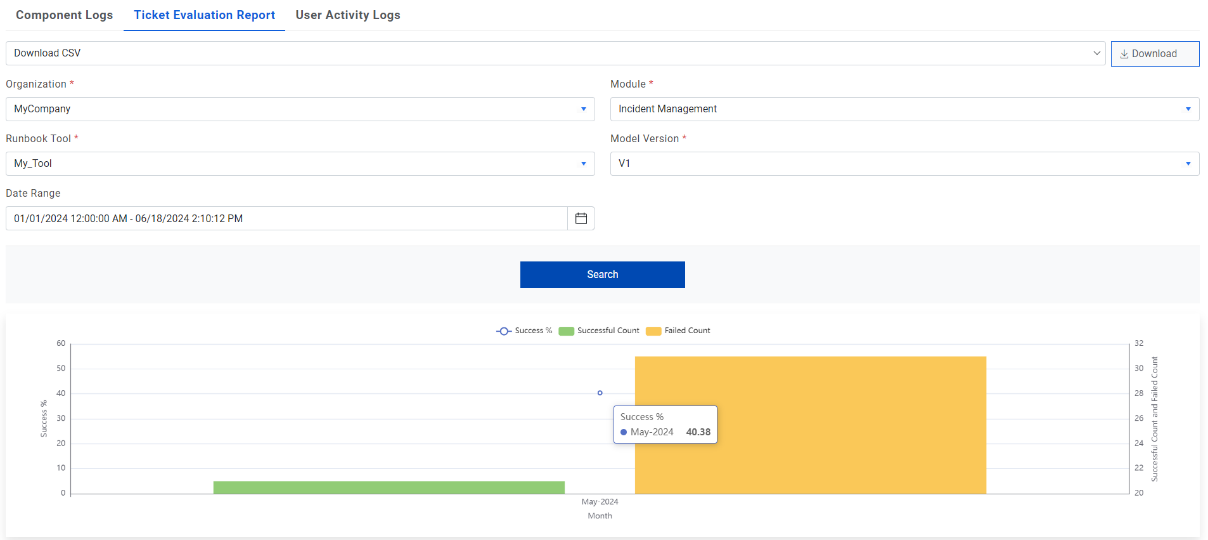
- Users can download this information in the form of CSV or PDF. For this, select either
Download CSV or Download PDF and click on button
 .
.Figure 4. Download Options 
- To get the detailed information for any block of data, click on that block. A popup will
be opened that displays the No. of tickets, Bucket Description, Bucket
Detail, Published
Duration.
Figure 5. Detailed Ticket Evaluation Report 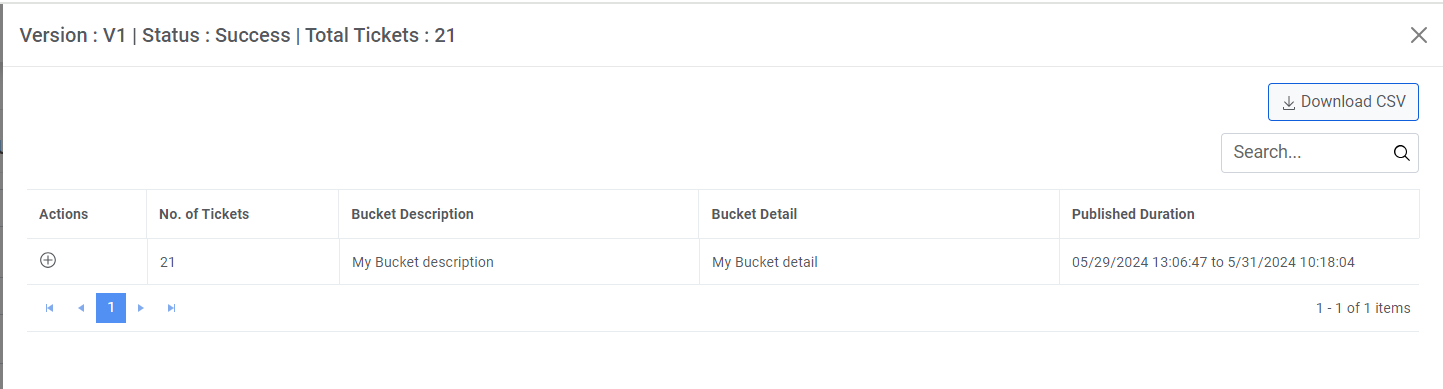
- Click on
 icon to get the ticket
details for that bucket description along with Ticket Number, its Description,
Remarks, Executed Runbook on that ticket and Recommended Runbook List
for that ticket.
icon to get the ticket
details for that bucket description along with Ticket Number, its Description,
Remarks, Executed Runbook on that ticket and Recommended Runbook List
for that ticket.Figure 6. Detailed Ticket Evaluation Report- Ticket Details 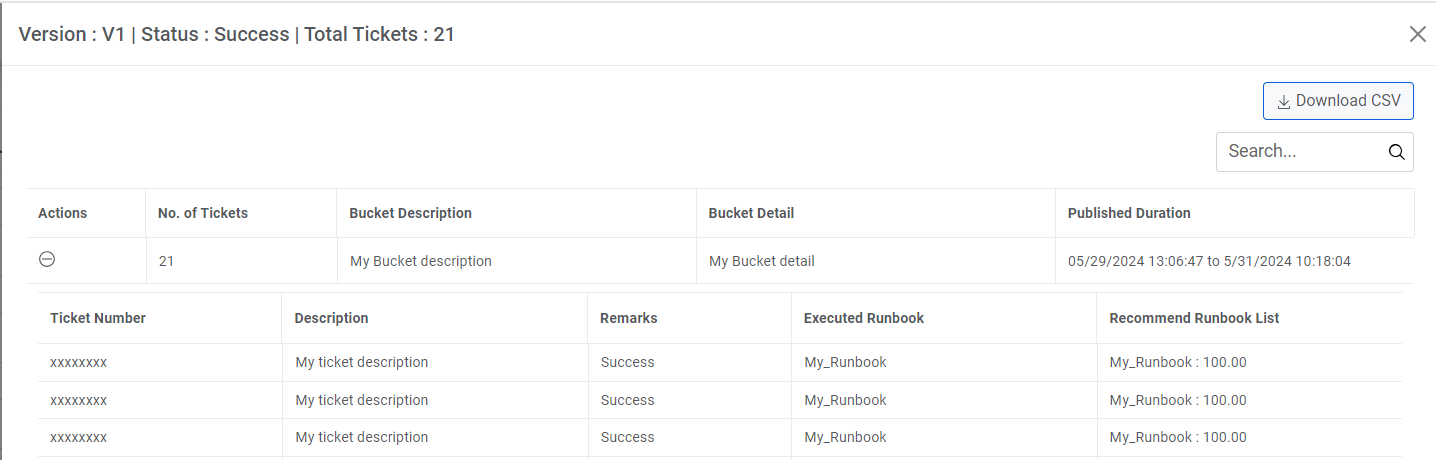
- Users can also download this ticket information in the form of CSV. For this, click on
button
 .
.