Dashboard
The dashboard provides a complete view of the system in your environment and helps visualize various operational metrics in real time. Each Dashboard User Interface (UI) element can instantly provide additional data insights. You can also create reports using the preconfigured widgets available on the dashboard.
Note:
This menu is available to Organization Admin, and Operations Users
only.
The Netbot Report tab under Dashboard is available to Netbot User, Netbot Admin, and Netbot Approver.
To manage the dashboard, perform the following steps:
- On the main menu bar, click Dashboard. The Dashboard screen
displays.
Figure 1. Dashboard 
Figure 2. Dashboard for Netbot Roles 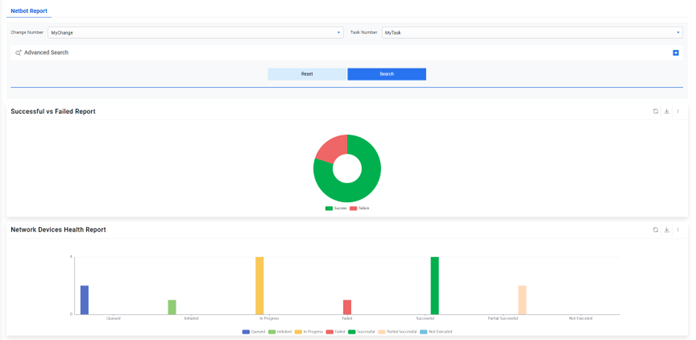
- It displays the predefined widgets in the Dashboard Filters pane. Users can add new
widgets from the predefined widgets and change or remove existing widgets from the
organization.
Figure 3. Dashboard (Cont.) 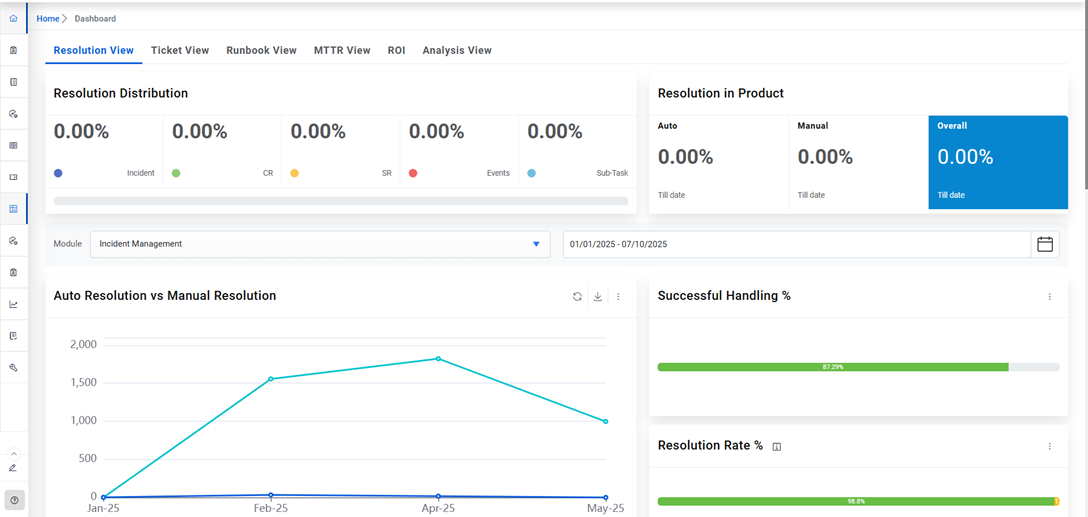
- Users can view drill-down details of certain report appearing on the widget by clicking a specific data point on the widget. This allows users to explore multi-dimensional data by navigating down one level to view more details.
- To view the drill-down report, click any visualization to view the drill-down
report appearing on a widget.
Figure 4. Dashboard (Cont.) 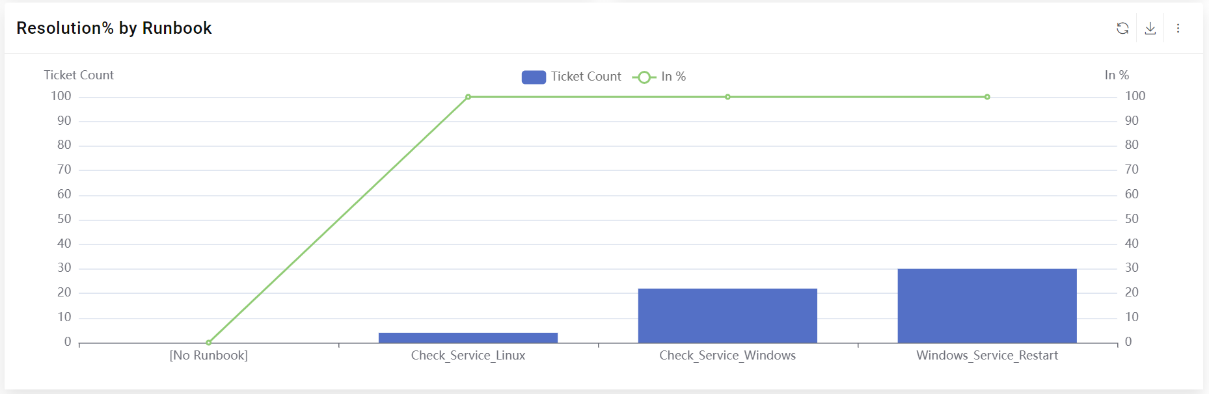
- The drill-down report is displayed on the screen.
Figure 5. Dashboard Drill down (Cont.) 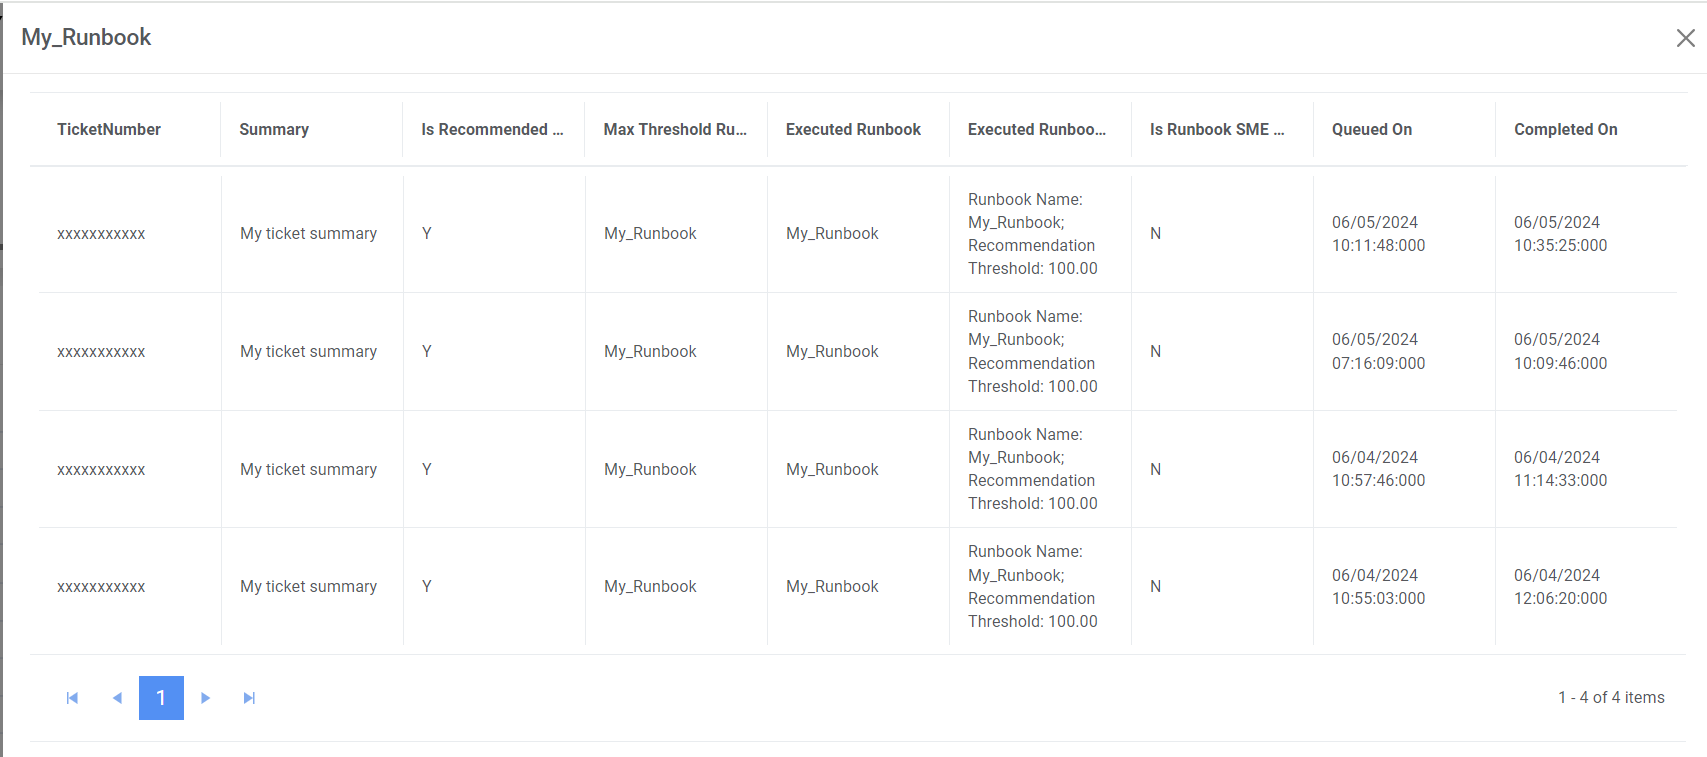
The navigation bar on each widget contains the following menus.
| Tabs | Name and Function |

|
Change the view of widget to chart view or tabular view. |

|
Refresh the data in a widget. |

|
Export the data in a widget to PDF or CSV format. |