Infographics
This section of the reporting dashboard provides a graphical representation of certain constraints that may help in determining the trends in conversation analysis, majority users, unique users coming from different regions.
Follow the steps below to navigate to the Infographics page.
- Click on the Graph Icon
 on the top right of the navigation bar on the landing page
(refer to Reporting Dashboard Landing Page) and you will be directed to the
Infographics page of Reporting Dashboard as shown in the figure below:
on the top right of the navigation bar on the landing page
(refer to Reporting Dashboard Landing Page) and you will be directed to the
Infographics page of Reporting Dashboard as shown in the figure below: Figure 1. Infographics Landing Page 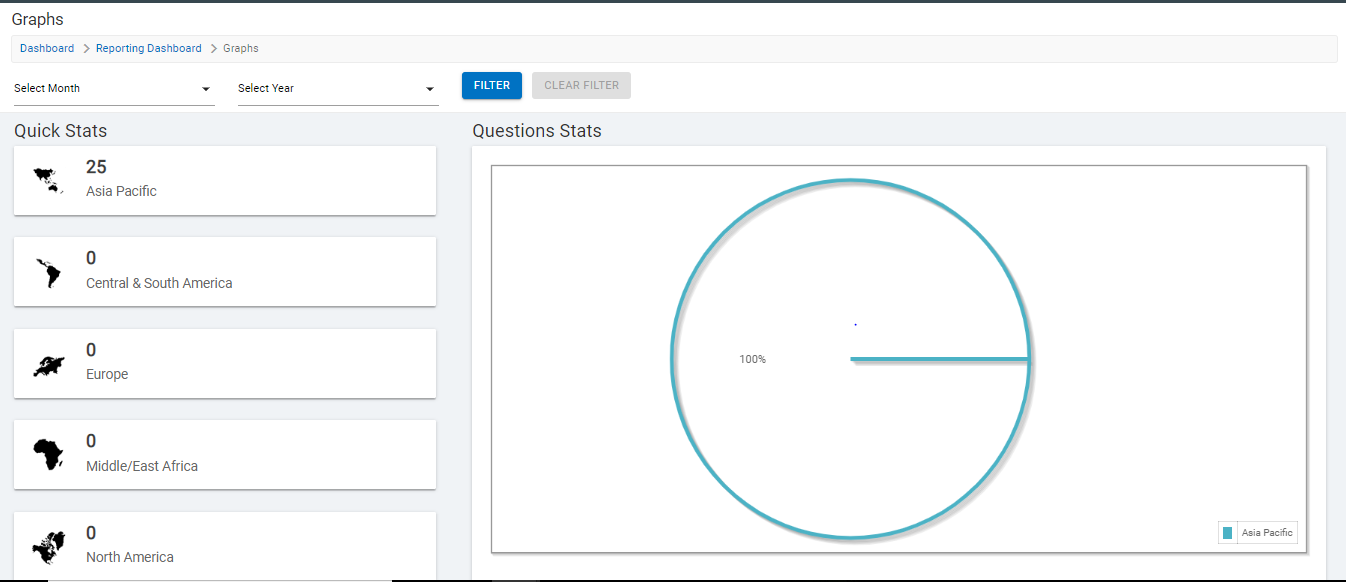
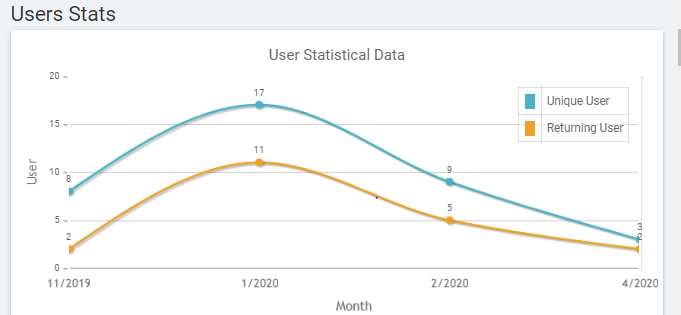
- As soon as you land up on this page, you can view the graphical representation of various constraints influencing the chatbot as shown in User Statistical Data.
- This may include unique users, returning users, conversational analysis, and resolution response per region.
This page consists of the graphical representation of the following:
- Question Stats Per Region
- User Stats
- Conversation Stats
- Regional Question Stats
- Regional Feedback Stats- Satisfied
- Regional Feedback Stats- Dissatisfied
- Unique User Per Month