Utility Tool
Users can configure utility tabs by just enabling or disabling the utility toggle from here.
- Once ‘Utility Tool’ toggle is enabled and saved, we can be able to see that page
name in route dropdown where we have list of all dashboards.
Figure 1. Utility Tool 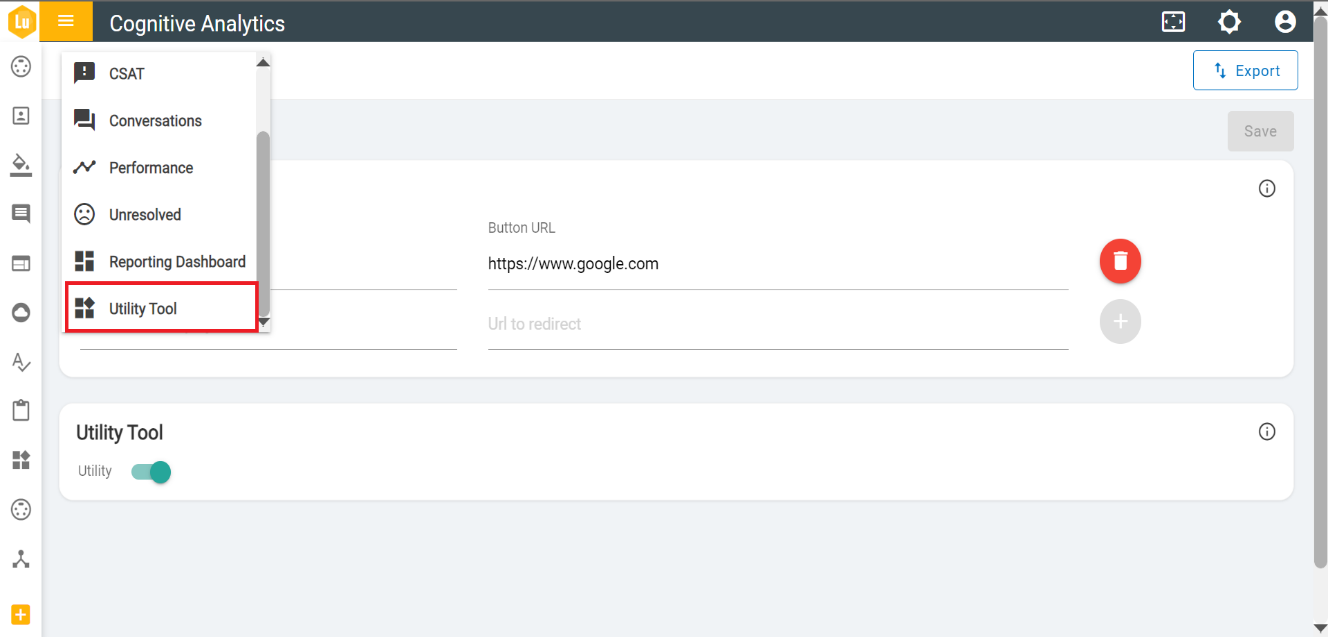
-
Dump Table View: Table represents the data dump of the selected option for the
selected period.
Figure 2. Dump Table View 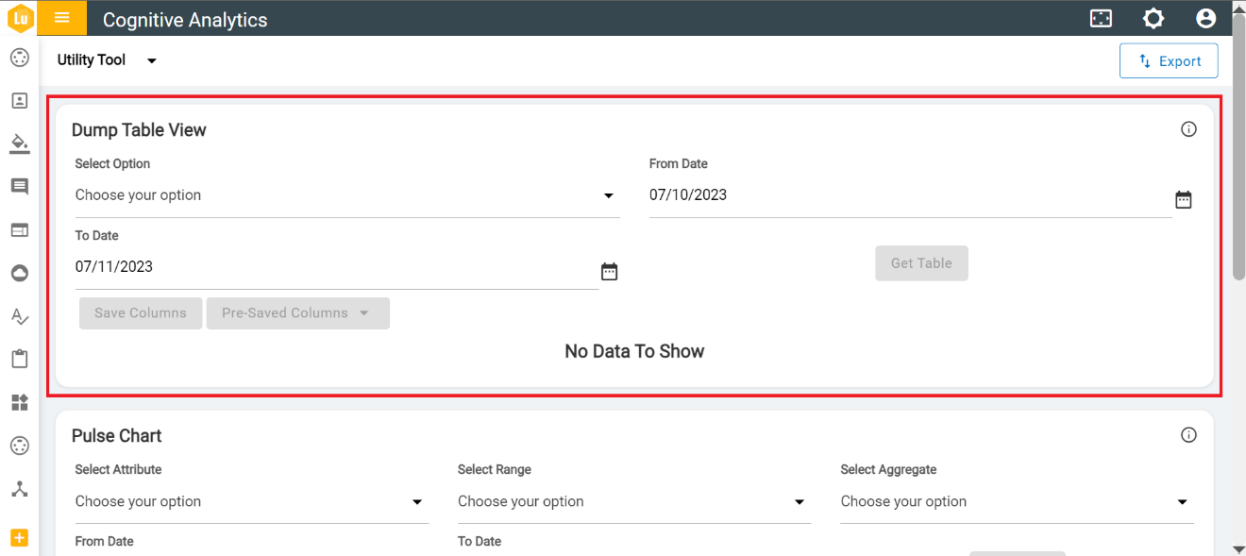
Figure 3. Dump table view details 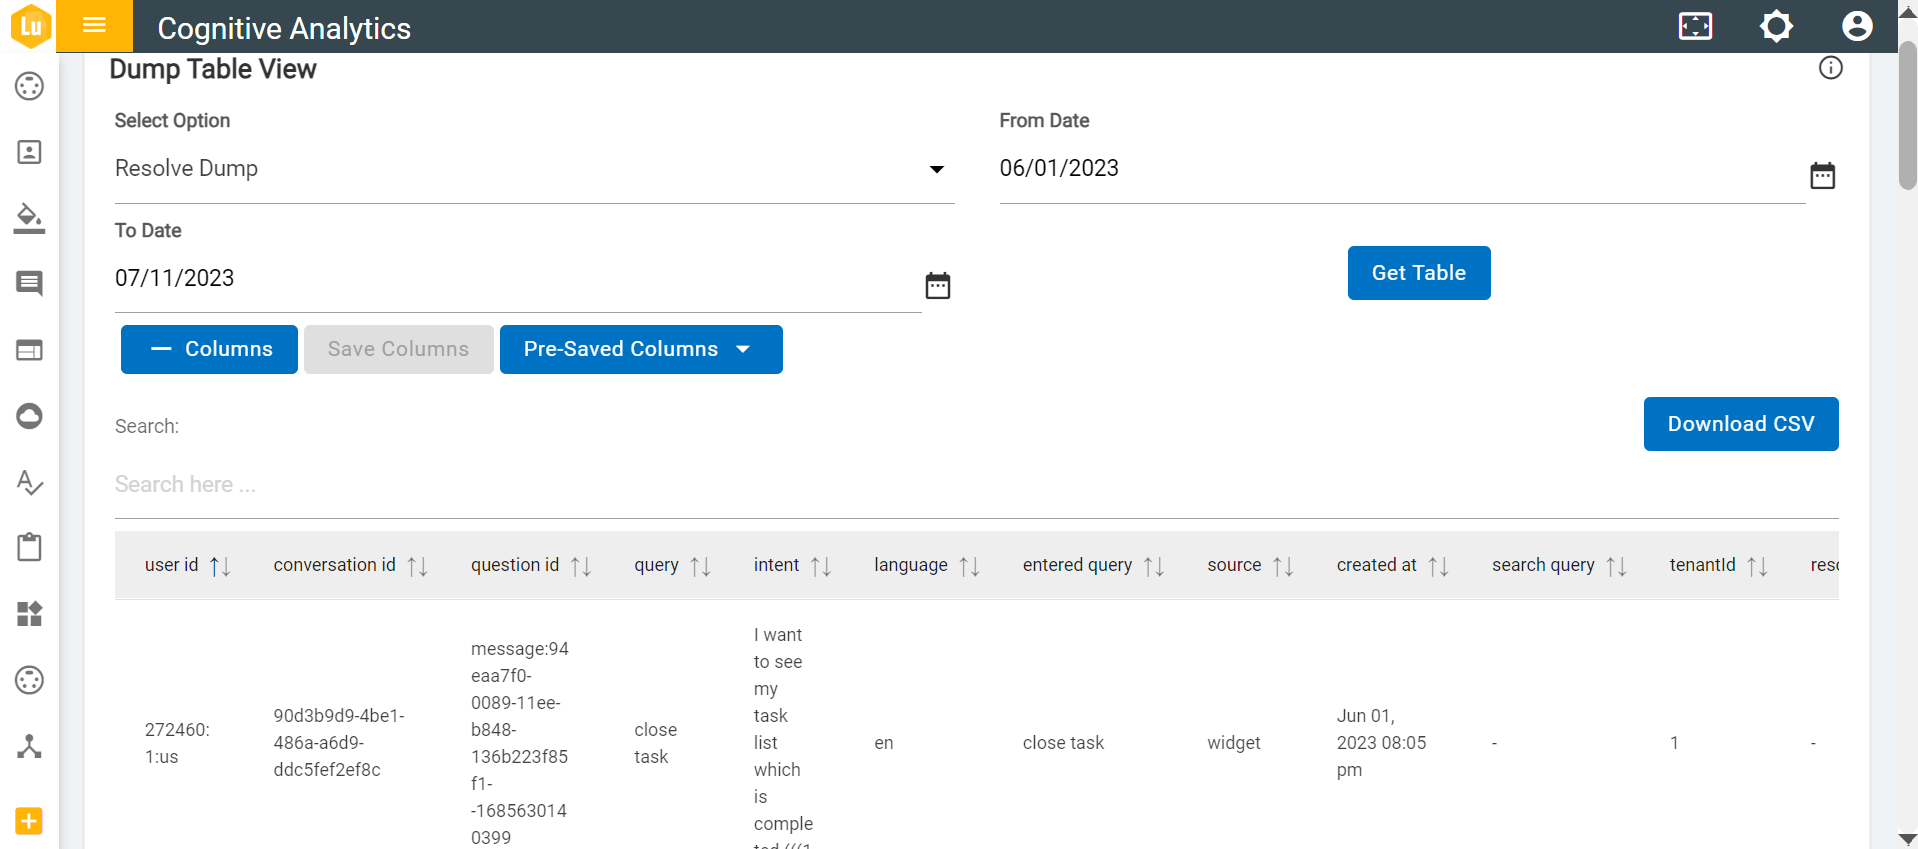
-
Pulse Chart: This graph represents the range of data for the specified period.
- Two graphs can be added for quick comparison.
- One graph can be saved at once a and maximum of two graphs can be saved under one graph name as a category.
-
- Click on
 near graph to
swap graphs.
near graph to
swap graphs.Figure 4. Pulse Chart 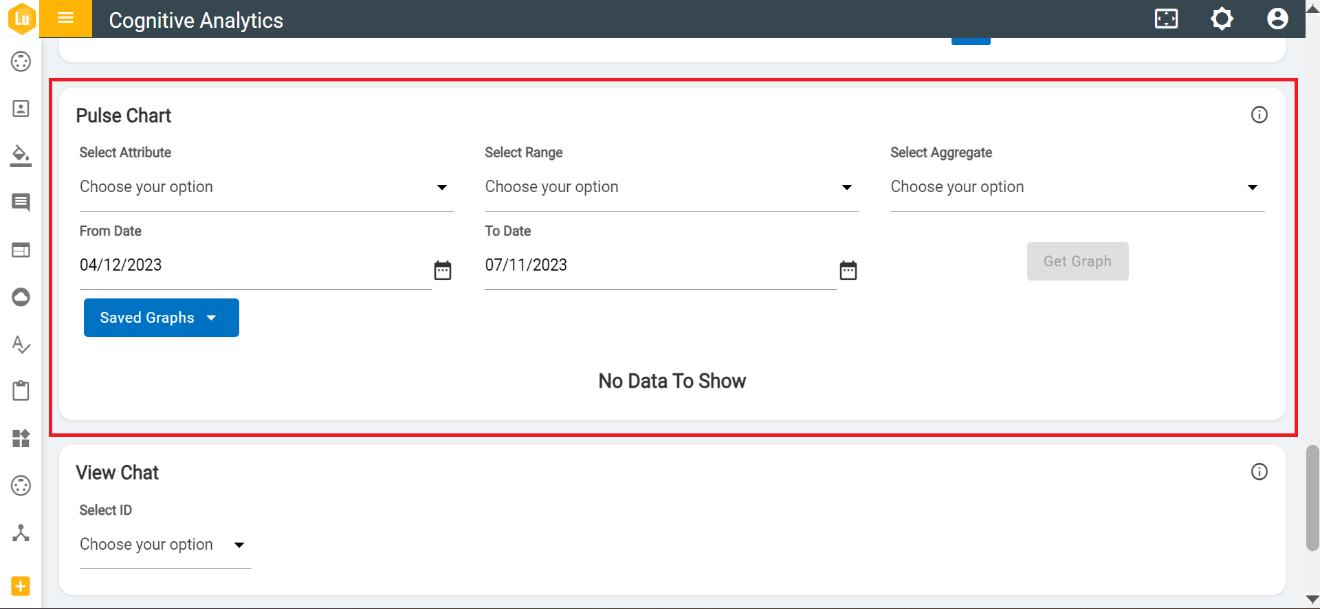
Figure 5. Swap graphs icon 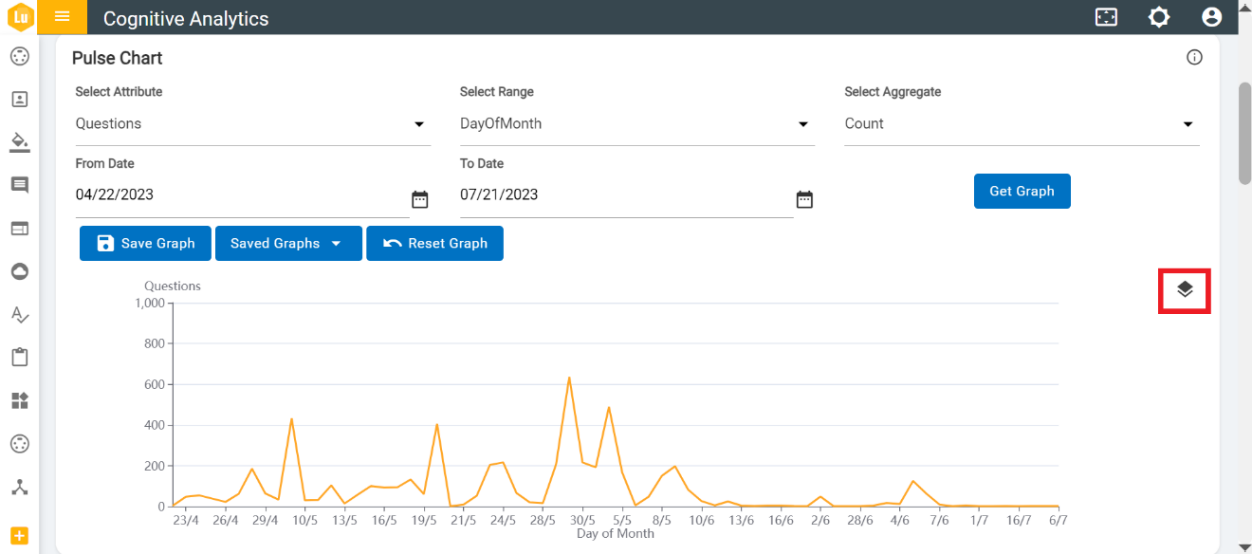
- Click on
-
View Chat: Utility to fetch the Chat and Conversation as per the ID provided by
user.
Figure 6. View Chat 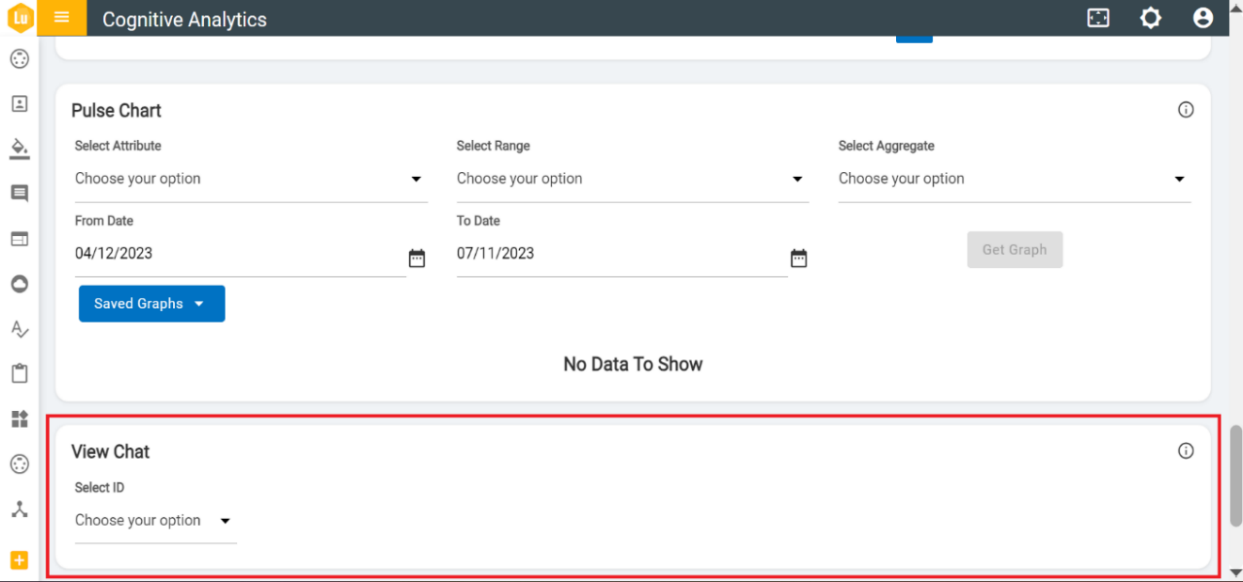
-
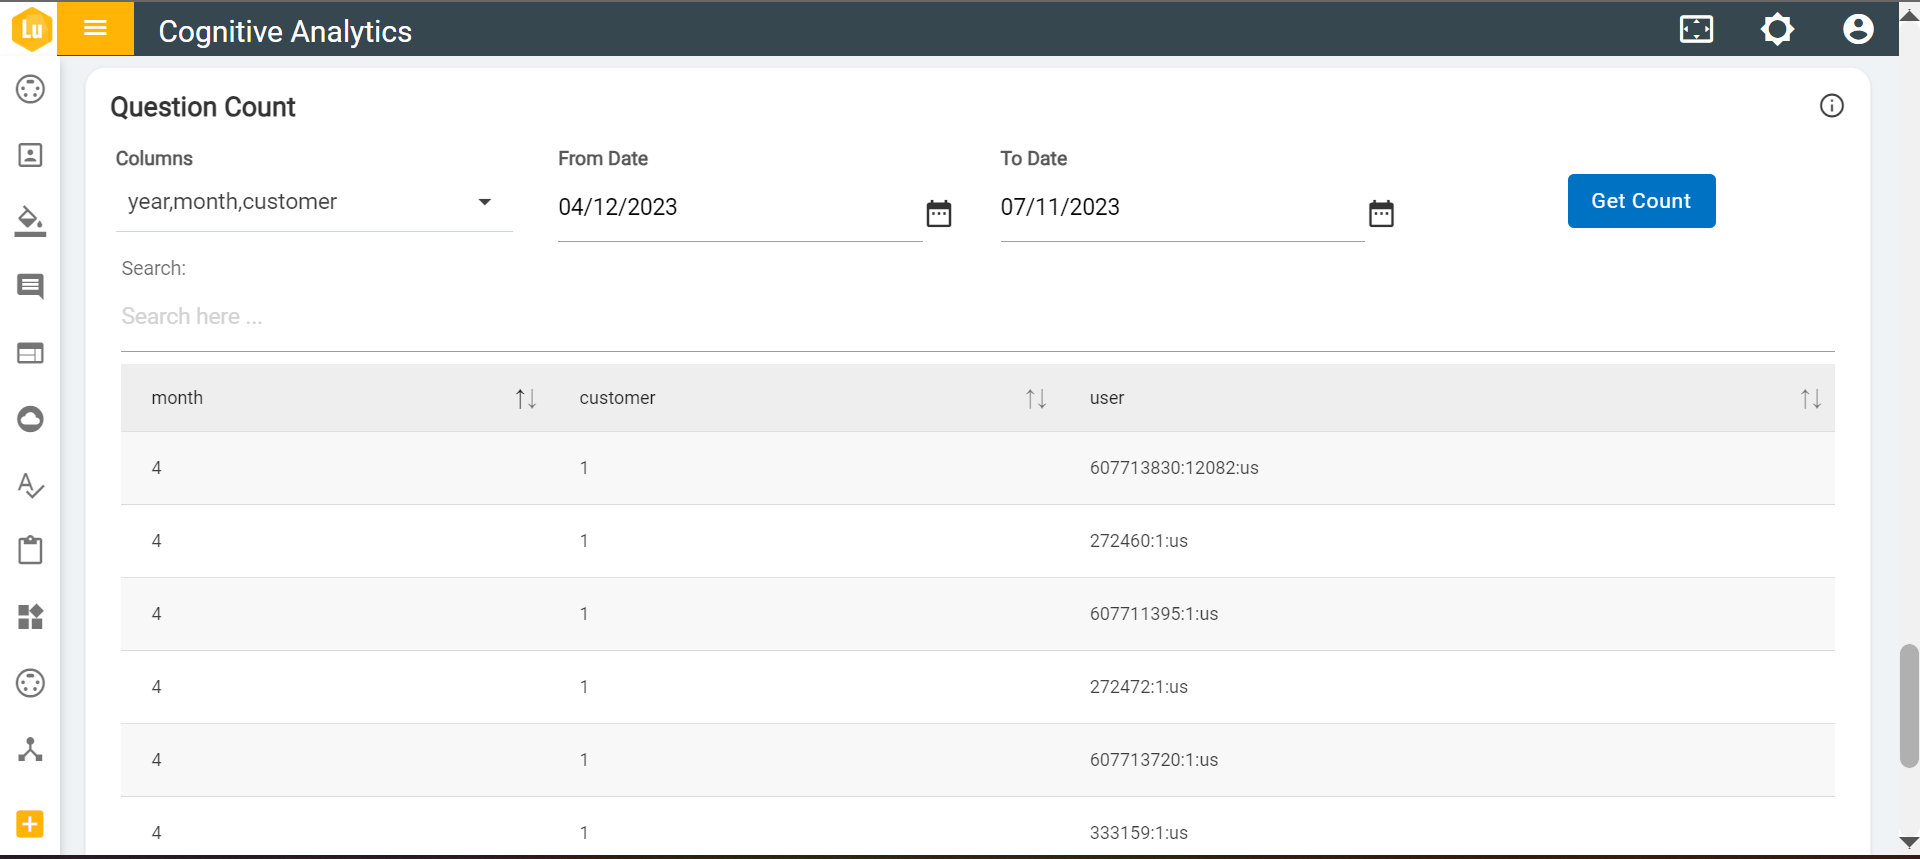
Question Count: Table shows the count of question based on selected columns and date.
Figure 7. Question Count 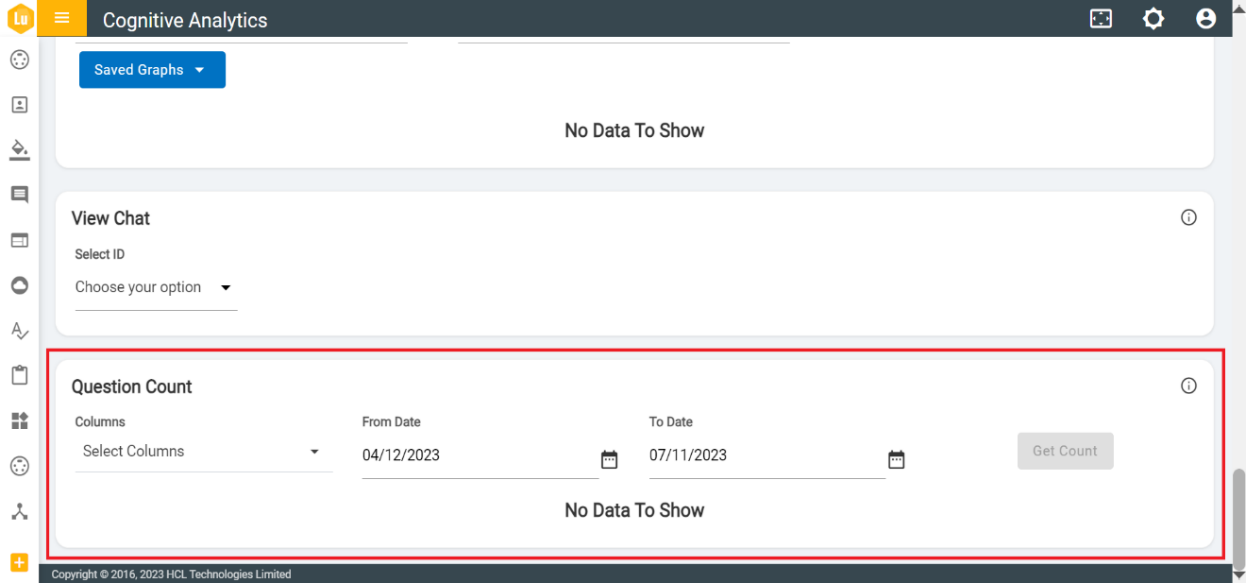
Figure 8. Question Count (Cont.)