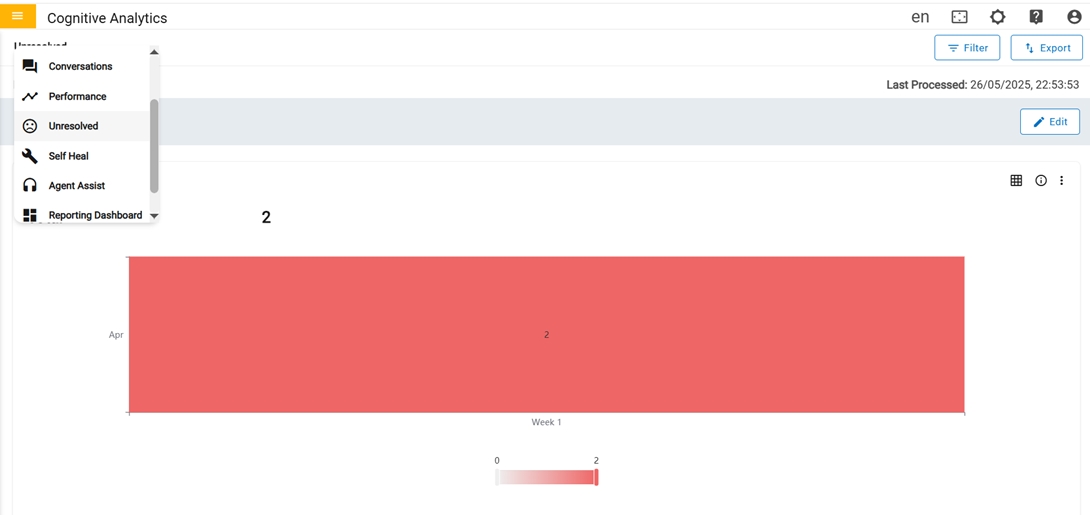
The Unresolved page includes information about questions or queries that have not been
resolved to a usecase or were not responded to a solution. This page contains the graphical
view of metrics along with a table that provides much more detailed information about each
query.
Figure 1. Unresolved
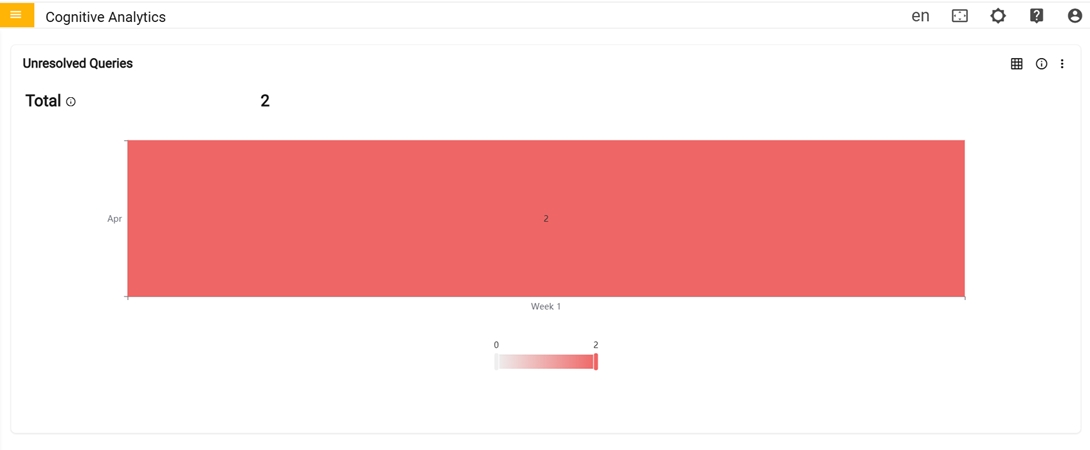
In the first row there are four cards in the Unresolved Dashboard:Figure 2. Unresolved Dashboard (Cont.)
Unresolved Queries: Metrics related to Unresolved queries and graph represents the
total count of unresolved queries in each week of a particular month.
Total: Count of queries that are not resolved to a use case or were not responded
with a solution. This can happen with unclear user input, grammatical errors or if the
issue is not in scope of the implementation or configuration.
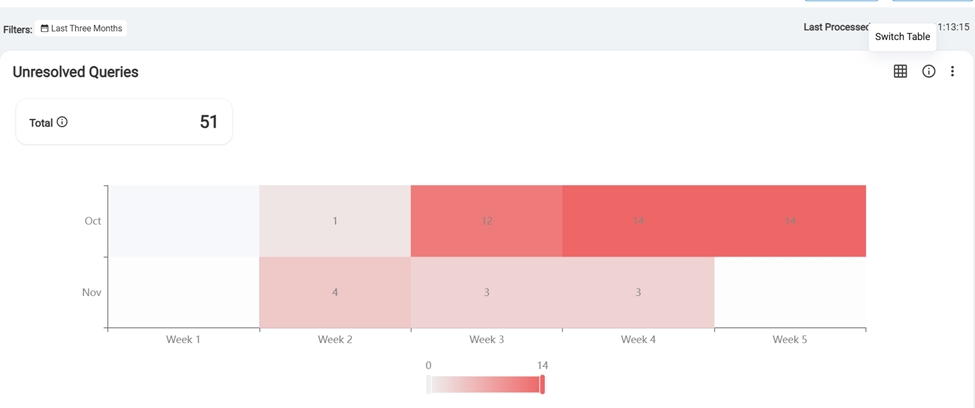
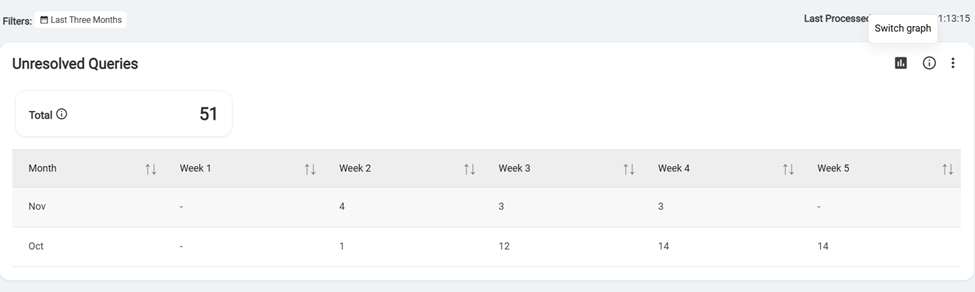
The user can toggle between a graph and a table view. Clicking the "Switch to Table"
button transforms the graph into a table format, and clicking again switches it back to
the original graph display.Figure 3. Switch GraphFigure 4. Switch Table
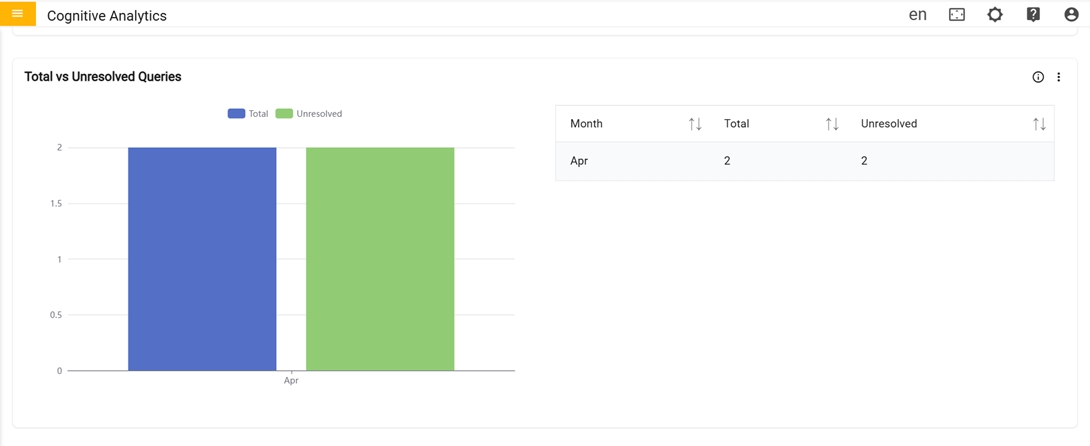
In the second row there is one card Total vs Unresolved query.
Total vs Unresolved Queries: Graph represents
the monthly breakdown of total vs unresolved queries for specified
period.
Figure 5. Total vs Unresolved Queries (Cont.)
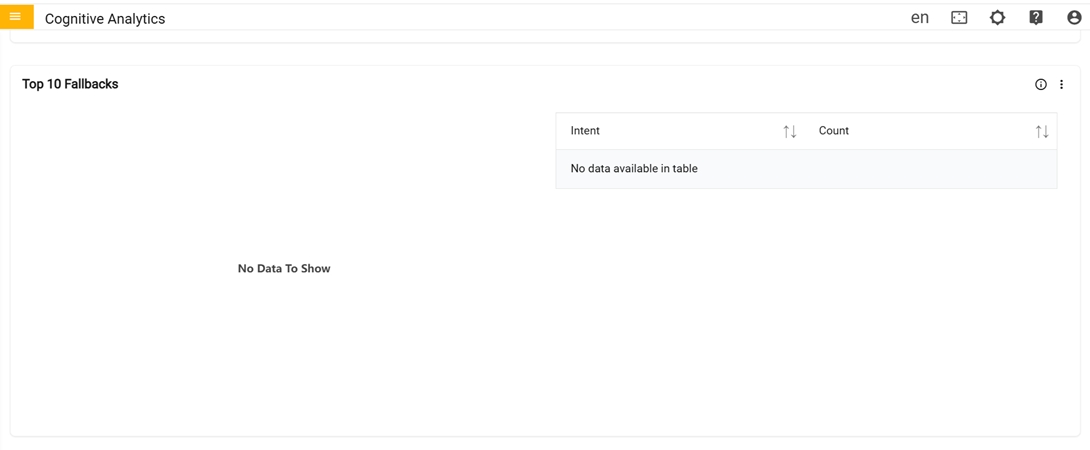
In the third row there are the Top 10 Fallbacks:
Top 10 Fallbacks: Graph represents detailed information for each fallback such as
count of that fallback for specified period.
Figure 6. Top 10 Fallbacks (3rd Row)
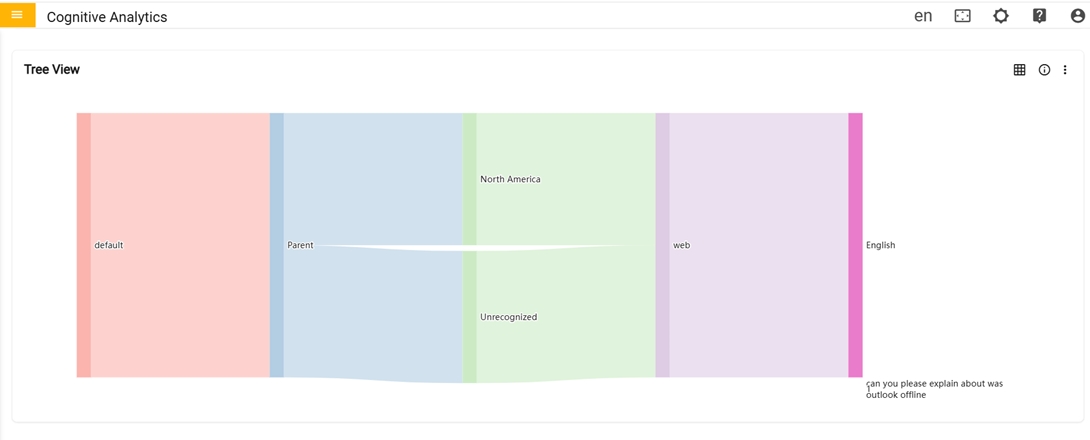
In the fourth row there is Tree View
Tree View: Graph provides a visual representation of the unresolved queries from the
origin. The related unresolved queries grouped together and displayed in a way that allows
for easy navigation by Language, Channel, Region, and Customer.Figure 7. Unresolved Dashboard (Cont.)
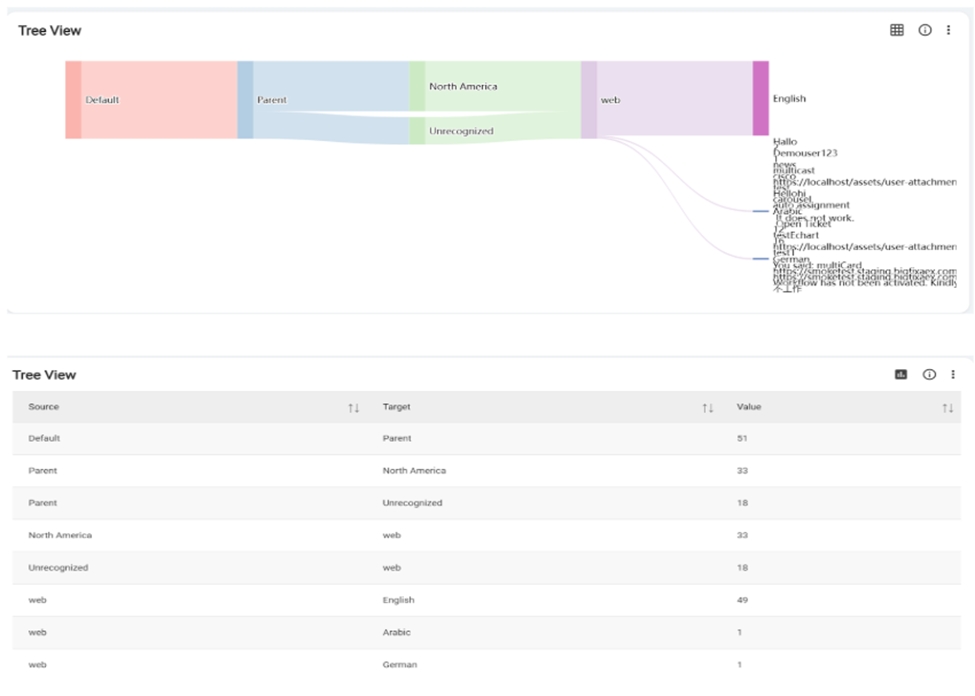
The user can toggle between a graph and a table view. Clicking the "Switch to Table"
button transforms the graph into a table format, and clicking again switches it back to the
original graph display.Figure 8. Switch Table or Switch Graph
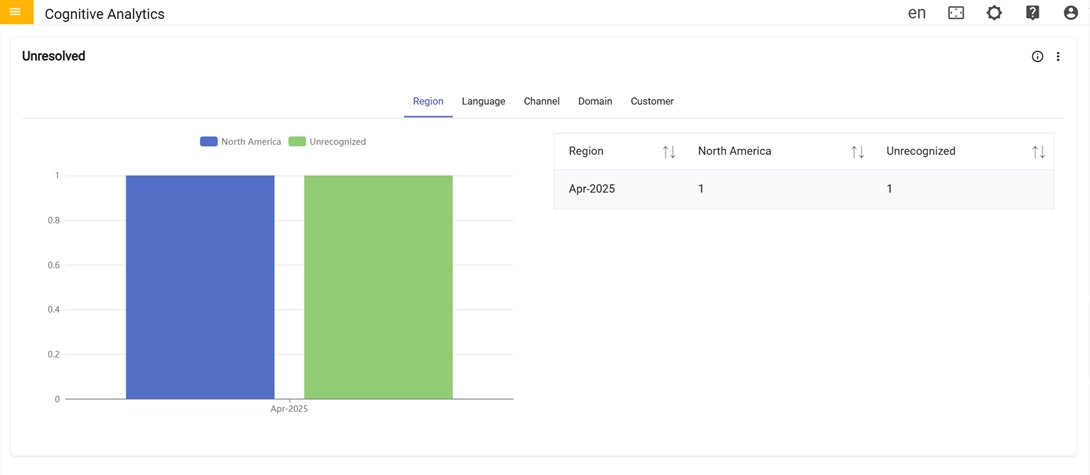
In fifth there is Unresolved card:
Unresolved: Graph represents the total count
of unresolved queries in a particular Region, Language, Channel,
Customer and Domain for specified period.
Figure 9. Unresolved Dashboard (Cont.)
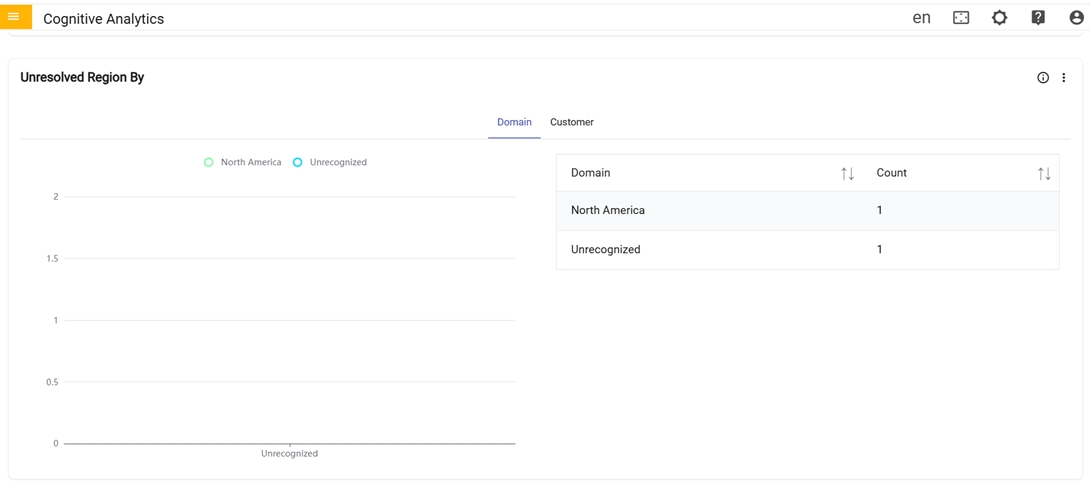
In the sixth row there is Unresolved Region By
card
Unresolved Region By: 2D Graph represents the total count of unresolved queries from
various region that belong to specific customer and the total count of unresolved queries
from various region that belong to specific domain.Figure 10. Unresolved Dashboard (Cont.)
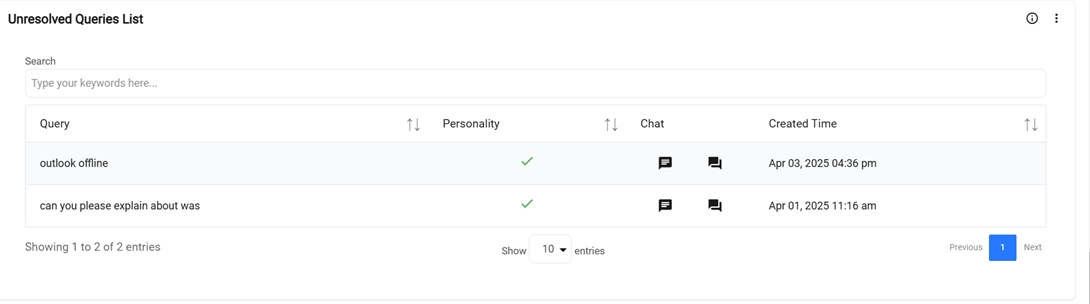
In the seventh row there is an Unresolved Queries List:Figure 11. Unresolved Dashboard (7th Row)
Unresolved Queries List: Table provides a
detailed information for each query such as personality, solution
used, chat, conversation details & the created time of each
query.