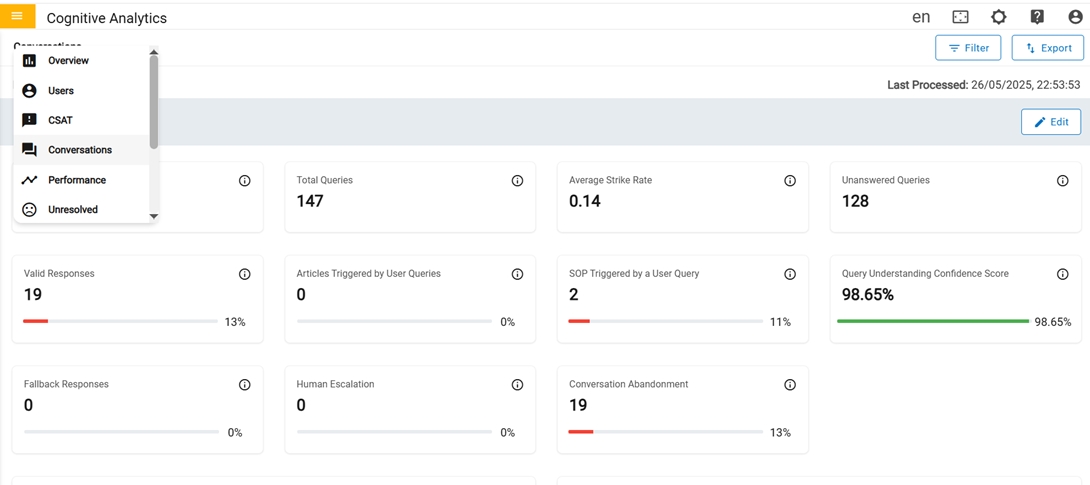
The conversation page provides information on use-cases and intents. This page typically
includes the use-case and intent metrics with reference to language, customer, region,
channels and domain.Figure 1. Conversation
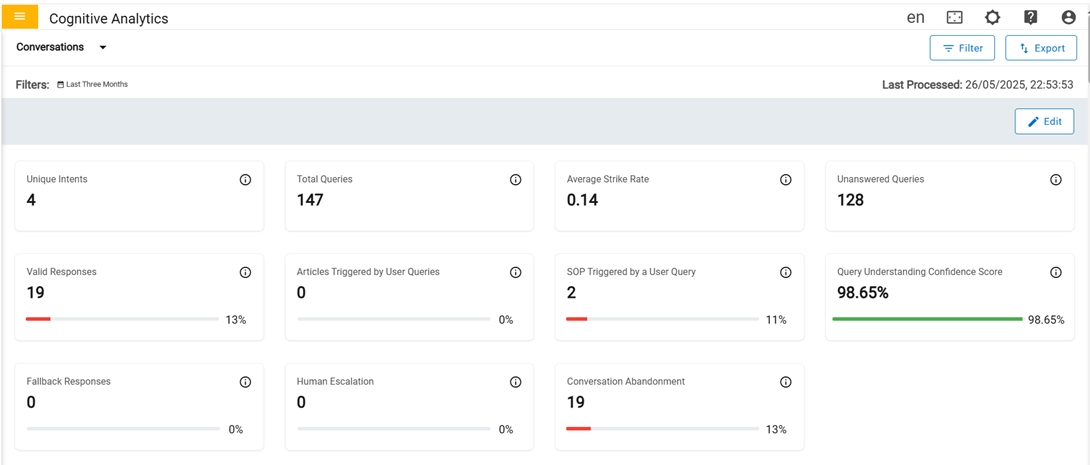
In the first row there are four cards in Conversations Dashboard:Figure 2. Conversations Dashboard (1st Row)
Unique Intents
Count of unique intents asked by users.
A distinct request or question that user makes while having a conversation.
Total Queries
Count of queries raised by users.
Average Strike Rate
Average count of user queries that is identified as a valid question that can be
answered by one of the use cases configured or trained and provide a satisfactory
response or resolution.
(Valid Questions/Total Queries) %.
Unanswered Queries
The number of queries that are not resolved to a use case or were not responded with a
solution. This can happen with unclear user input, grammatical errors or if the issue is
not in scope of the implementation or configuration.
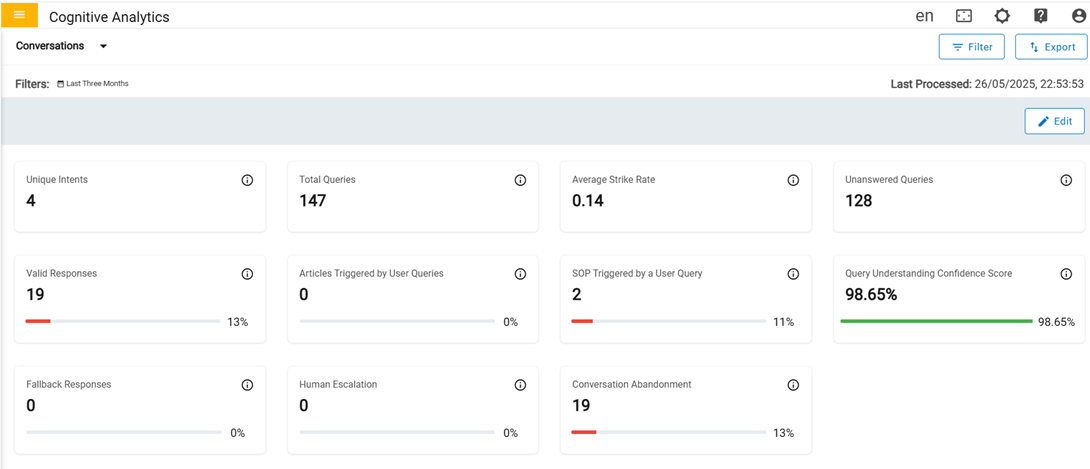
In the second row there are four cards in Conversations Dashboard:Figure 3. Conversations Dashboard (2nd Row)
Valid Responses
Count of user queries for which a valid response or a solution is provided to the
user.
Progress bar indicates the percentage of valid response with respect to total
queries.
Article Triggered by User Queries
Number of times when an article is triggered in response to users for a specific
query. This refers to an informative or educational article that is suggested based on a
user's query or request for more information.
Progress bar indicates the percentage of article triggered with respect to
usecase.
SOP Triggered by User Queries
Number of times when an SOP (Standard Operating Procedure) is triggered in response to
users for a specific query.
Progress bar indicates the percentage of SOP's triggered with respect to usecase.
Query Understanding Confidence Score
The confidence with which the user query is understood and mapped to an intent.
Confidence score is in percentage and represents the level at which the user query is
attempted to be resolved based on the training of the use cases.
Progress bar indicates the percentage of average confidence score with respect to
usecases
In the third row there are four cards in Conversations Dashboard:Figure 4. Conversations Dashboard (3rd Row)
Fallback Ressponses
The number of fallbacks provided as a backup response. Based on the
implementation/configuration a list of top 5 intents/use cases based on their confidence
score which is related to the query is provided that closely matches the query raised by
the user. It can also be prompt questions with options to further narrow down the use
cases that might solve the user's query.
Progress bar indicates the percentage of fallbacks triggered with respect to total
queries.
Human Escalation
The number of Human takeover that happened in a conversation for personalized
assistance when the user's issue or needs is not fully addressed with satisfactory
response.
Progress bar indicates the percentage of human takeover with respect to usecase.
Conversation Abandonment
Number of times when a user exits the conversation without or before providing any
feedback.
Progress bar indicates the percentage of no feedback given with respect to
usecase.
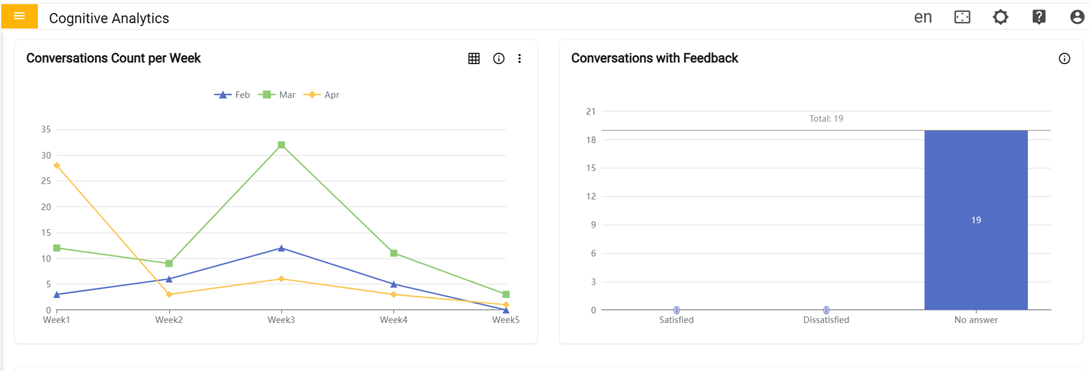
In the fourth row there are two cards,Figure 5. Conversations Dashboard (4th Row)
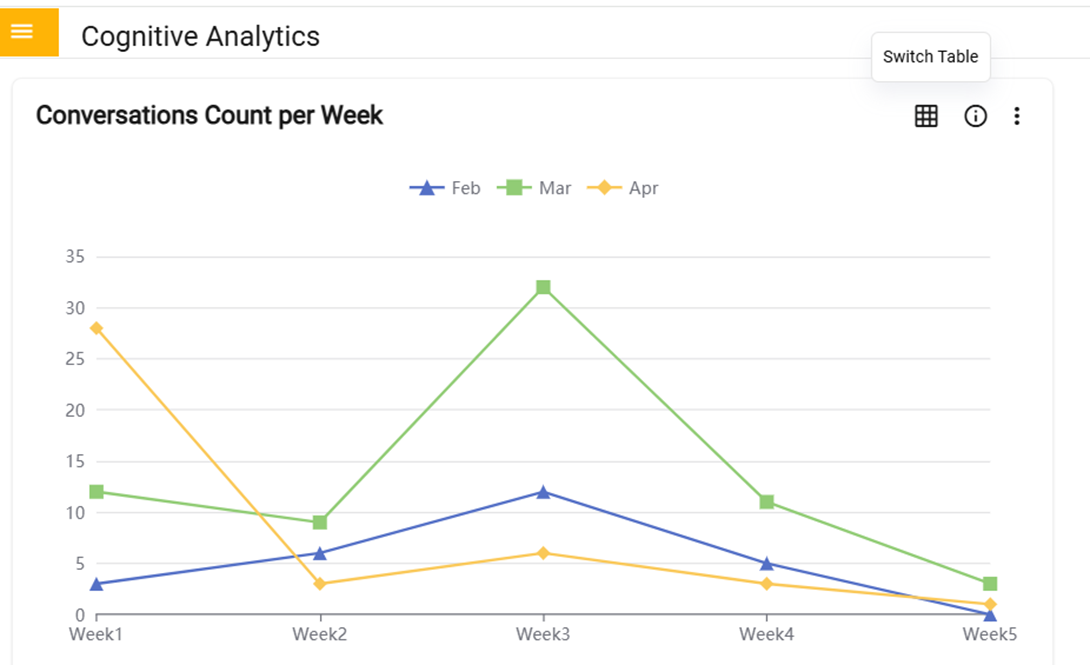
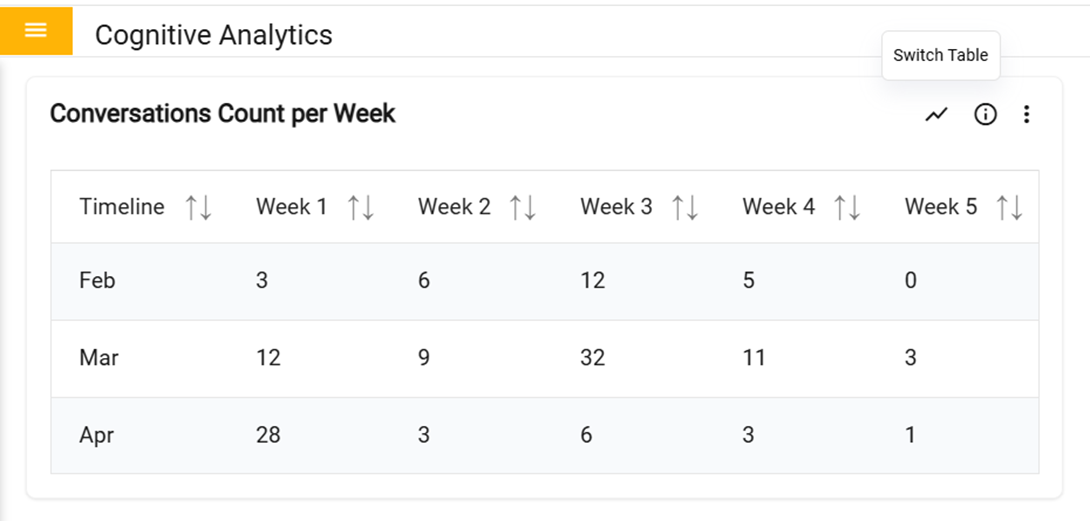
Conversations Count per week:
Graph represents the total number of conversations that happened in each week of a
month.
Conversations with Feedbacks:
Graph represents the total count of conversations that received feedback as Satisfied
or Dissatisfied and if the users have not provided any feedback.
The user can toggle between a graph and a table view. Clicking the "Switch to Table"
button transforms the graph into a table format, and clicking again switches it back to
the original graph display.
Figure 6. Switch Graph Figure 7. Switch Table
In the fifth row there is Conversation By cards:
Figure 8. Conversations Dashboard (5th Row)
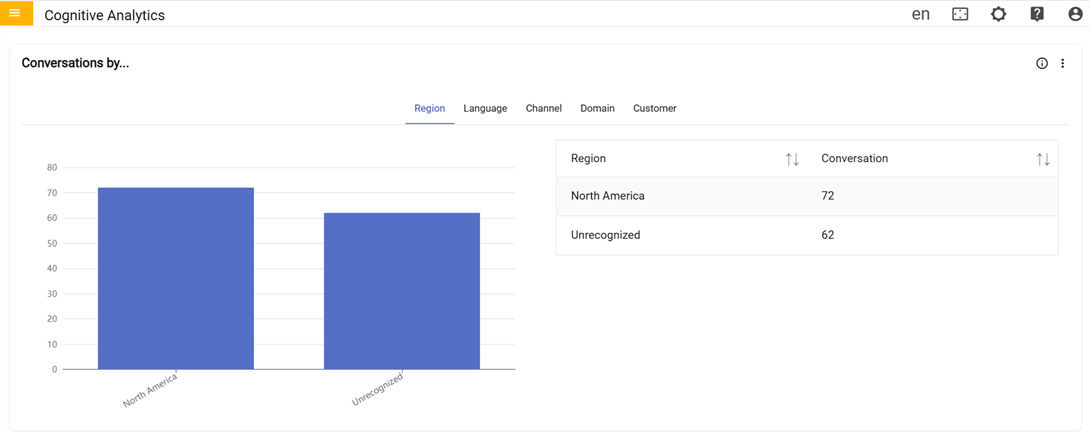
Conversation By:
Graph represents the total count of conversations for the combination of mentioned
parameters for a specified period.
In the sixth row there is Conversational Monthly
By card:
Figure 9. Conversation Monthly By(6th row)
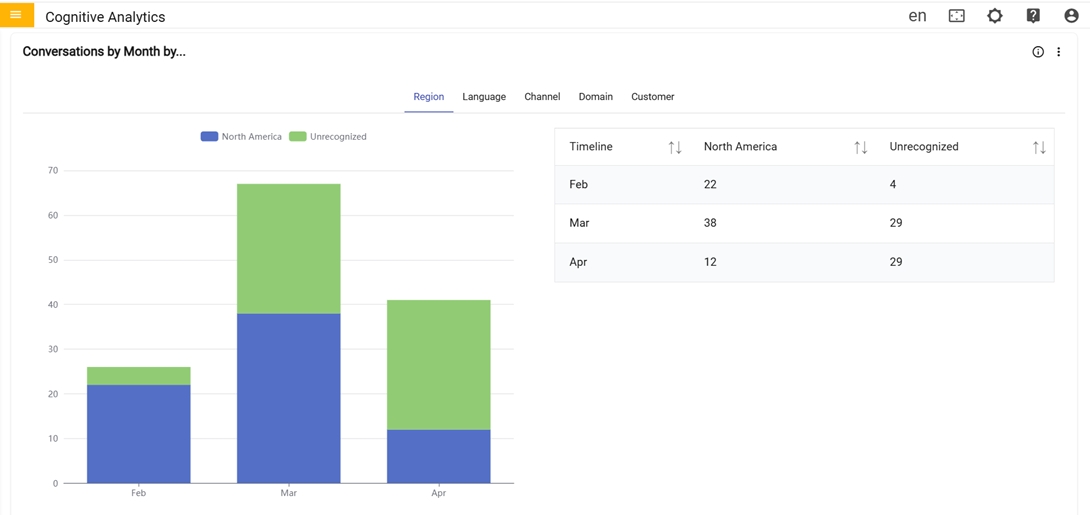
Conversational Monthly By: Graph represents
monthly breakdown of conversation happened across the combination
of mentioned parameters for a specified period.
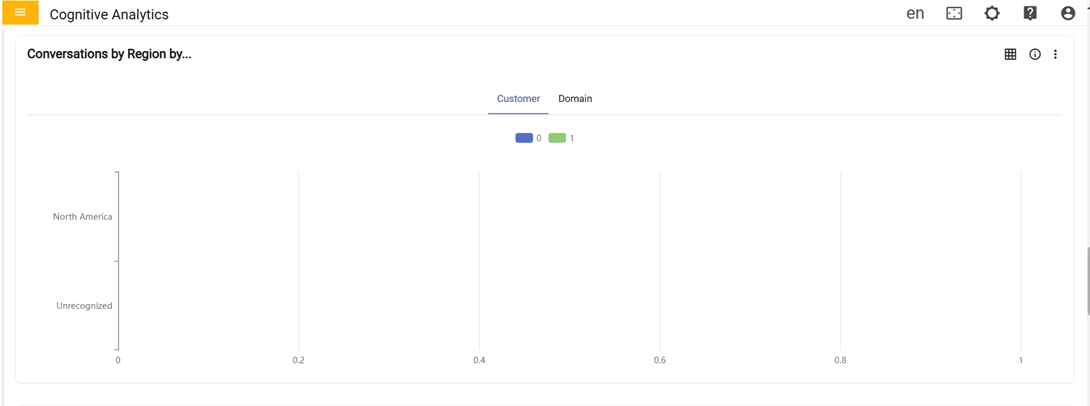
In the seventh row there is Conversation Region
By:
Figure 10. Conversation Region By(7th Row)
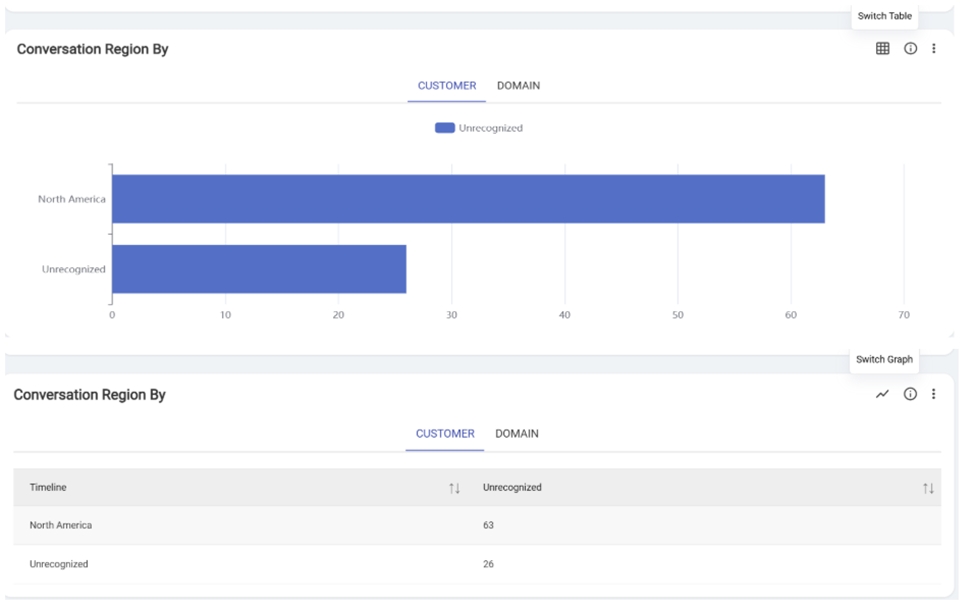
Conversation Region By: Graph represents the
total conversation happened for the combination of mentioned
parameters from the different regions for specified period.
The user can toggle between a graph and a table view. Clicking the "Switch to Table"
button transforms the graph into a table format, and clicking again switches it back to the
original graph display.Figure 11. Switch Table or Graph
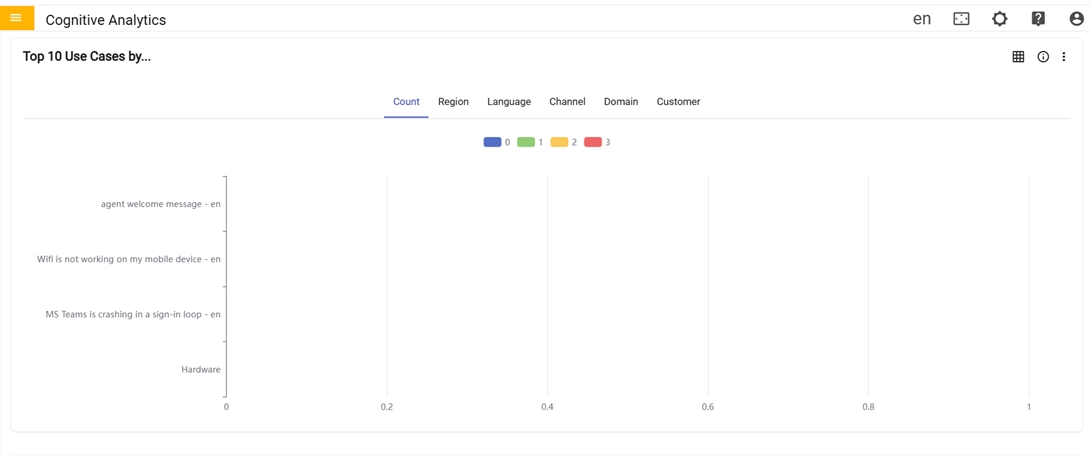
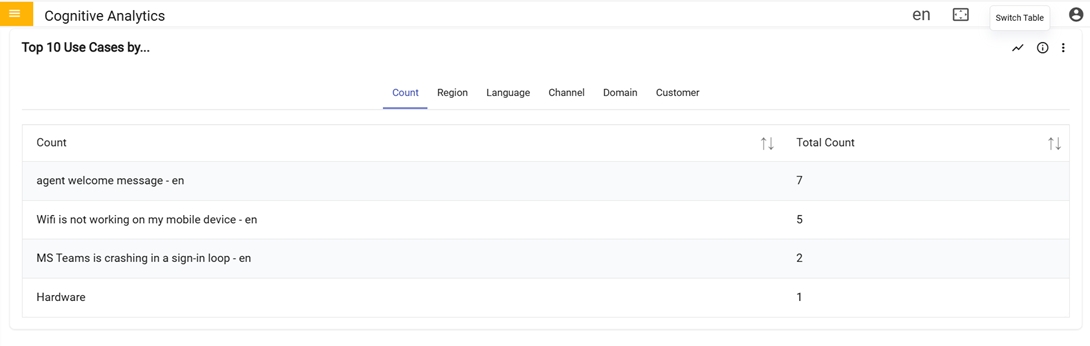
In the eighth row there is Usecase By:
Figure 12. Usecase By (8th row)
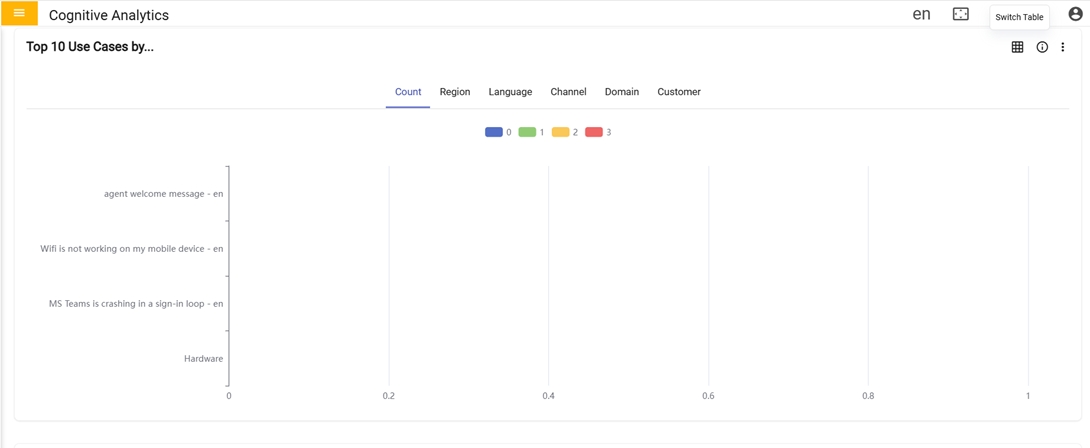
Usecase By: Graph represents the top 10
usecases based on the count it got triggered in conversation that
happened for the mentioned combination of parameters.
The user can toggle between a graph and a table view. Clicking the "Switch to Table"
button transforms the graph into a table format, and clicking again switches it back to the
original graph display.Figure 13. Switch GraphFigure 14. Switch Table
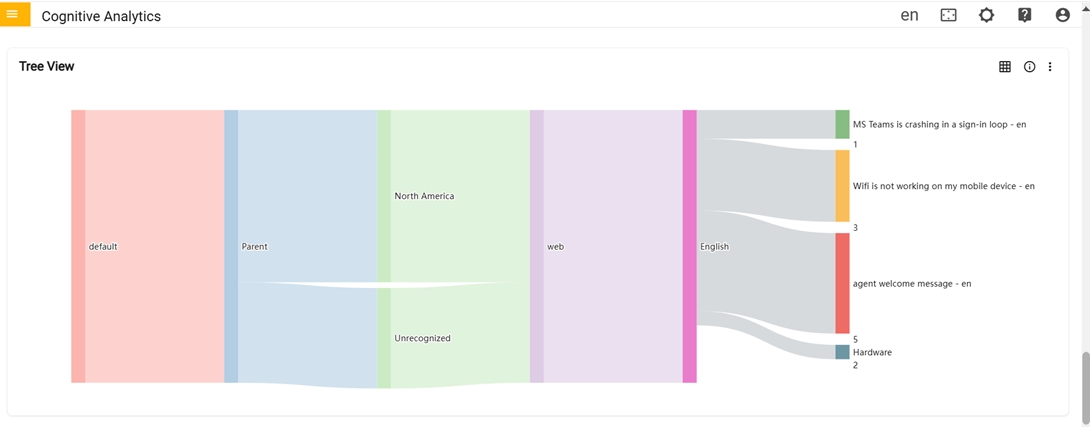
In the ninth row there is Tree View:
Figure 15. Conversations Dashboard (9th Row)
Tree View: Graph provides a visual
representation of the intents from the origin. This displayed in a
way that allows for easy navigation by Language, Channel, Region
and Customer.
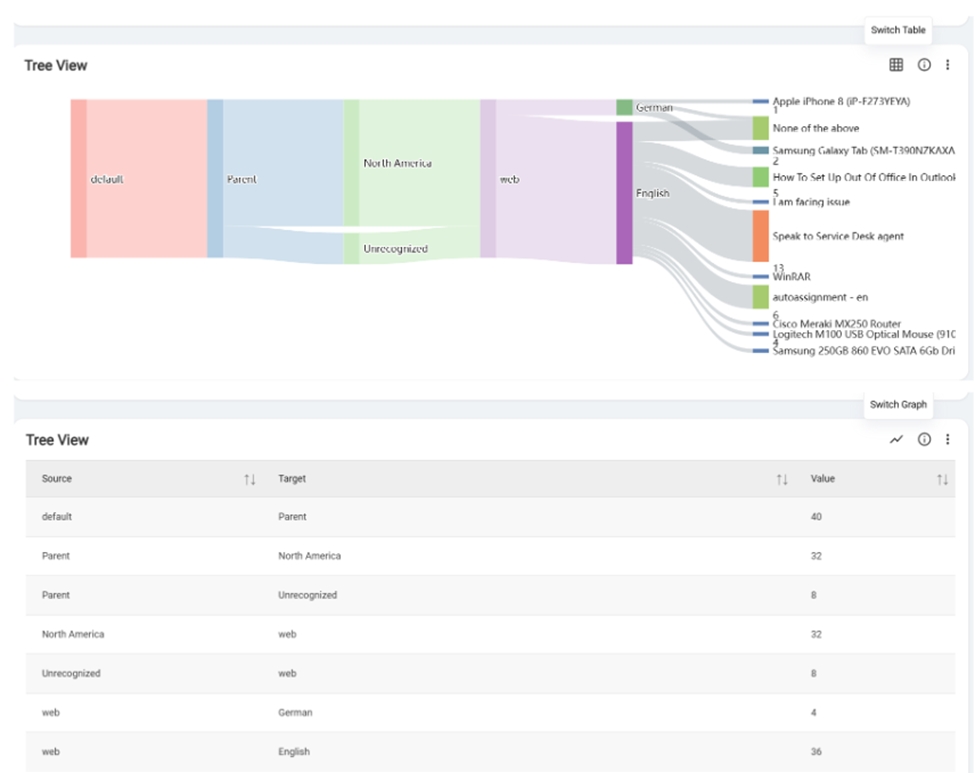
The user can toggle between a graph and a table view. Clicking the "Switch to Table"
button transforms the graph into a table format, and clicking again switches it back to the
original graph display.Figure 16. Switch Table or Switch Graph
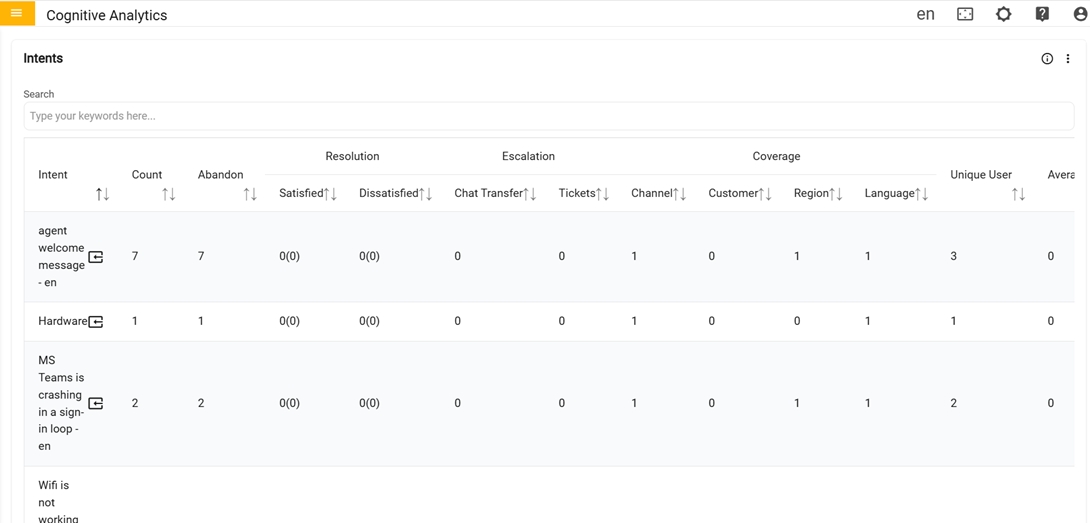
In the Tenth row there is Intents
Intents: Table provides the detailed
information for each intent such as the count of that intent, Users
left without feedback rate, Users who provide feedback as Satisfied
or Dissatisfied, total count of Chat Transferred and Ticket
generated, total count on channel, region, customer and language,
total count of unique user and average feedback
for that intent. 'Click' the details icon to view
additional information about each individual intent.