Common Functionalities
-
Filter
The Filter button allows users to narrow down the data that they are viewing based on specific criteria. Typically, the filter option provides a set of fields or values, such as a limitation of any 90 days, etc., that the user can select from, to filter the data. This option also allows for more advanced filtering, such as the ability to combine multiple criteria or to create more complex filters by combination.
Figure 1. Filter 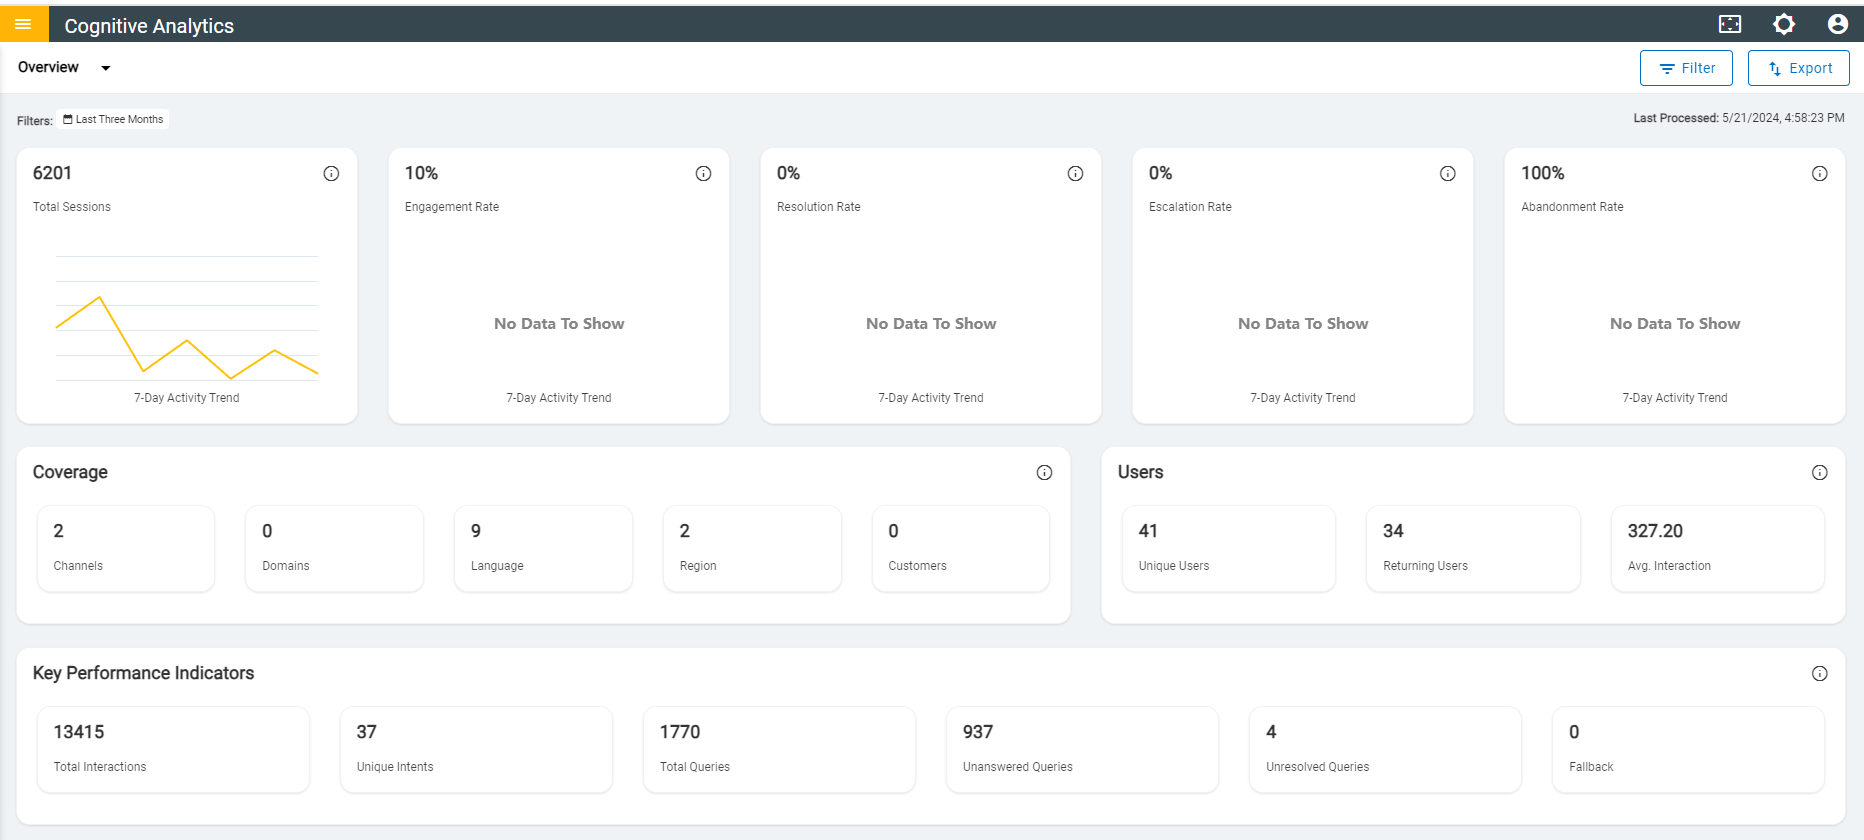
Figure 2. Filters 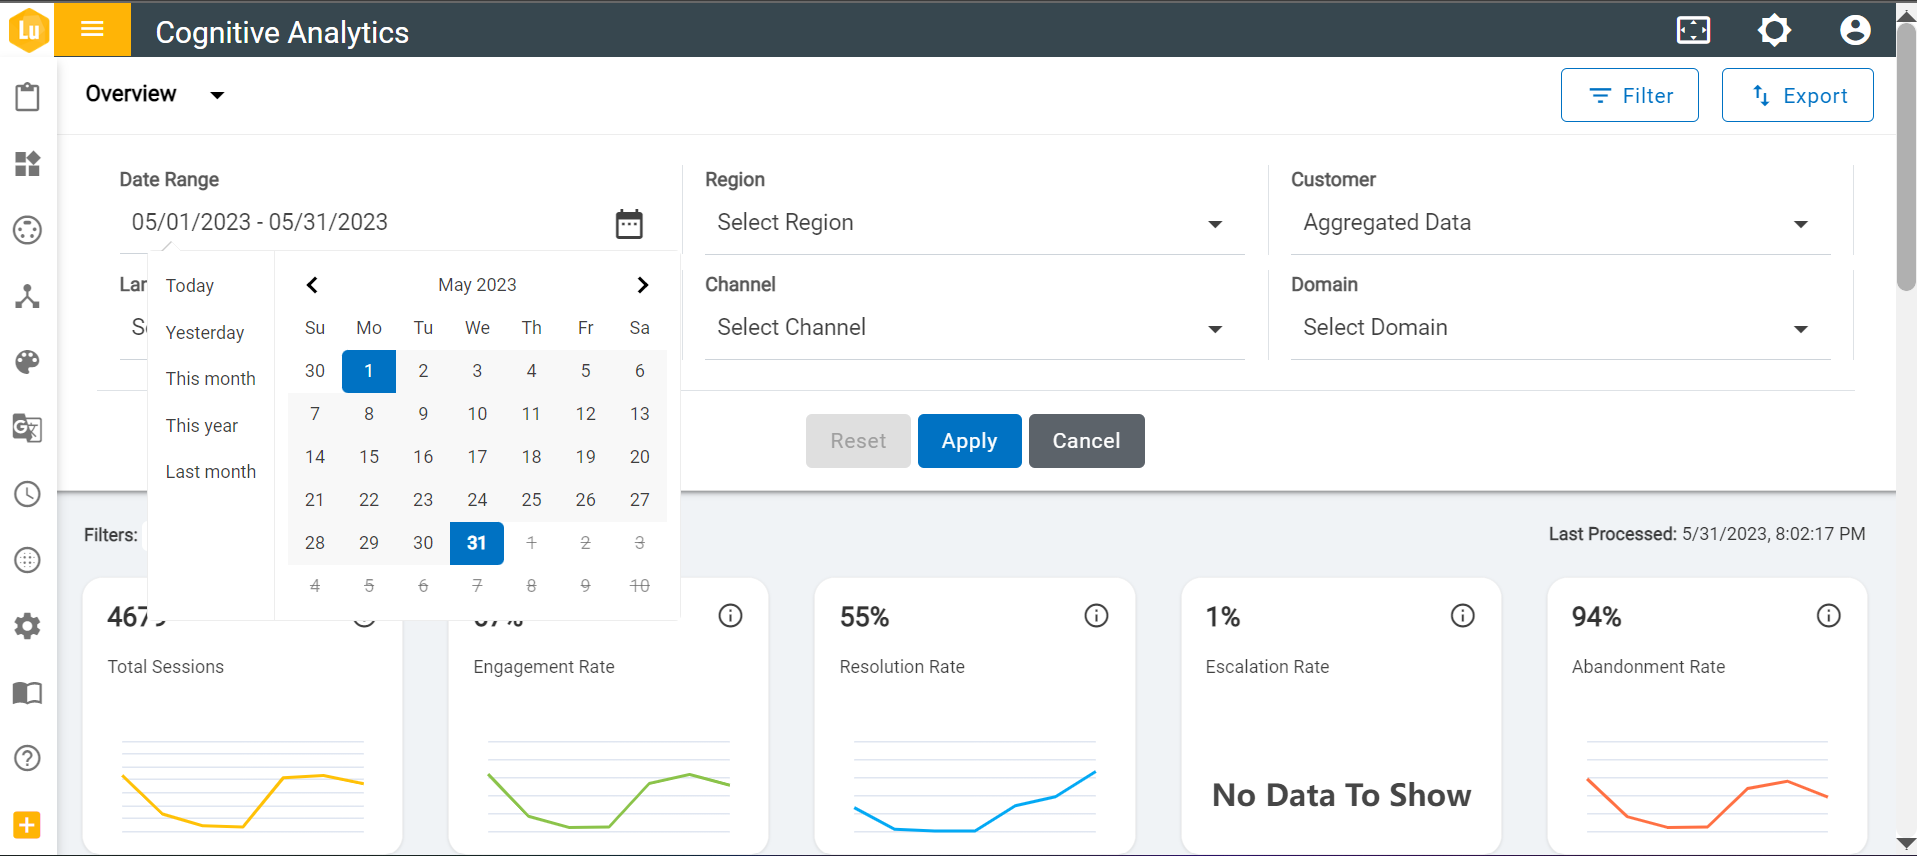
-
Filter Chips
After applying filters, the filter chips will display a consolidated view of the selected filters. Each filter chip contains information about the filter applied and user can simply remove a specific filter by clicking
 icon on the chips. This allows
users to refine filter results, enhancing the overall user experience.
icon on the chips. This allows
users to refine filter results, enhancing the overall user experience. Figure 3. Filter Chips 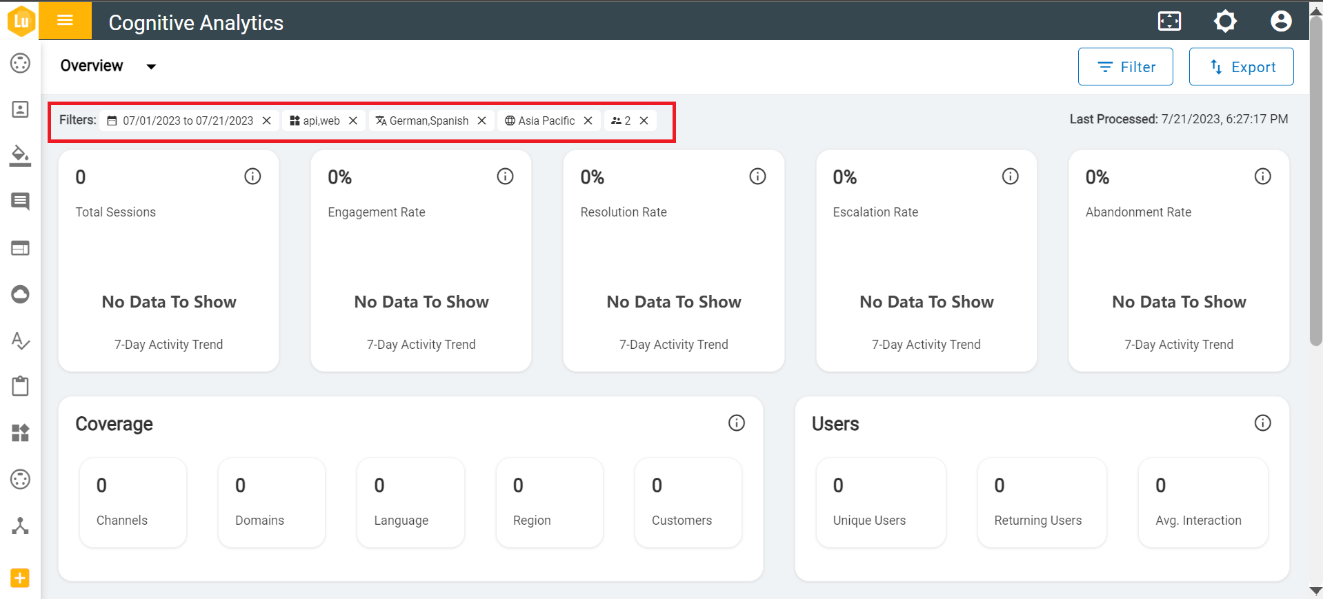
- Export
The Export button allows users to download or save a copy of the data, in which we provide two options to select, such as Resolved Dump and Unresolved Queries Dump, with a date range limitation of any 90 days. Depending on the selection, this allows users to save a copy of the data in JSON format for future reference or analysis.
Figure 4. Export Button 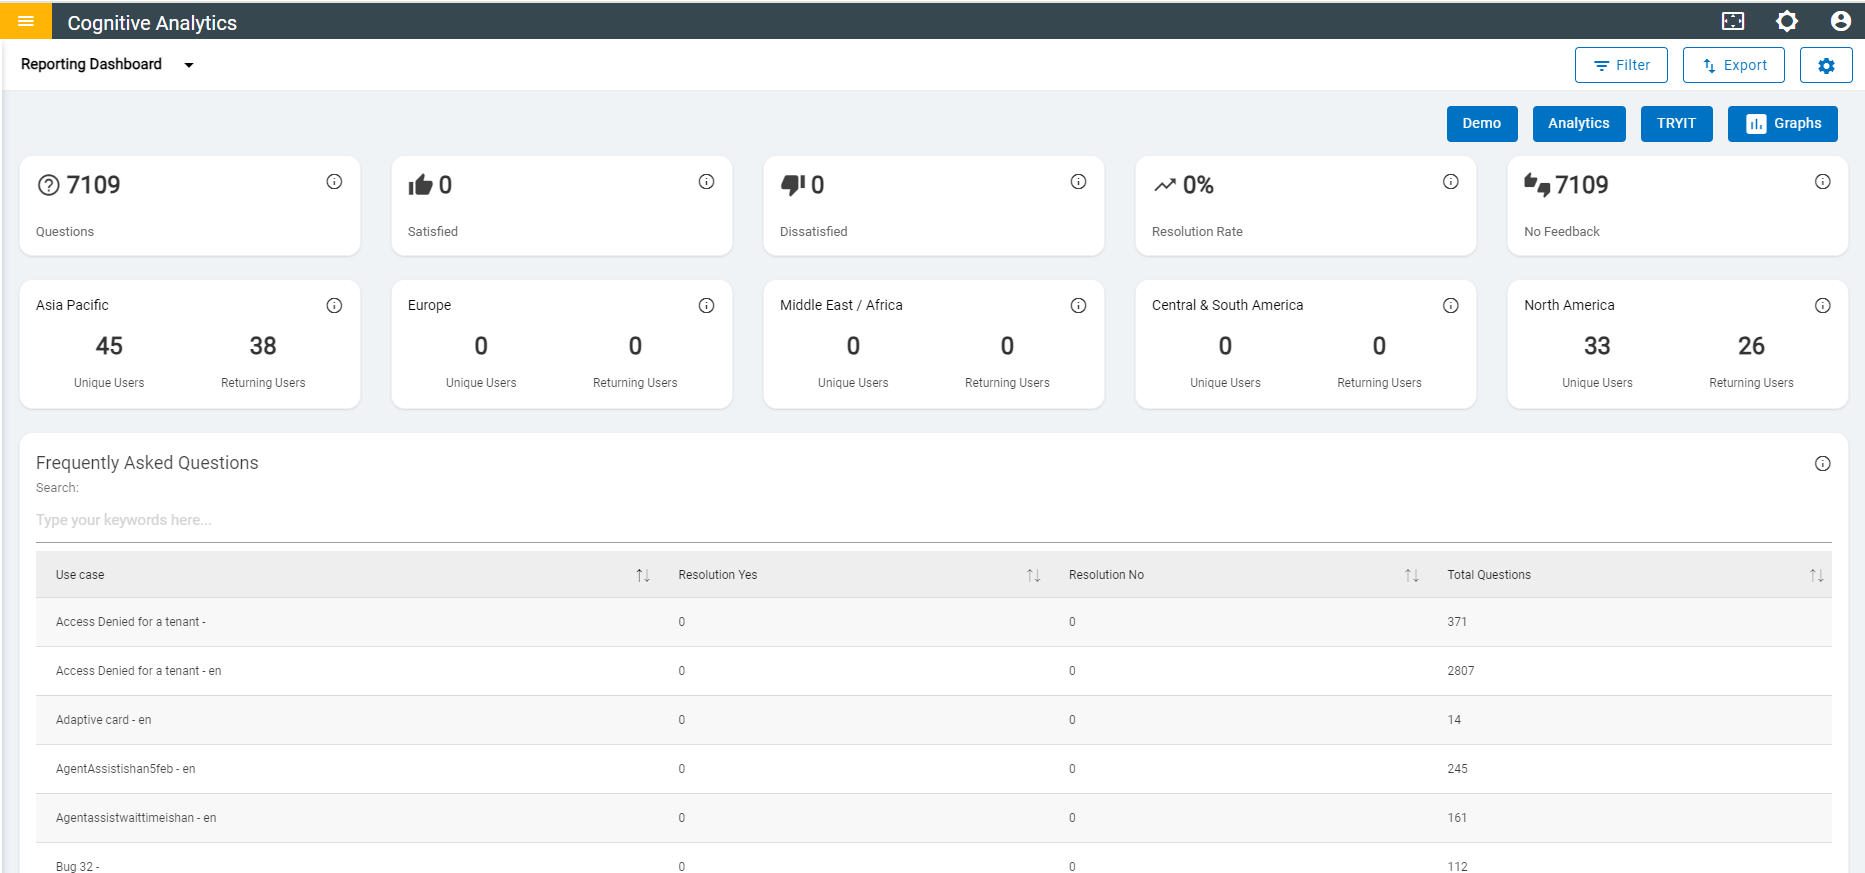
Figure 5. Export Data Dump 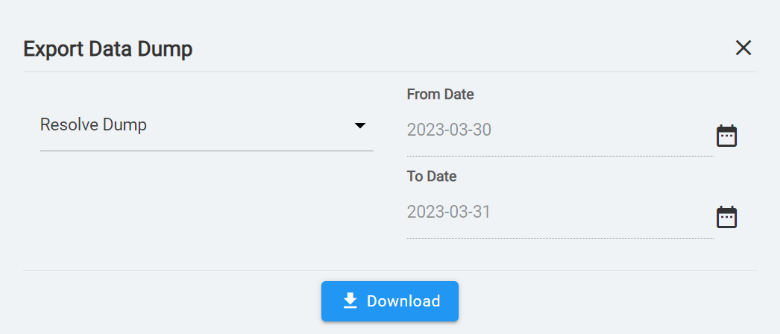
-
Last Processed
This provides information about the timeliness and accuracy of data processing that contains the date and time of the last data processing activity. This helps users to stay up-to-date and informed about the state of their data.
Figure 6. Last Processed 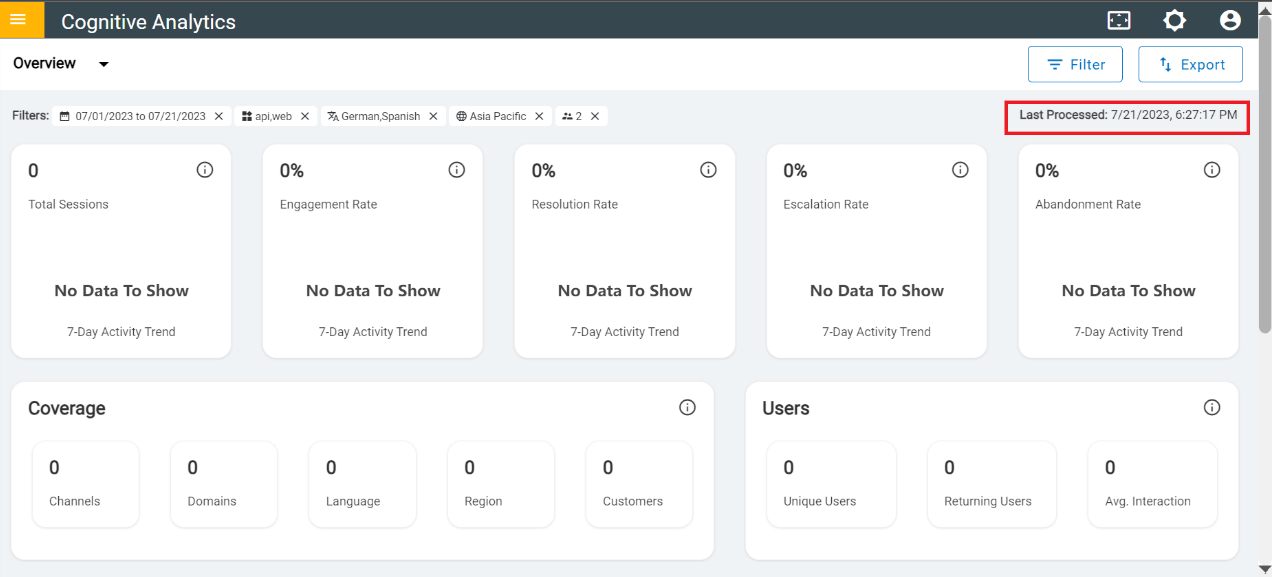
-
Detailed ViewClicking on
 icon displays a detailed information about each usecase.
Figure 7. Details icon .png)
Questions: Total indicates the count of valid queries made by users. Satisfied indicates the count of valid queries for which positive feedback was provided. Dissatisfaction indicates the count of valid queries for which negative feedback was provided.
Figure 8. Questions 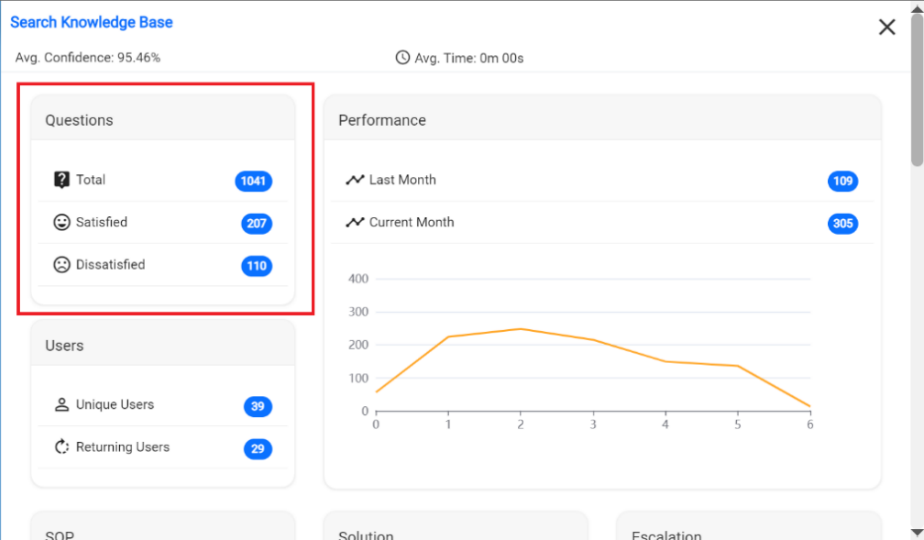
-
Users: User metrics covers the distinct users (Unique Users) and unique users who
have returned back (Returning Users).
Figure 9. Users 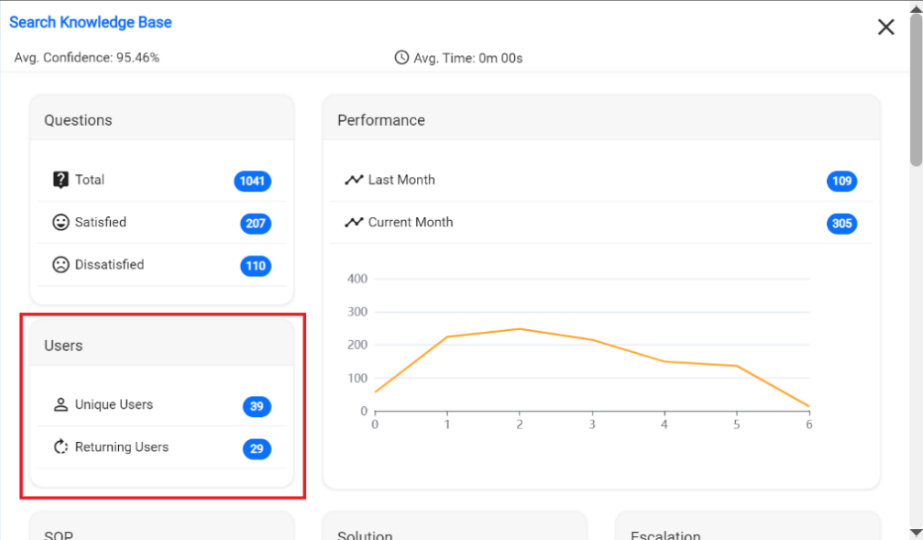
-
Performance: It displays the last and current month counts along with a graph that
indicates the data for a day of the week.
Figure 10. Performance 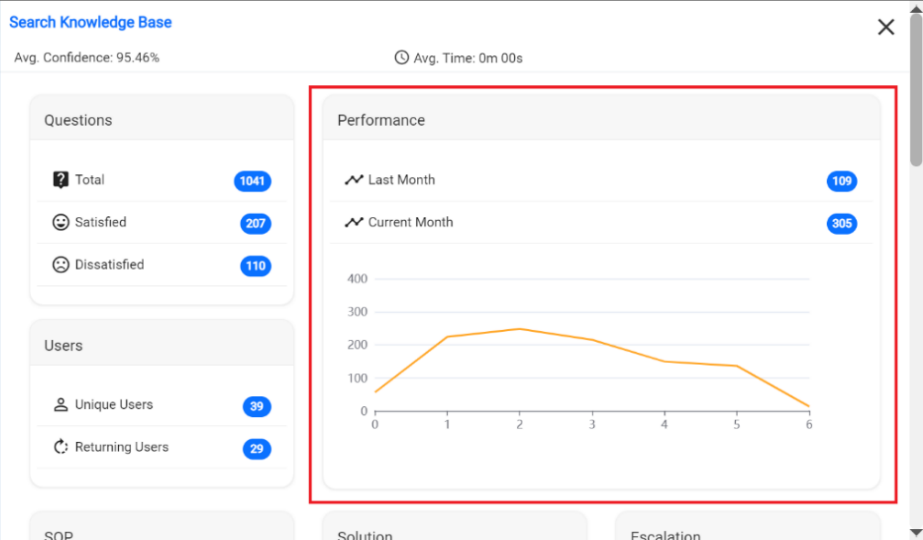
- SOP: Unique count and total number of times when an SOP (Standard Operating Procedure) is triggered in response to users for a specific query.
- Solution: Total count of Article and Script as solutions that were provided for queries.
-
Escalation: Total count of the ticket generated, and chat transferred for that
query.
Figure 11. SOP, Solution & Escalation 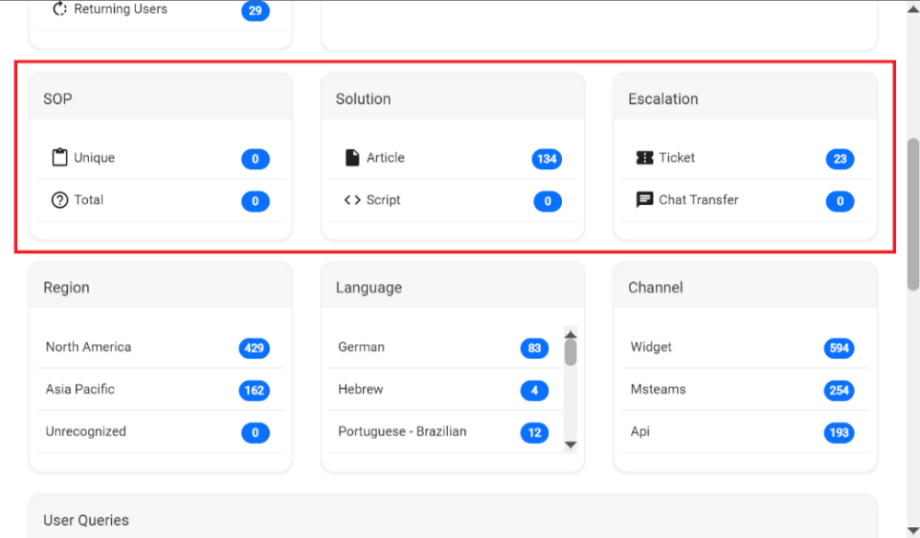
- Region: Count of occurrences from the list of regions.
- Language: Count of occurrences from the list of languages.
-
Channel: Count of occurrences from the list of channels.
Figure 12. Region, Language & Channel 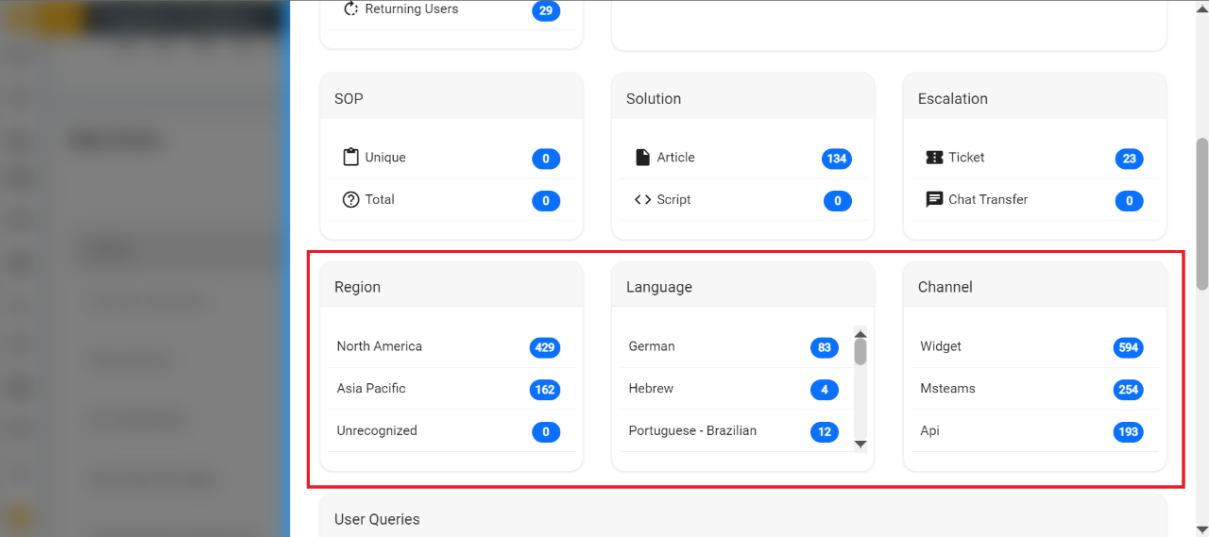
-
User Queries: Table represents the list of queries, satisfaction result, whether SOP
is provided or not, what type of escalation has happened for that query along with chat and
conversations information including the time created of each query.
Figure 13. User Queries 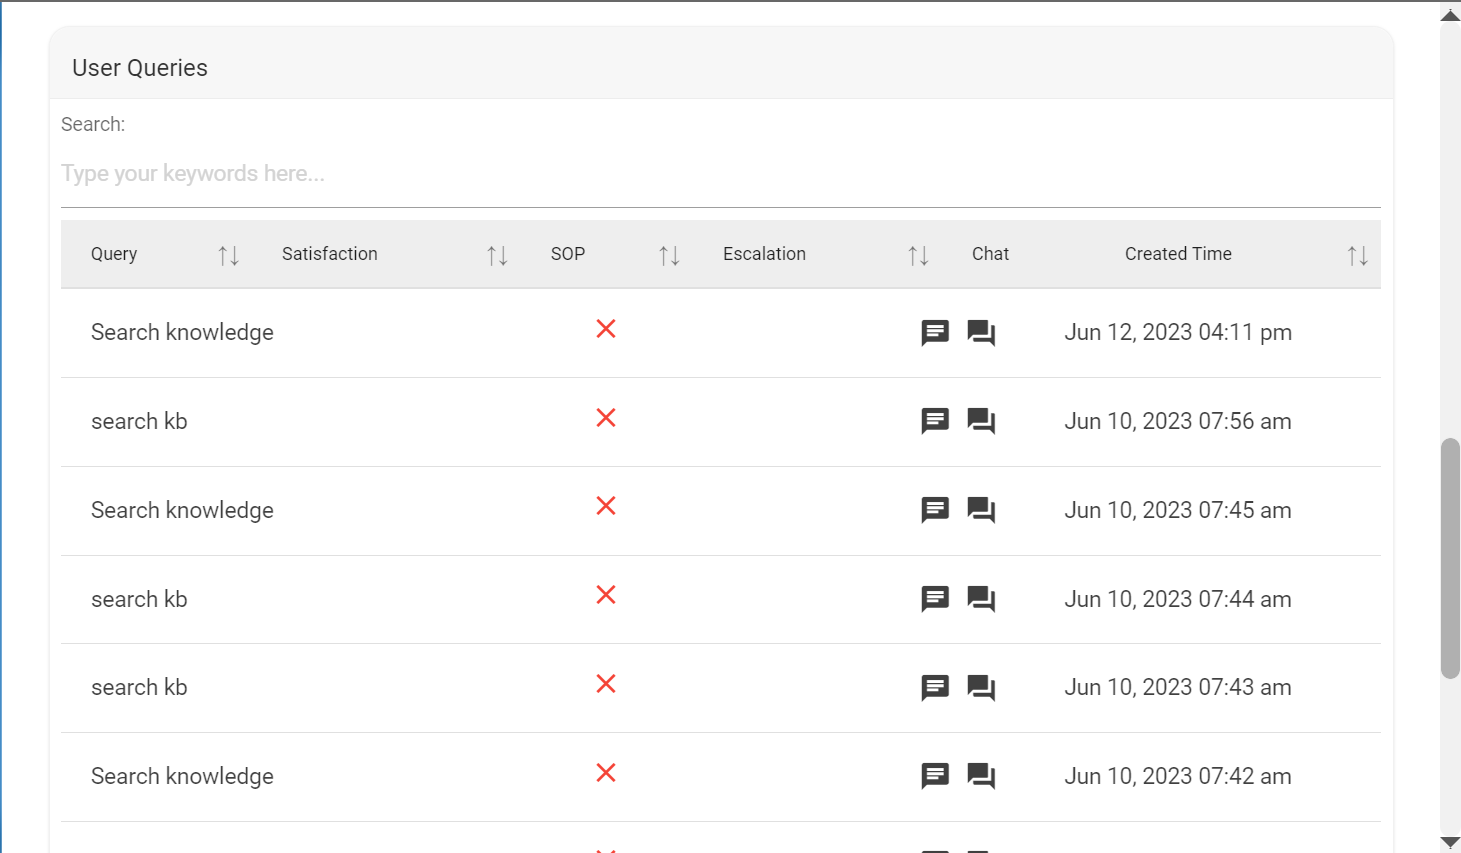
- Clicking on
 icon shows chat
information of each usecase.
icon shows chat
information of each usecase.Figure 14. Chat Icon .png)
Figure 15. Chat 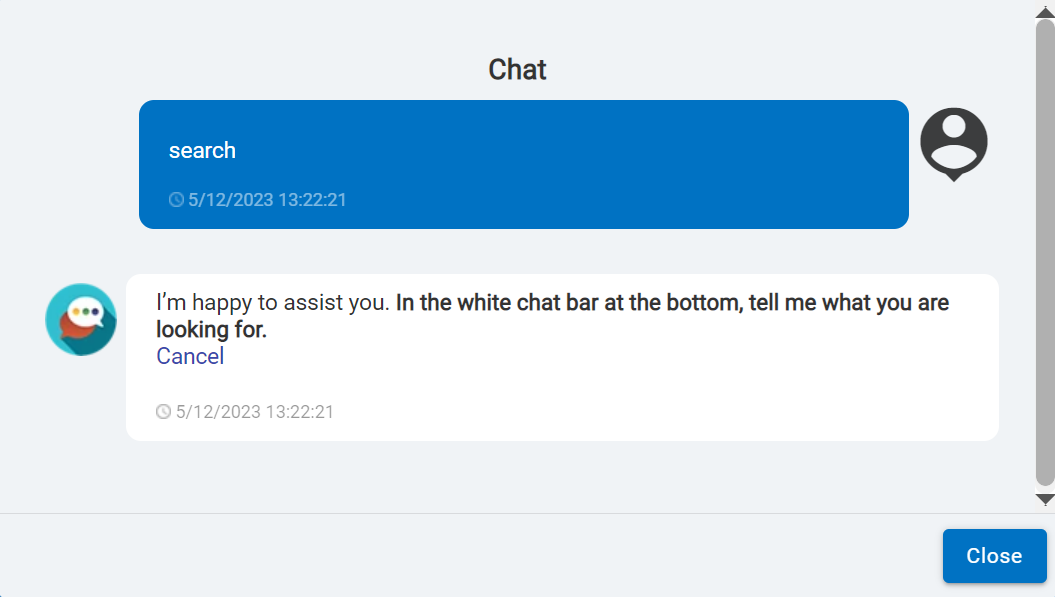
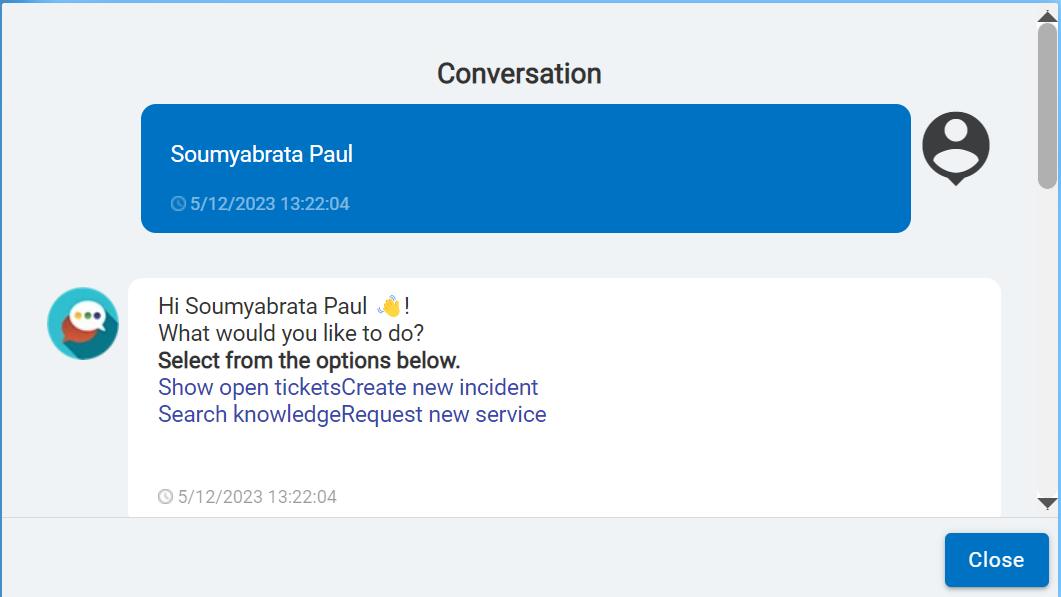
- Clicking on
 icon shows total
conversation of each usecase.
icon shows total
conversation of each usecase.Figure 16. Conversation Icon .png)
Figure 17. Conversation