IVR Dashboard
The Integrated Vulnerability Remediation (IVR) dashboard provides a centralized, dynamic interface to view, analyze, and remediate vulnerabilities within your environment. The dashboard adapts to display data whether it is directly synced from external scanners (such as Tenable) or manually uploaded through CSV spreadsheets. This consolidated view supports the correlation of external scanner data with BigFix content, enabling you to efficiently process the remediation flow.
Initial Dashboard Setup and Data Synchronization
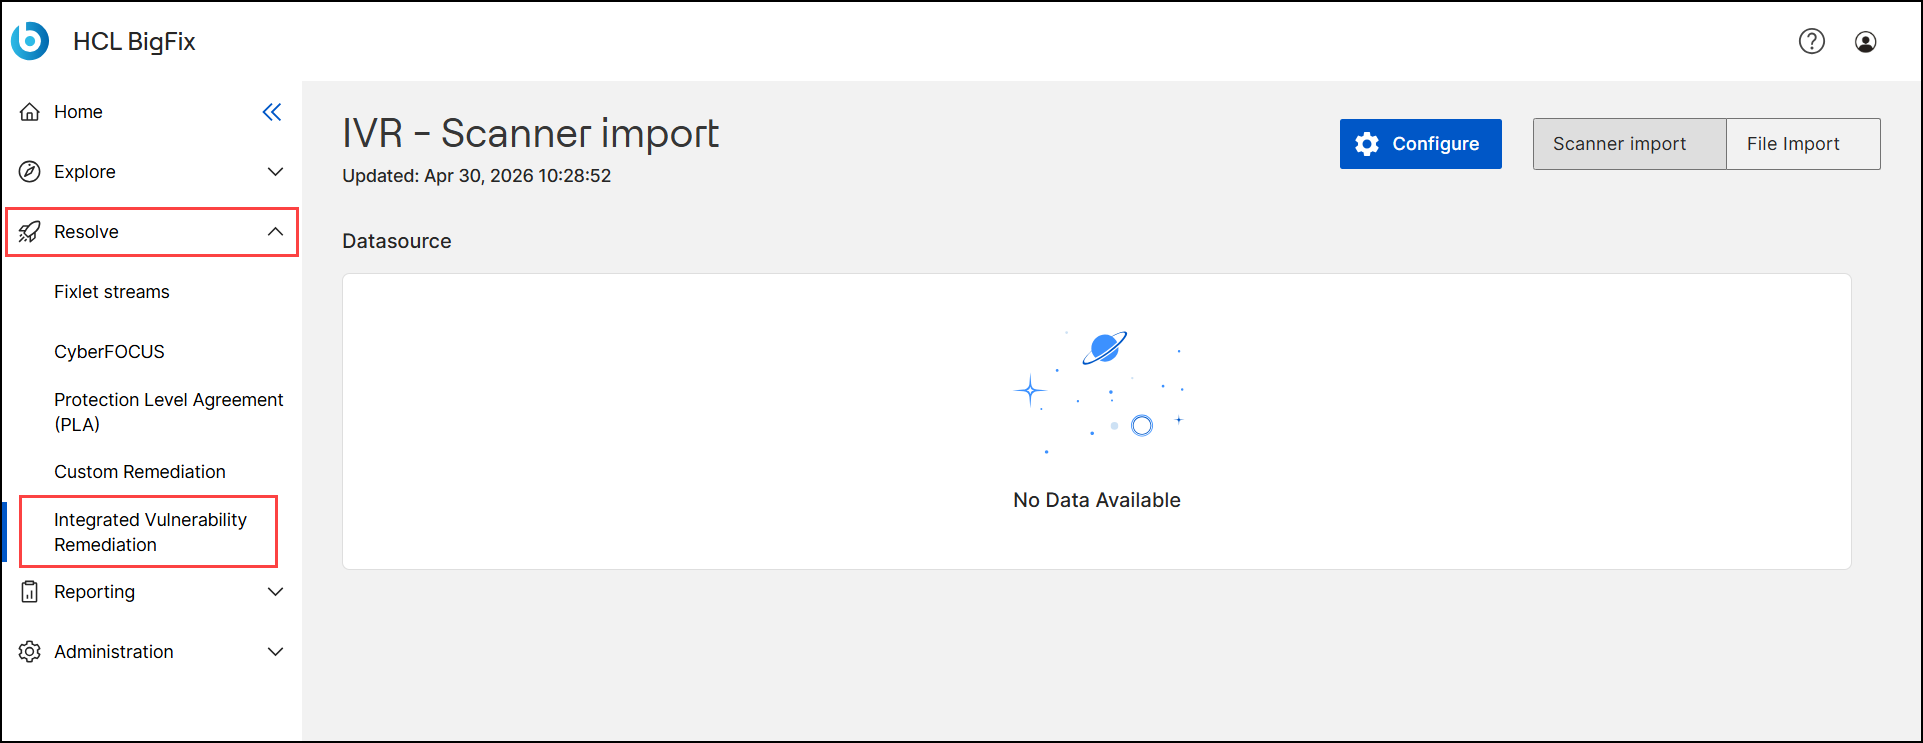
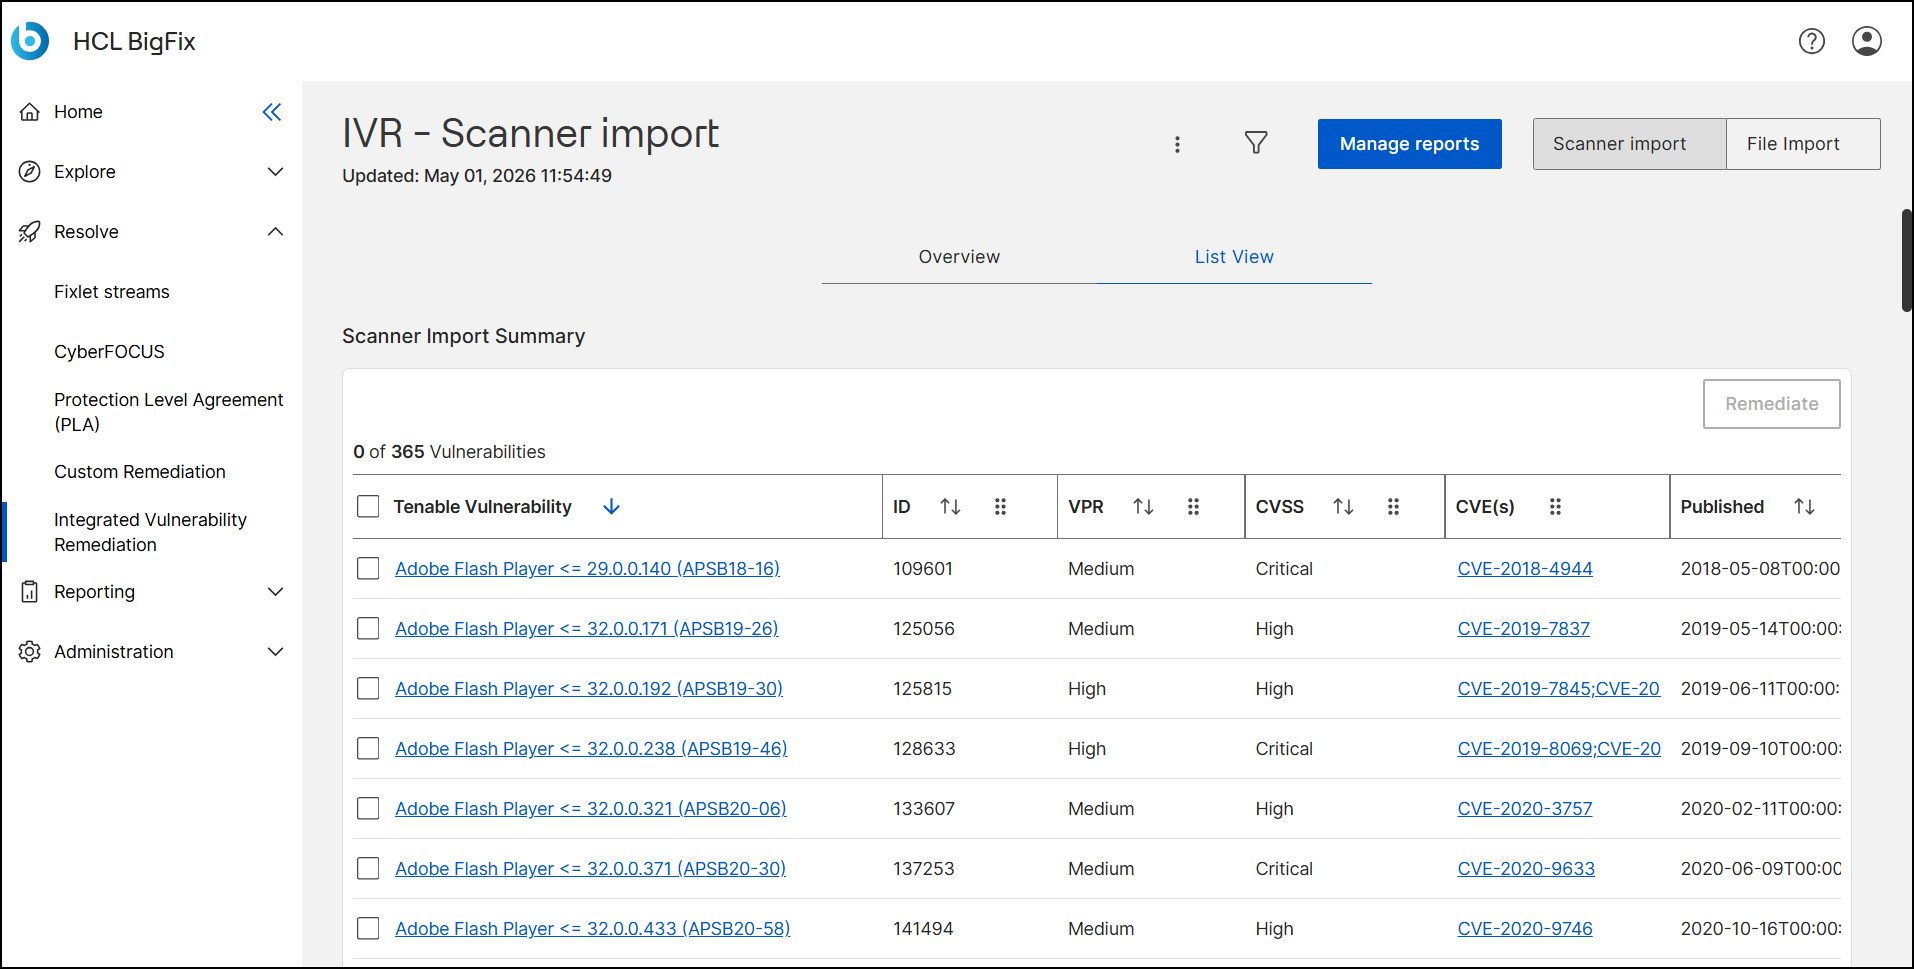
When you navigate to the IVR dashboard by expanding Resolve and selecting Integrated Vulnerability Remediation on the left navigation menu, the system automatically loads the IVR - Scanner import page.
If you have not yet configured a data source, the dashboard indicates that no data is available. You must establish a connection to an external vulnerability scanner (for example, Tenable) to populate the dashboard grids and charts.
You can consolidate your vulnerability data into a single view by integrating multiple scanners. For instructions on configuring initial or additional data sources, see Creating New Datasource.
Dashboard Layout
The IVR dashboard is divided into two primary functional areas: the header section for global controls and the main workspace for data analysis and remediation.
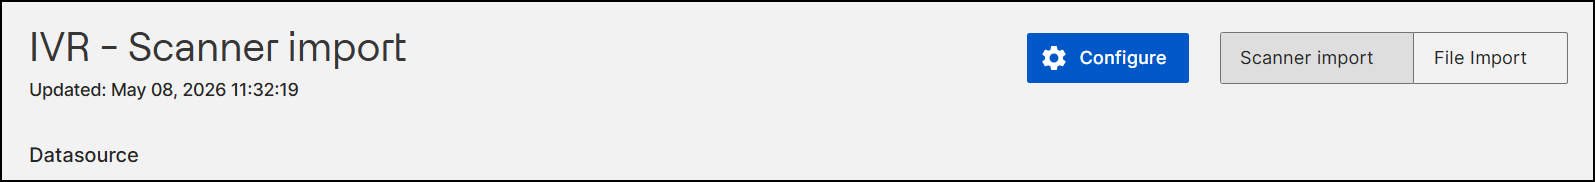
Header controls: The top section of the dashboard contains global tools to manage your overall view. The available buttons and features vary depending on whether you have a data source configured:
-
When a data source is not configured:
-
Configure: Select to set up your initial vulnerability data source.
-
Scanner import and File Import toggle: Switch between the automated scanner data view and the manual file import view.
-
-
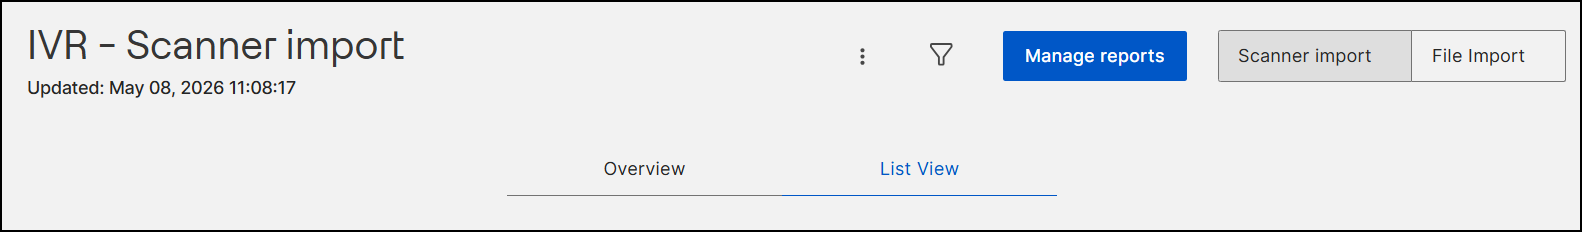
When a data source is configured:
-
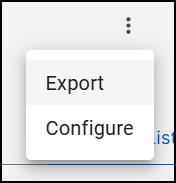
Vertical Ellipsis icon (three vertical dots): Select to reveal a menu with the following options:
-
Export: Export the vulnerability data. The exported file is in JPEG, PNG, or PDF format for the Overview charts, and in CSV or XLSX format for the List View data.
-
Configure: Open the configuration settings to add additional data sources.
-
-
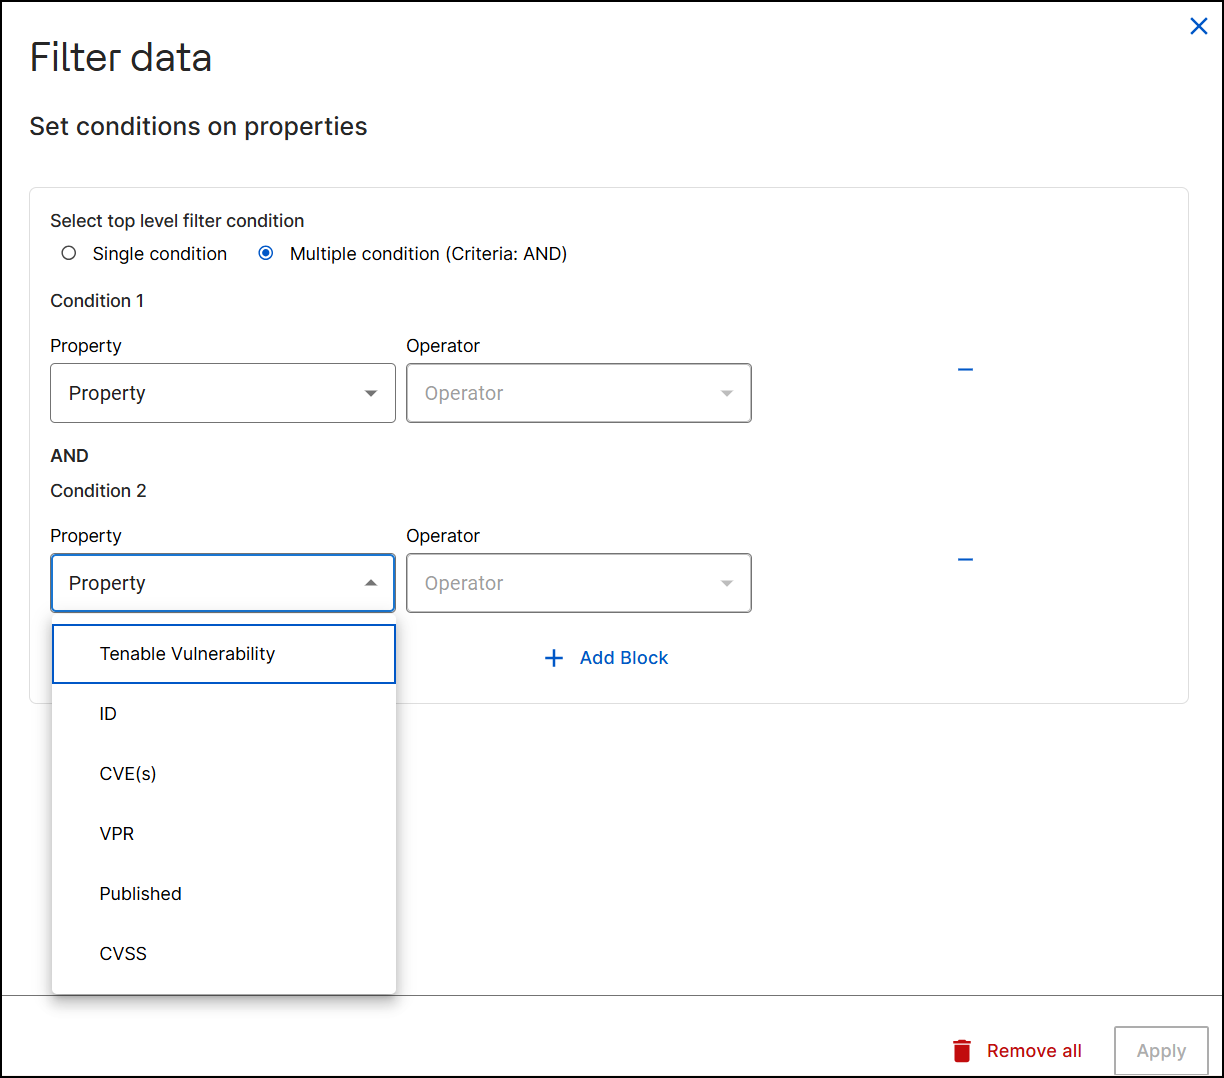
Filter icon
 : Select to open the Filter data
widget, which allows you to set multiple levels of filtering
conditions based on selected vulnerability properties. You can
filter data using the following properties:
: Select to open the Filter data
widget, which allows you to set multiple levels of filtering
conditions based on selected vulnerability properties. You can
filter data using the following properties:-
Tenable Vulnerability: Filter by the specific name of the vulnerability.
-
ID: Filter by the unique numeric identifier.
-
CVE(s): Filter by the Common Vulnerabilities and Exposures identifiers.
-
VPR: Filter by the Vulnerability Priority Rating score.
-
Published: Filter by the date the vulnerability was disclosed.
-
CVSS: Filter by the Common Vulnerability Scoring System score.
-
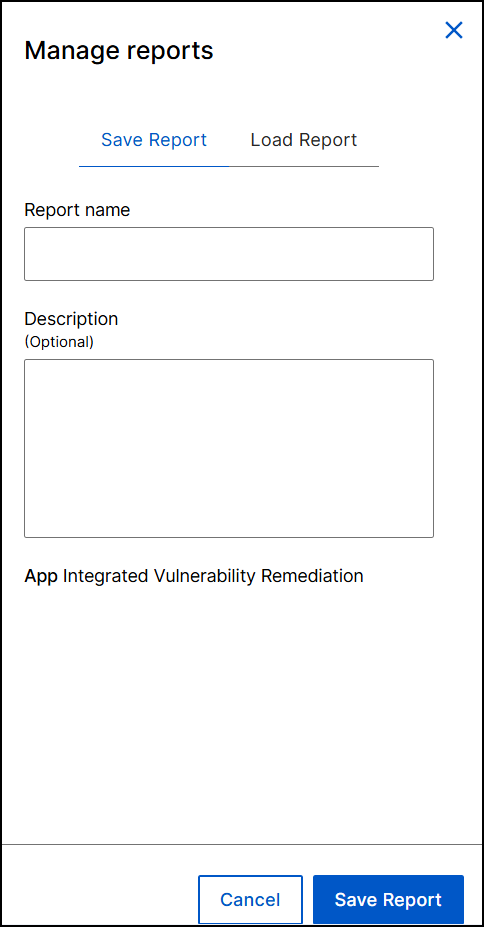
- Manage reports: Select to open the Manage Reports widget. Use
this to save your current dashboard view for quick access later, or
reload a previously saved report.
- Save Report: Select to save your current grid data (in
List view) as a named report.
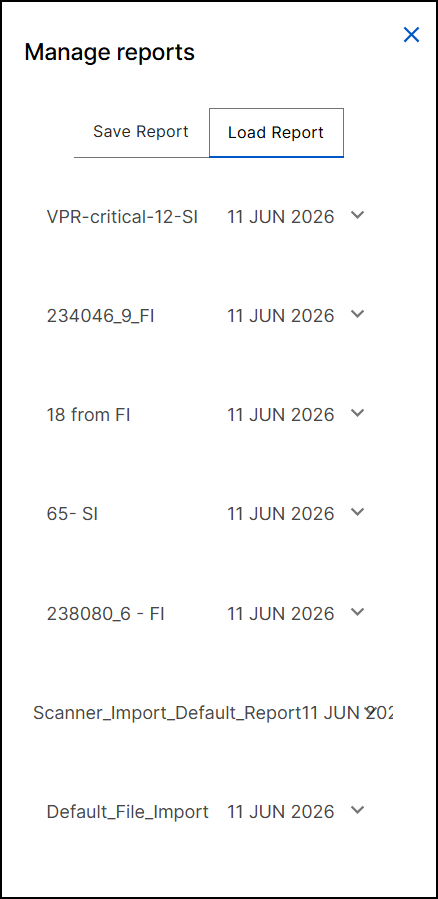
- Load report: Select to view a list of all previously
saved reports. Selecting a specific report loads it into the
data grid (in List view).
- Save Report: Select to save your current grid data (in
List view) as a named report.
- Scanner import and File import toggles: Switch between the automated scanner data view and the manual file import view.
- Overview and List View toggles: Switch between the visual analytics summary and the tabular list of vulnerabilities.
-
- Main workspace: The main area of the dashboard adapts its content based
on your selected data context. It serves as the primary location to analyze
vulnerability metrics and initiate the remediation workflow.
- Scanner import view: When viewing automated scanner data, the
workspace displays the content for either the List View tab (a
detailed grid of active vulnerabilities) or the Overview tab
(visual analytics and charts).
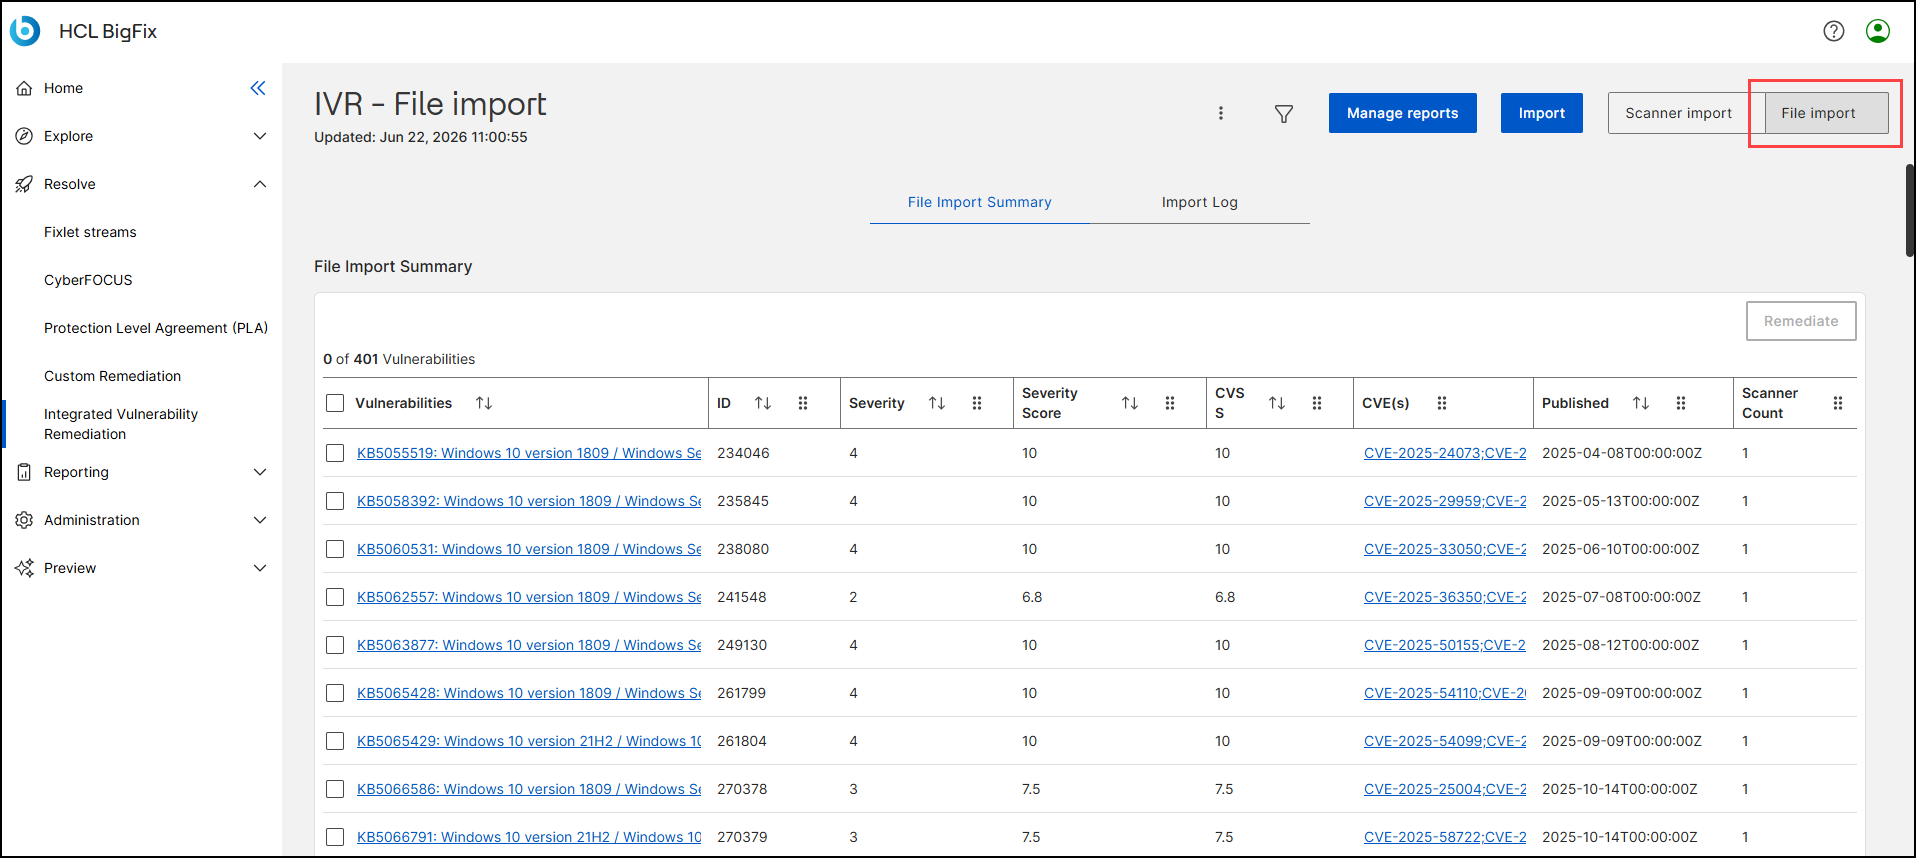
- File import view: When viewing manual data, the workspace
displays the File Import Summary tab (a grid of manually uploaded
vulnerabilities) and the Import Log tab (historical import
metrics).
- Scanner import view: When viewing automated scanner data, the
workspace displays the content for either the List View tab (a
detailed grid of active vulnerabilities) or the Overview tab
(visual analytics and charts).
Analyzing and Remediating Vulnerability Lists
The data grids in the main workspace (List View for scanner imports and File Import Summary for manual imports) display critical identifying information about the vulnerabilities in your environment. You can interact directly with your vulnerability data from these grids.
The specific columns available depend on the data view you are currently accessing:
- Scanner import: When you view automated data synced from an integrated
vulnerability scanner on the List View tab, the data grid displays the
following columns:
Column Name Data Type Description (Selection Checkbox) Interactive Checkbox A control that allows you to select one or multiple rows to perform actions (like Remediate). A master checkbox at the table header enables bulk selection. Tenable Vulnerability Text Link (Hyperlink) The descriptive name of the security vulnerability as identified by the vulnerability scanner (Tenable). This text is hyperlinked, leading to more details about the specific vulnerability displayed under the following tabs: - Vulnerability Information: This includes a brief summary, a detailed description, and a solution for the specific vulnerability. You can also fix the vulnerability from here by clicking Remediate and following the steps given in the IVR Remediate flow page.
- Contents: It shows the Fixlets that are related to this specific vulnerability. Select a Content Name to open more details about a specific Fixlet on the Fixlet details page.
- Devices: It shows the devices that the specific Fixlet can be applied to. Click on Devices to go to Device Details page.
- Deployment: It shows the deployment data. To learn how to deploy the Fixlet, go to Deploying Fixlets page.
ID Numeric A unique numeric identifier assigned to the specific vulnerability instance within the system for tracking and reference purposes. VPR Categorical Text Vulnerability Priority Rating. A dynamic rating (e.g., Low, Medium, High) that helps prioritize remediation by combining technical severity with threat intelligence (specific to Tenable's scoring). CVSS Categorical Text Common Vulnerability Scoring System. An industry-standard score (e.g., Critical, High) that reflects the intrinsic severity of the vulnerability based on its technical characteristics. CVE(s) Alphanumeric Link Common Vulnerabilities and Exposures. A list of standardized identifiers (e.g., CVE-2019-7837) that reference the vulnerability in the public National Vulnerability Database (NVD). These are hyperlinked for external reference. Published Date/Time (Timestamp) The date and time (in ISO 8601 format) when the vulnerability was publicly disclosed or added to the database. Tenable Count Numeric Displays the number of vulnerable devices identified by Tenable. - File import: When you view manually uploaded data on the File Import
Summary tab, the data grid displays the columns mapped during the
Universal Vulnerability Ingestion (UVI) process:
Column Name Data Type Description (Selection Checkbox) Interactive Checkbox A control that allows you to select one or multiple rows to perform actions (like Remediate). A master checkbox at the table header enables bulk selection. Vulnerabilities Text Link (Hyperlink) Displays the name or title of the vulnerability as mapped from your imported CSV file. This text is hyperlinked, leading to more details about the specific vulnerability displayed under the following tabs: - Vulnerability Information: This includes a brief summary, a detailed description, and a solution for the specific vulnerability. You can also fix the vulnerability from here by clicking Remediate and following the steps given in the IVR Remediate flow page.
- Contents: It shows the Fixlets that are related to this specific vulnerability. Select a Content Name to open more details about a specific Fixlet on the Fixlet details page.
- Devices: It shows the devices that the specific Fixlet can be applied to. Click on Devices to go to Device Details page.
- Deployment: It shows the deployment data. To learn how to deploy the Fixlet, go to Deploying Fixlets page.
ID Numeric A unique numeric identifier assigned to the specific vulnerability instance within the system for tracking and reference purposes. Severity String Displays the categorical severity level of the vulnerability (for example, Critical, High, Medium, or Low) based on your imported data. Severity Score Numeric Displays the numerical severity score of the vulnerability based on your imported data. CVSS Categorical Text Common Vulnerability Scoring System. An industry-standard score (e.g., Critical, High) that reflects the intrinsic severity of the vulnerability based on its technical characteristics. CVE(s) Alphanumeric Link Common Vulnerabilities and Exposures. A list of standardized identifiers (e.g., CVE-2019-7837) that reference the vulnerability in the public National Vulnerability Database (NVD). These are hyperlinked for external reference. Published Date/Time (Timestamp) The date and time (in ISO 8601 format) when the vulnerability was publicly disclosed or added to the database. Scanner Count Numeric Displays the number of vulnerable devices based on your imported data.
From either of these grid views, you can select one or more specific vulnerabilities using the checkboxes and select Remediate to initiate the standard IVR remediation flow and deploy fixlets to your endpoints. For more information, see IVR Remediation Flow.
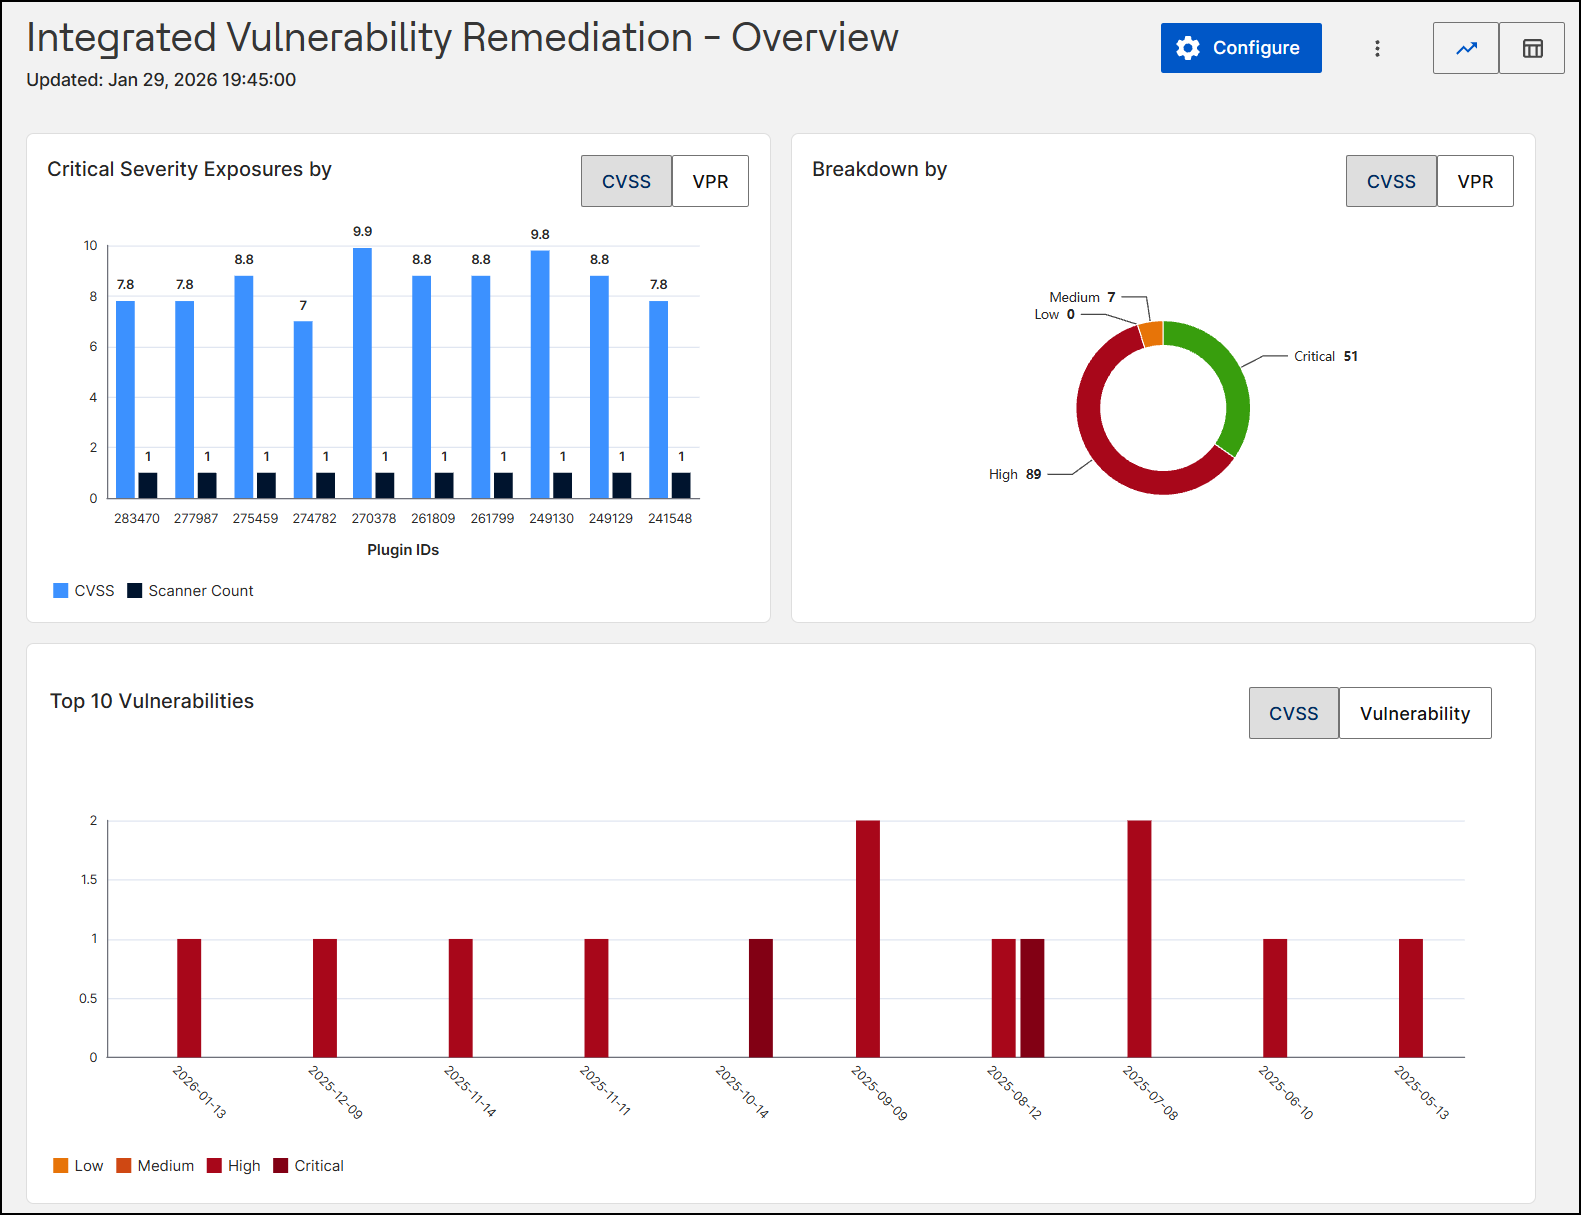
Visualizing data on the Overview tab
In the Scanner Import view, selecting the Overview toggle changes the interface to visual analytics. These refined charts are designed to help you quickly prioritize remediation efforts.
-
Header Section: The header in the Overview view displays the following elements:
-
Vertical Ellipsis icon (three vertical dots): Select to reveal a menu with the following options:
-
Export: Select Export to download graphical reports as a JPEG, PNG, or PDF file.
-
Configure: Select Configure to open the Configure Datasource page, where you can manage datasource integrations.
-
- Scanner import and File import toggles: Switch between the automated scanner data view and the manual file import view.
- Overview and List View toggles: Switch between the visual analytics summary and the tabular list of vulnerabilities.
Note:The Filter icon and Manage Reports button are hidden in this view. -
-
Workspace: The workspace presents vulnerability trends using interactive charts:
-
Critical Severity Exposures by: This clustered bar chart visualizes vulnerabilities based on their Plugin IDs. For each ID, it plots the Severity Score (Light Blue) and Scanner Count (Dark Blue) side-by-side, allowing you to correlate the risk level with its detection frequency. You can toggle the view to base the analysis on either CVSS or VPR scoring models.
-
Breakdown by: A donut chart that shows the distribution of vulnerabilities by severity level (for example, Critical vs. High). You can toggle the view by CVSS or VPR.
-
Top 10 Vulnerabilities: This timeline bar chart visualizes the most significant security risks in your environment. It plots vulnerability counts against publication dates using a bar chart color-coded by severity (from Low to Critical). The timeline focuses exclusively on the dates associated with the ten highest-ranked risks (based on severity and frequency). You can toggle the view between CVSS and Vulnerability to analyze the distribution by severity score or specific threat.
-
Filtering Vulnerabilities
Apply advanced filters to quickly locate specific security flaws across large datasets by multiple properties simultaneously, including Tenable Vulnerability, ID, CVE(s), VPR, Published, and CVSS.
To filter vulnerability data:
-
Select the Filter icon
in
the header controls to open the Filter data widget. -
Set your desired filtering conditions based on the available vulnerability properties.
-
Select Apply.
When filters are active, visual indicators appear above the main workspace grid. You can use these indicators to easily identify and clear specific filters as needed.
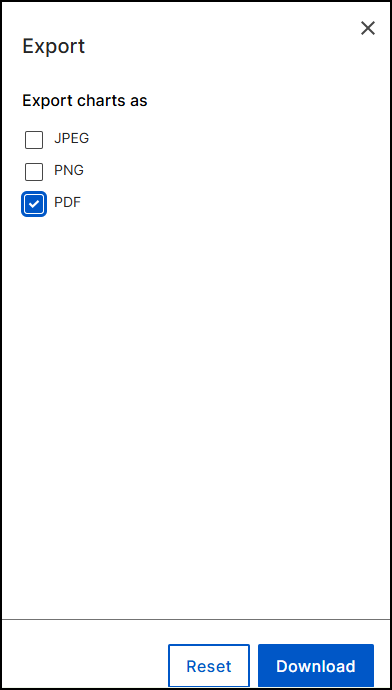
Exporting Dashboard Data
You can export data from the dashboard to share with external stakeholders, generate reports, or conduct offline analysis.
To export vulnerability data:
-
Select the Ellipsis icon (three vertical dots) in the header controls.
-
Select Export.
The available file formats depend on your active view:
-
List View: Download the grid data as a CSV or Excel file.
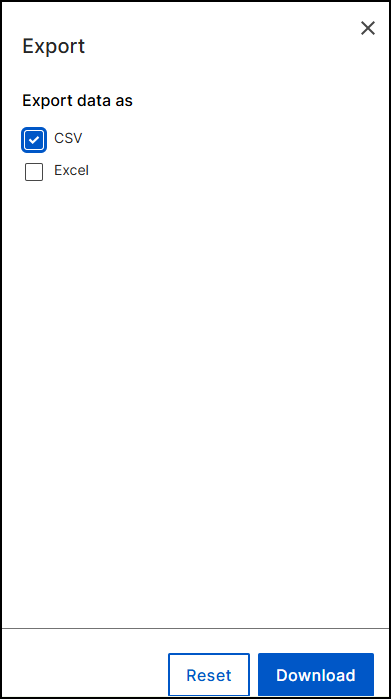
-
Overview: Download the data charts as a JPEG, PNG, or PDF file.