DAG
Manage DAG
- To manage a DAG or node, click on Netbot Troubleshooting🡪Manage DAG.
Figure 1. Manage DAG 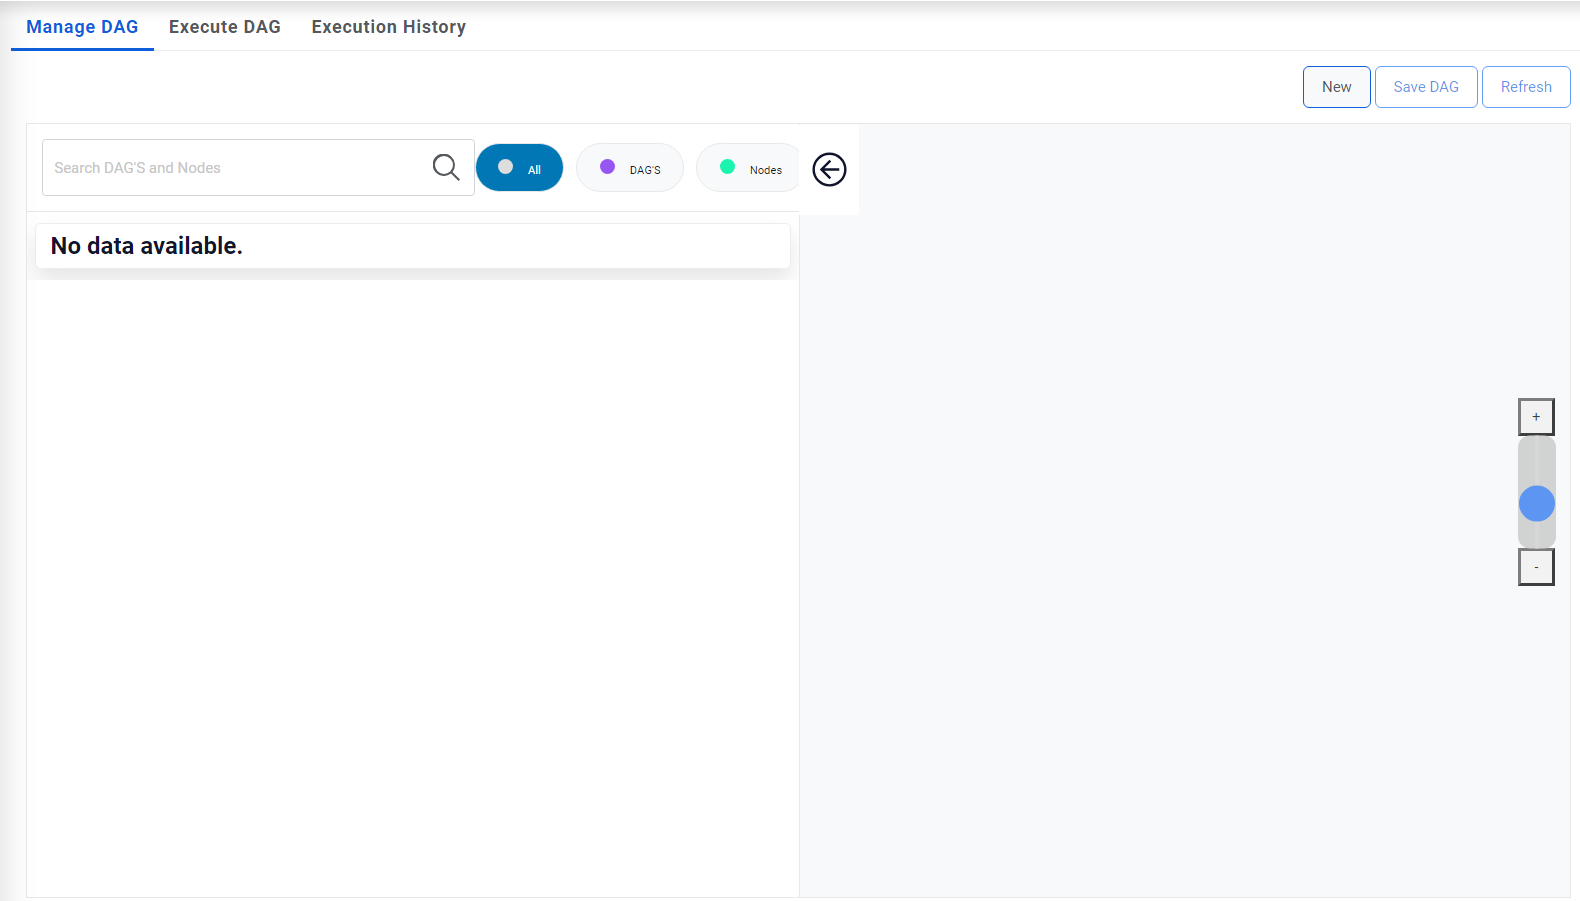
- User can add a Node/Dag by clicking “New” button and filling details like Name,
Description, and Information/script under the Create DAG property window. Click “OK’ then
click on “Save DAG” button.
Figure 2. Manage DAG (Cont.) 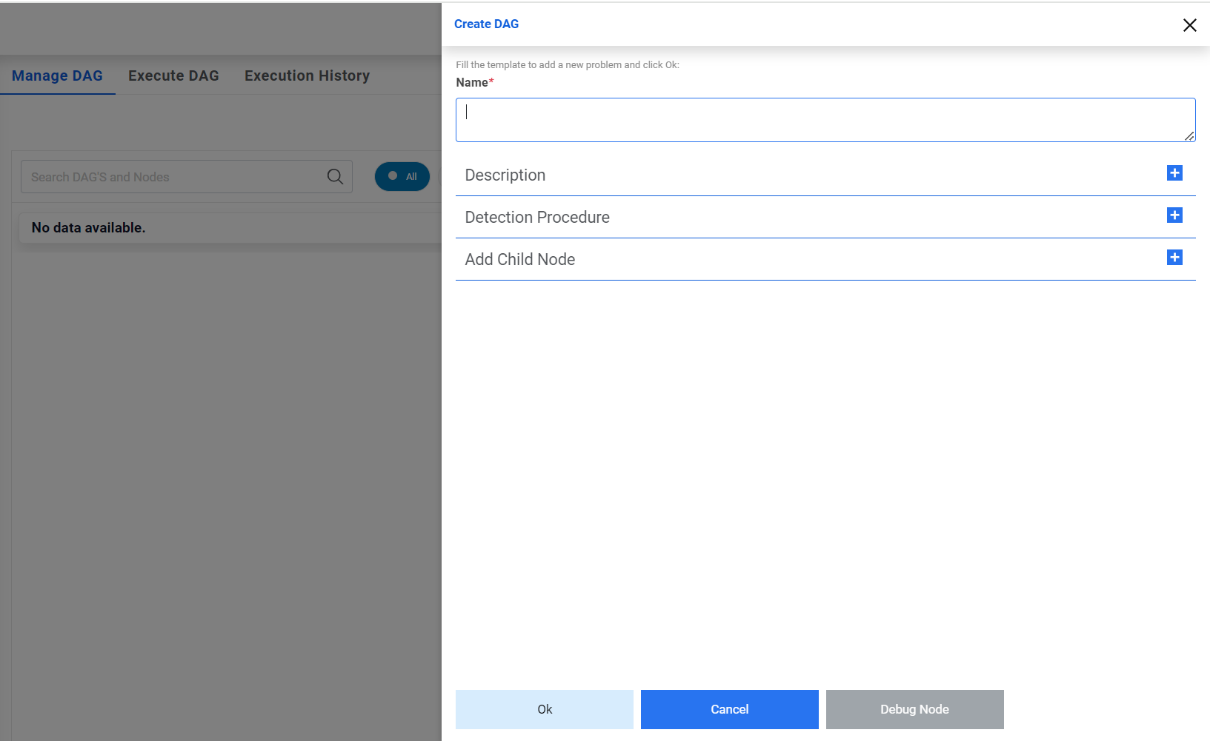
- An alert will be generated:
Figure 3. Manage DAG (Cont.) 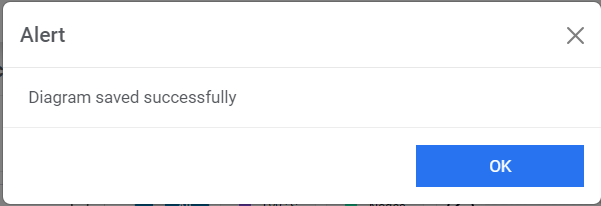
- All the created DAGs and nodes will now be visible on left pane and when user clicks on
any of them, its diagram will be visible in right pane.
Figure 4. Manage DAG (Cont.) 
- Use can map a node as child node Selecting a node from “Add Child Node” dropdown and
clicking “Add New child” button on the Create Dag property window. Adding child (s) node
under a DAG, all the child(s) node mapping (linking)will appear on diagram by clicking the
OK button and diagram will save by clicking save DAG button.
Figure 5. Manage DAG (Cont.) 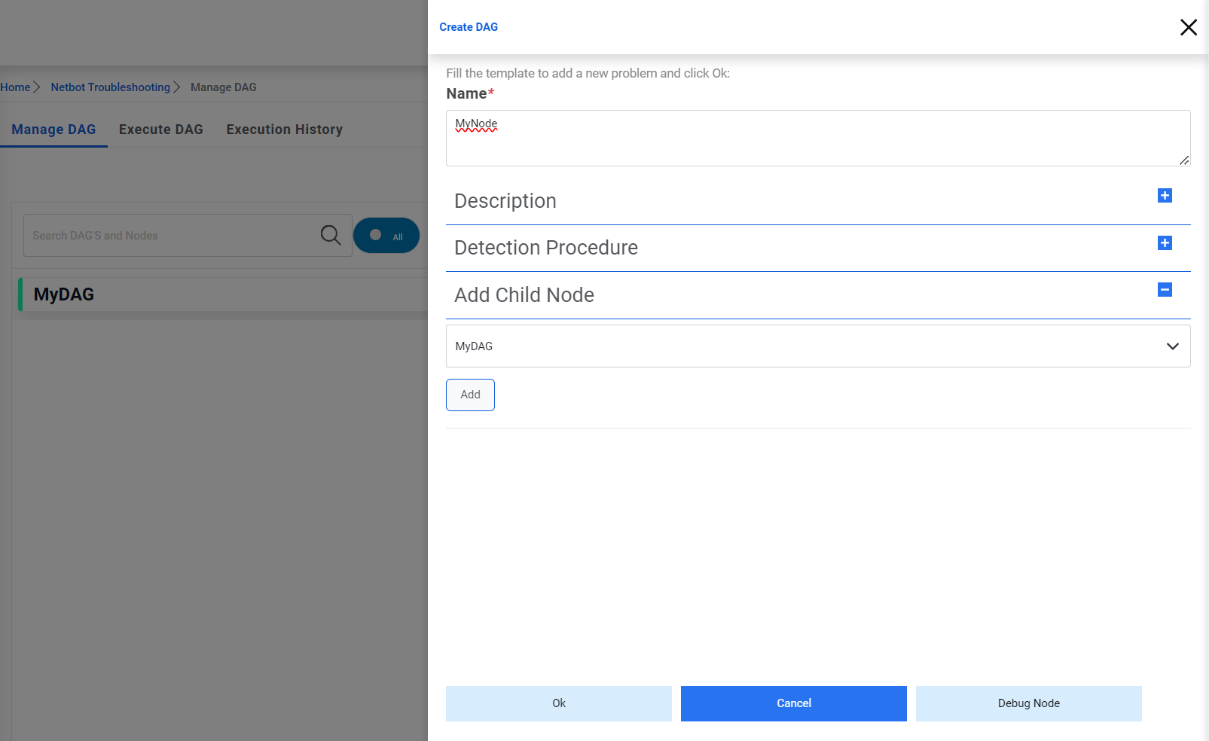
- Once child node is added, an arrow linking will be visible in the diagram of the
DAG.
Figure 6. Manage DAG (Cont.) 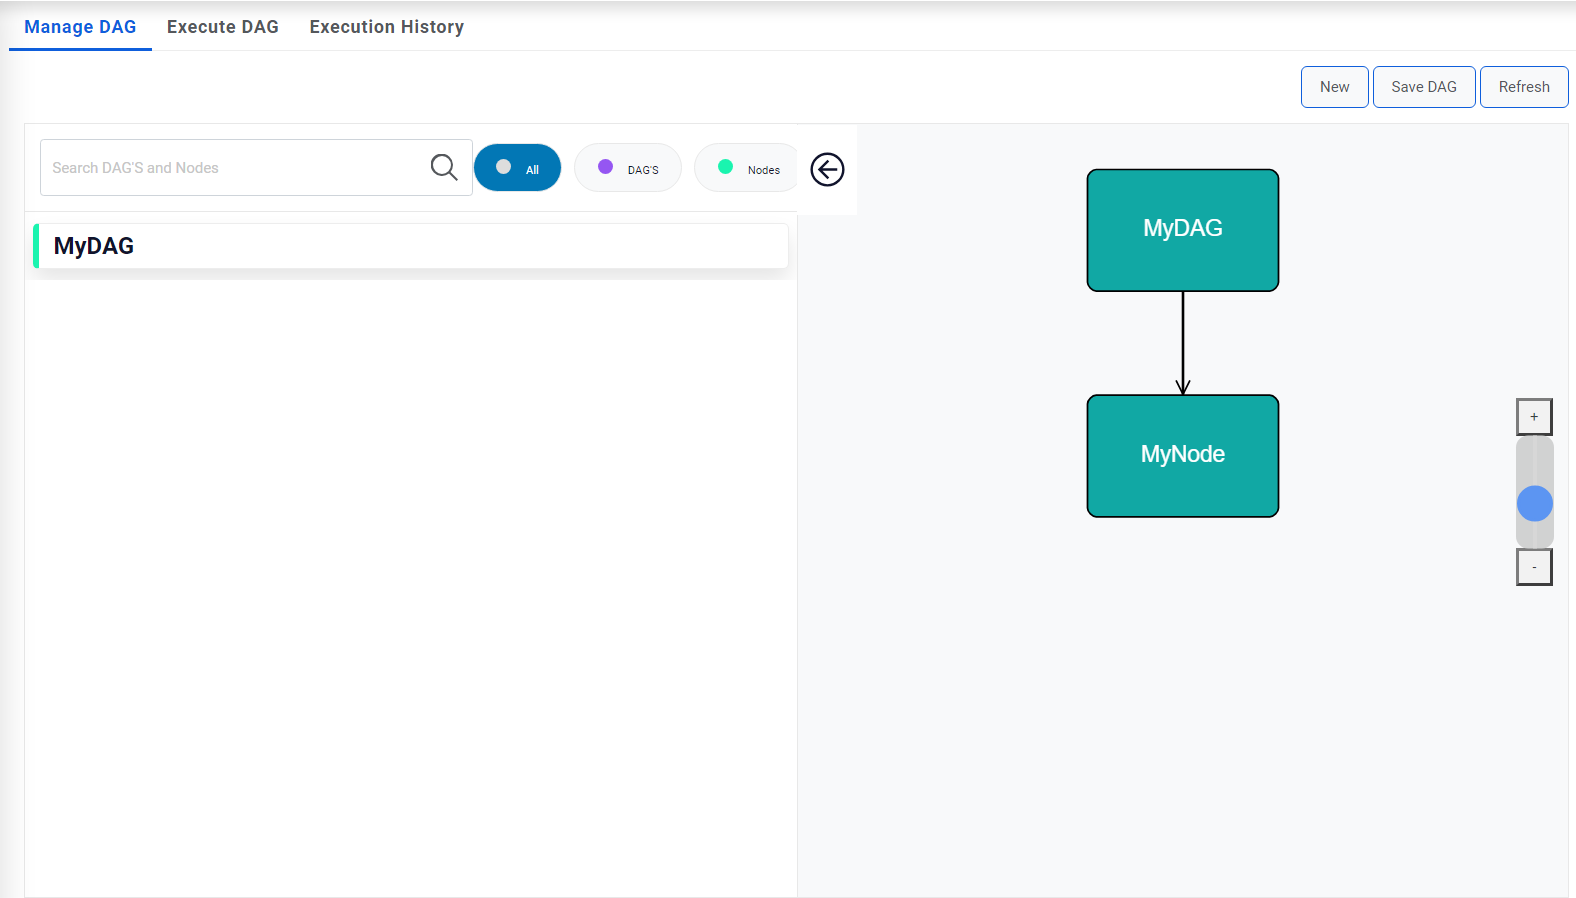
- A DAG/Node can be edited by selecting a DAG/node from the left side. Selecting Dag/Node,
related diagram will populate on the right side. Clicking pencil icon (screenshot below),
one can edit a DAG /node, we can add a child or edit the properties like Description,
Information, parameter changes.
Figure 7. Manage DAG (Cont.) 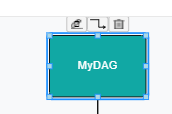
-
Node/Dag Mapping – One can change map a child by dragging the arrow from one node
to another node and save Dag.
Figure 8. Manage DAG (Cont.) 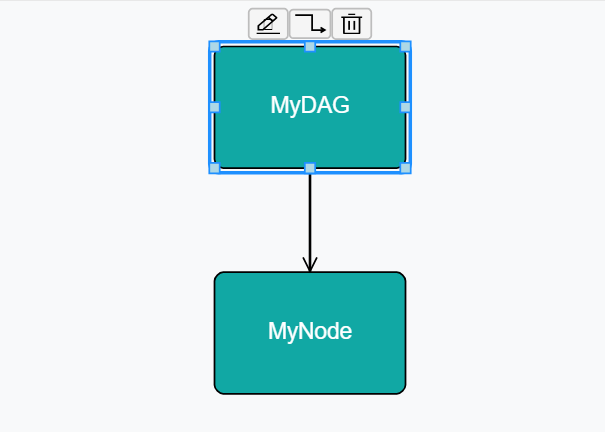
- Change in mapping – if a node is already mapped to another node and to make changes, first need to delete the mapping link from the node and mapped the node from the any node by dragging the mapping link and save Dag.
- Delete a Dag/Node- A node can be deleted by clicking delete icons that appear on the node and save Dag.
- Deleting a Node having no child or parent node- A node can be deleted by clicking delete
icon appear on Node and save Dag.
Figure 9. Manage DAG (Cont.) 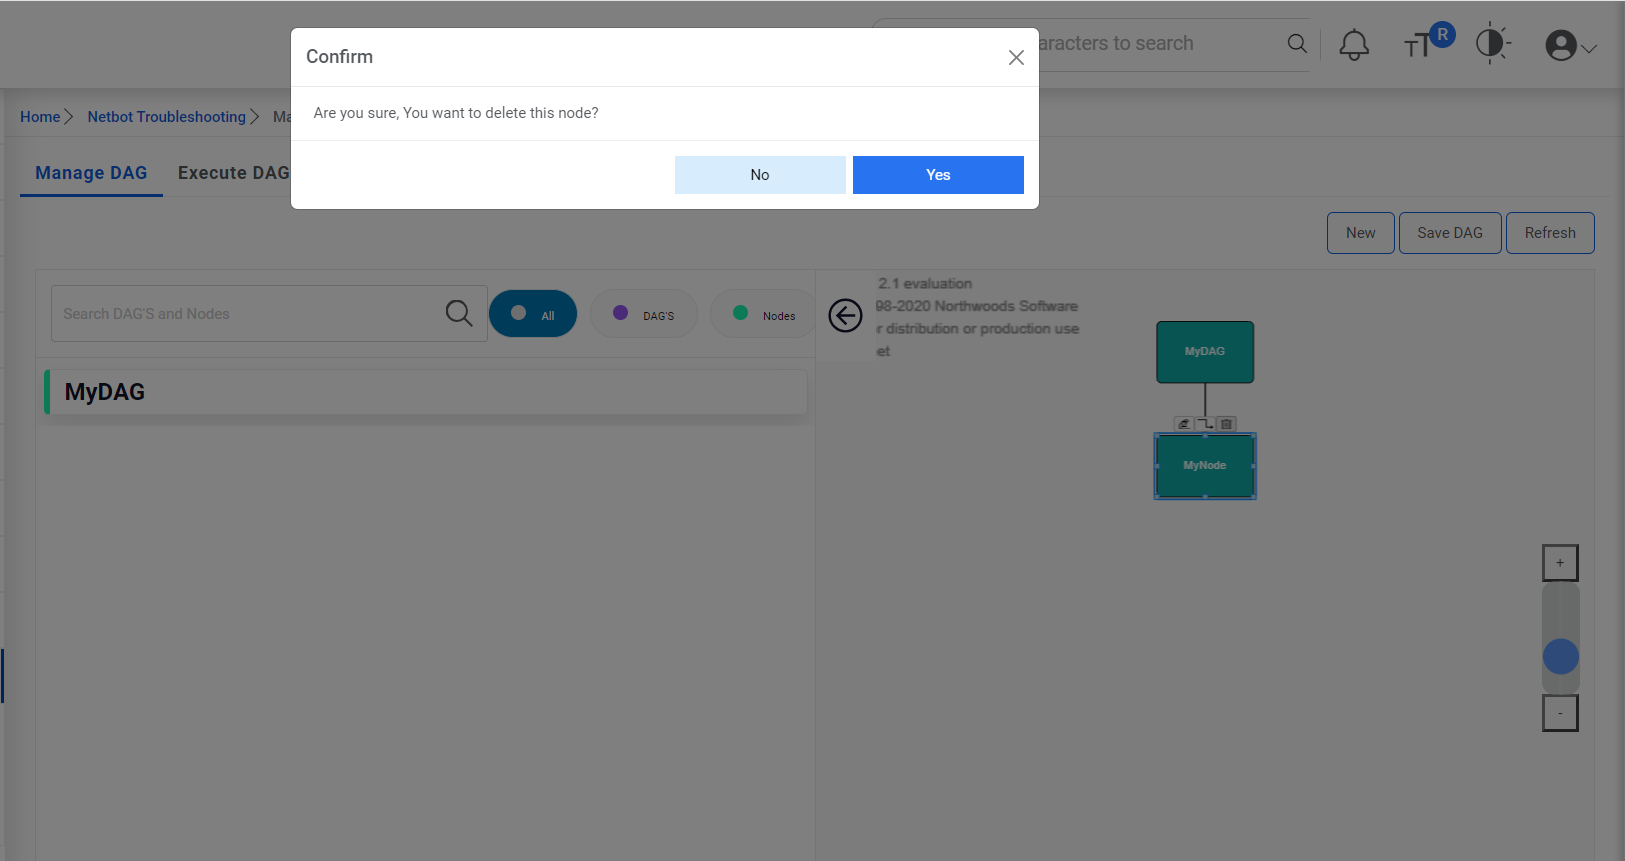
-
Search (Dag/Nodes)- Dag/Node can be search by entering text, Clicking Dag or
Nodes.
Figure 10. Manage DAG (Cont.) 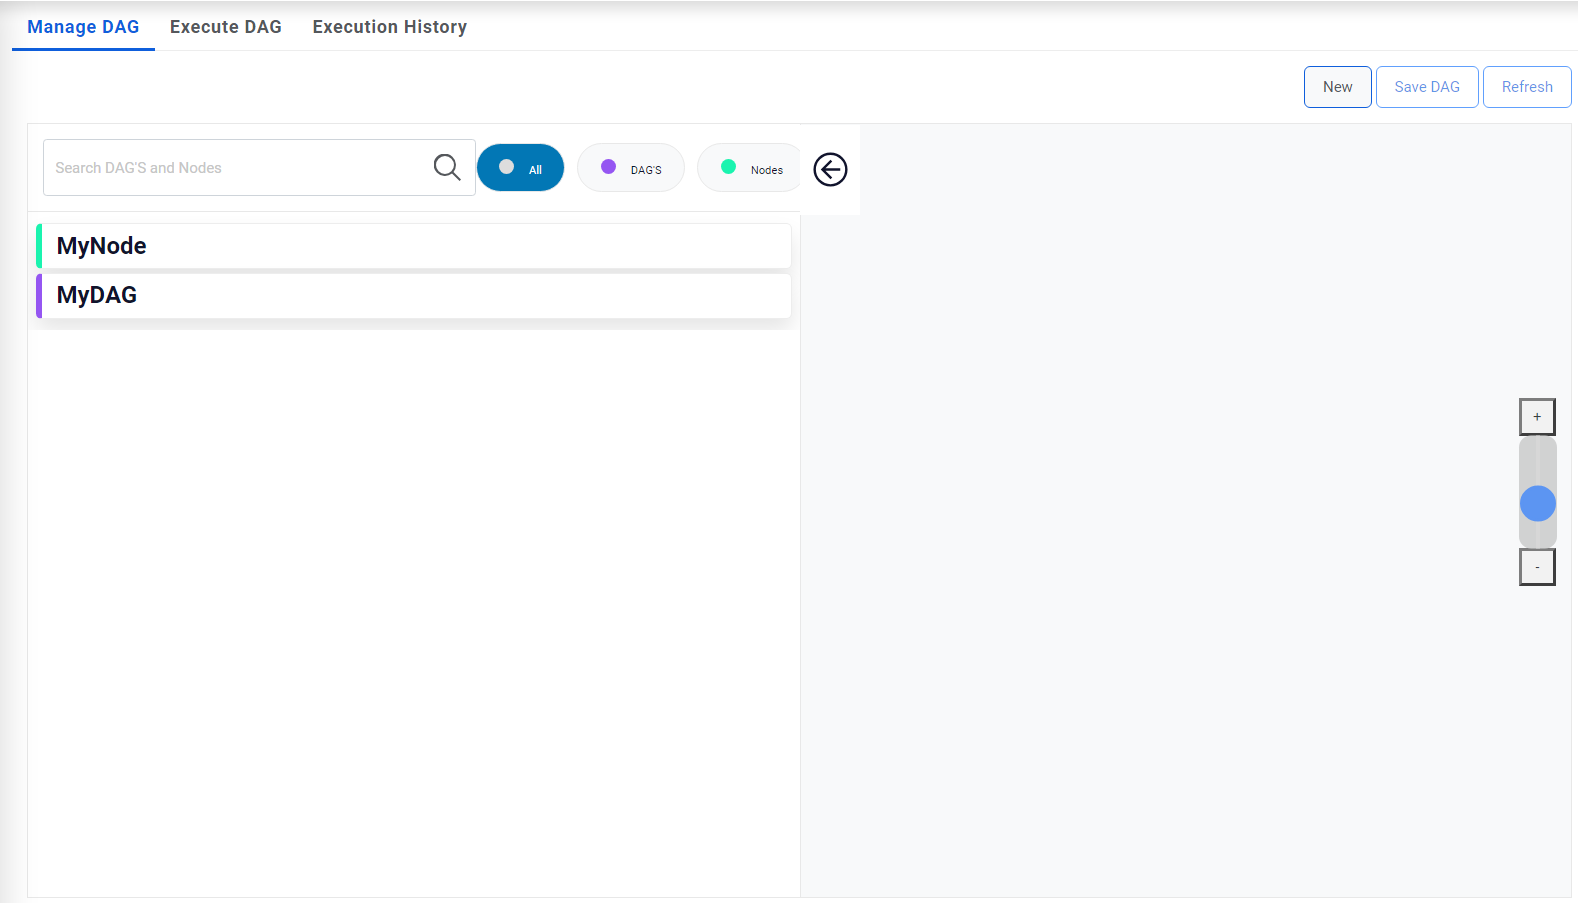
Execute DAG
- To execute a DAG/Node and see the live progress for devices after the execution.
-
To see the Most recent execution status for a DAG/Node
- Standalone having information only can’t be executed.
-
A Dag/Node having all the information type of node can’t be executed.
-
Execute Node mean – only selected node will be executed if it is script type node.
-
Execute DAG- Selected node and its child will be executed (at least on script type node should be there under the selected Node).
- If node contains script, then actual color (green/red/yellow) will be displayed.
-
If node contains information and doesn't have any children, then it will be grey.
-
If node contains information and has a child, then color will be light version of child node (red/green/yellow) having script.
Execution Steps:
- User can navigate to Execute DAG by Netbot Troubleshooting> Execute DAG.
- A DAG or node can be executed by filtering its name under the DAG’S Tab.
Figure 11. Execute DAG 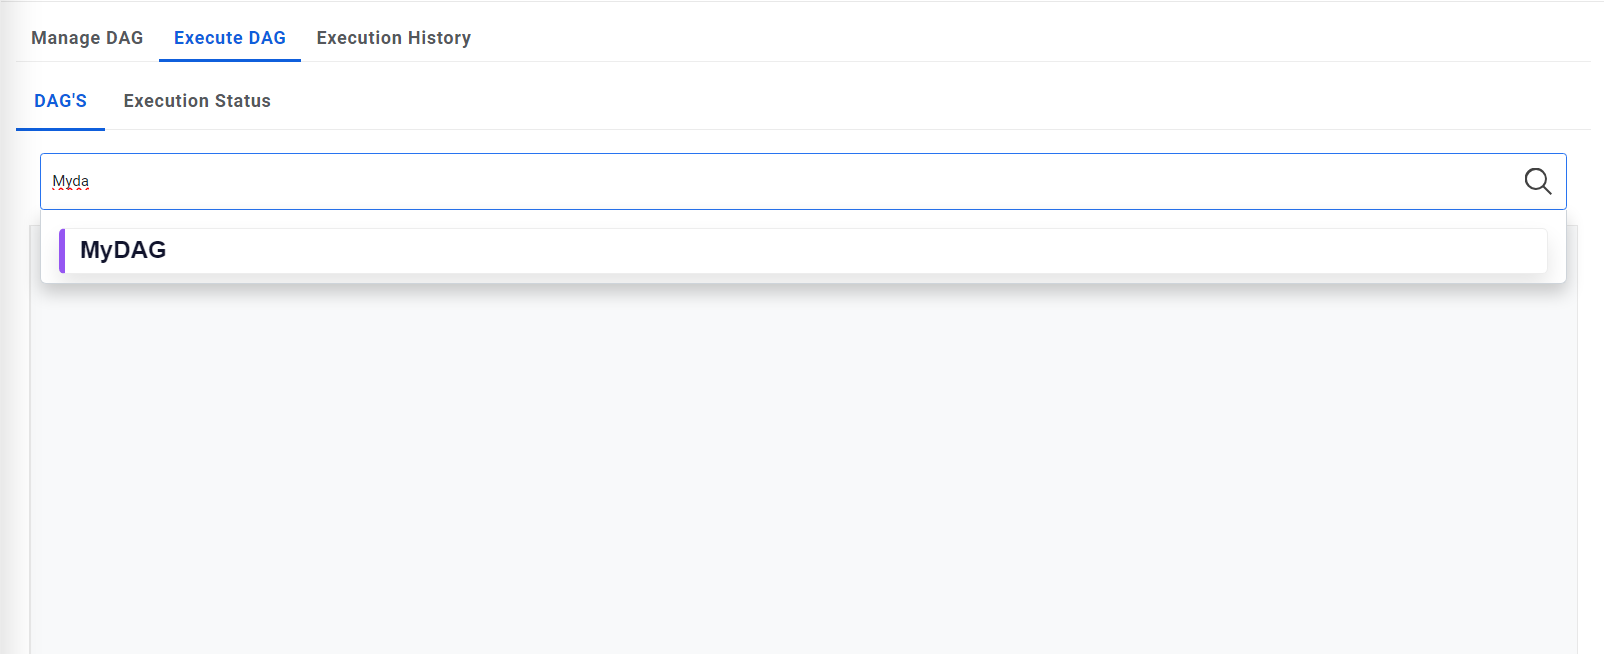
- Selecting a node, related diagram will appear and selecting a node its information will
appear the sliding property window and union all the paraments will appear as screenshot
below.
Figure 12. Execute DAG (Cont.) 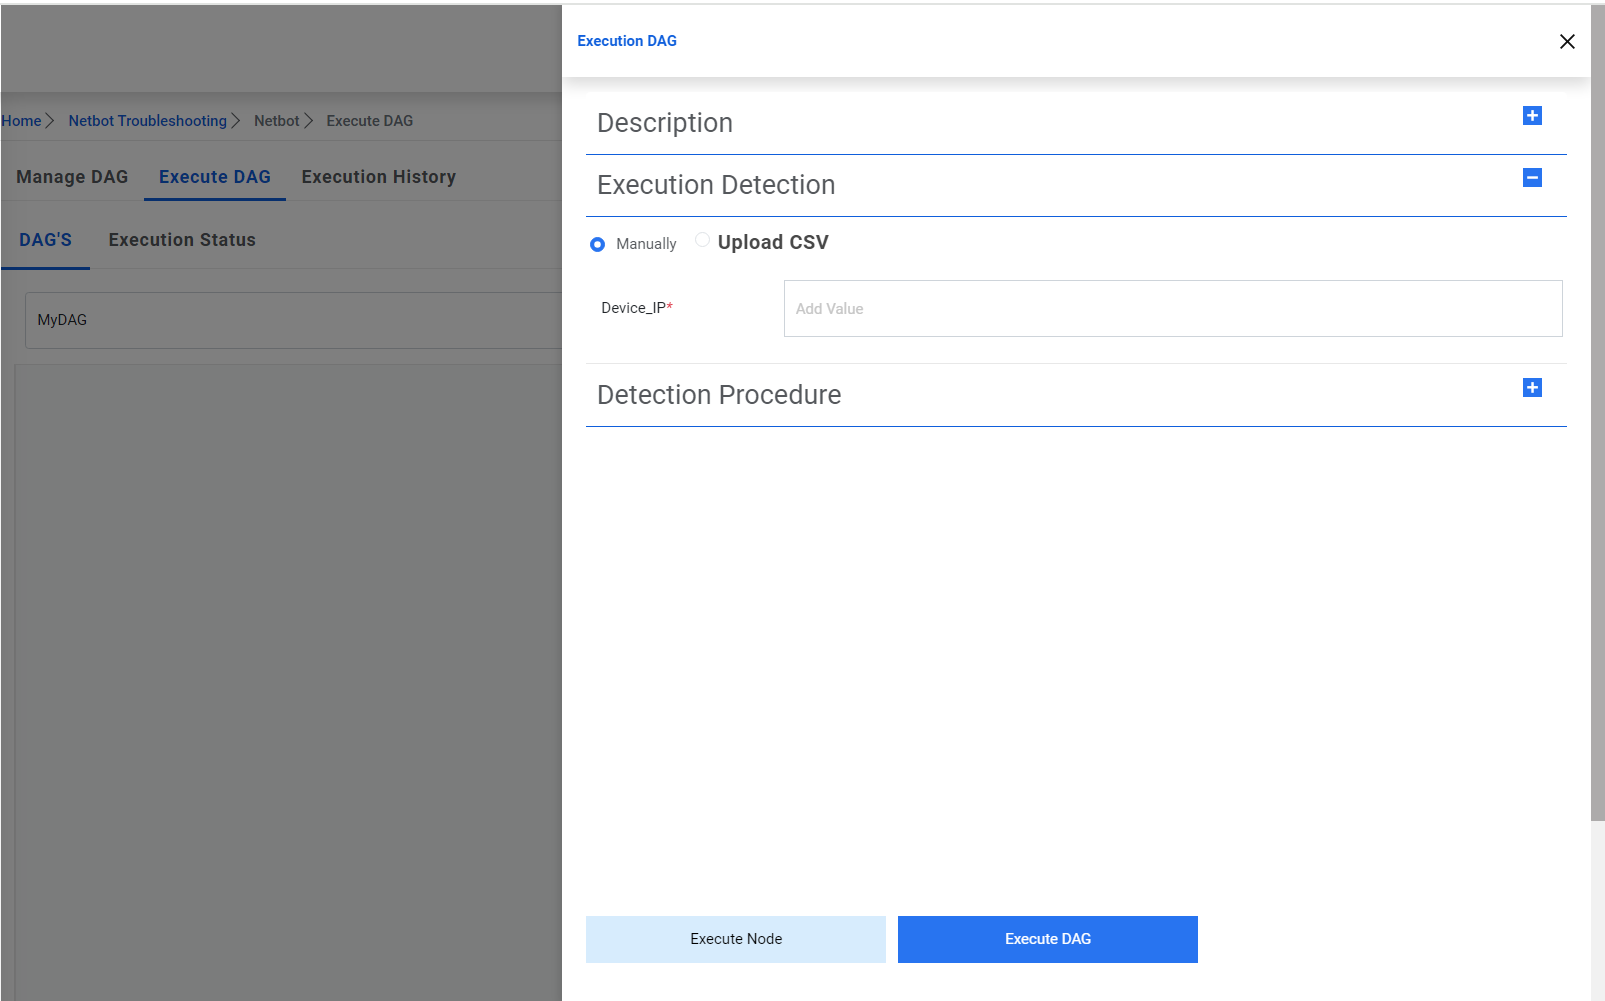
- Enter Device IP and other parameters (if required).
- User will prompt “Execution Initiated” and should redirect to Execution Status tab.
Figure 13. Execute DAG (Cont.) 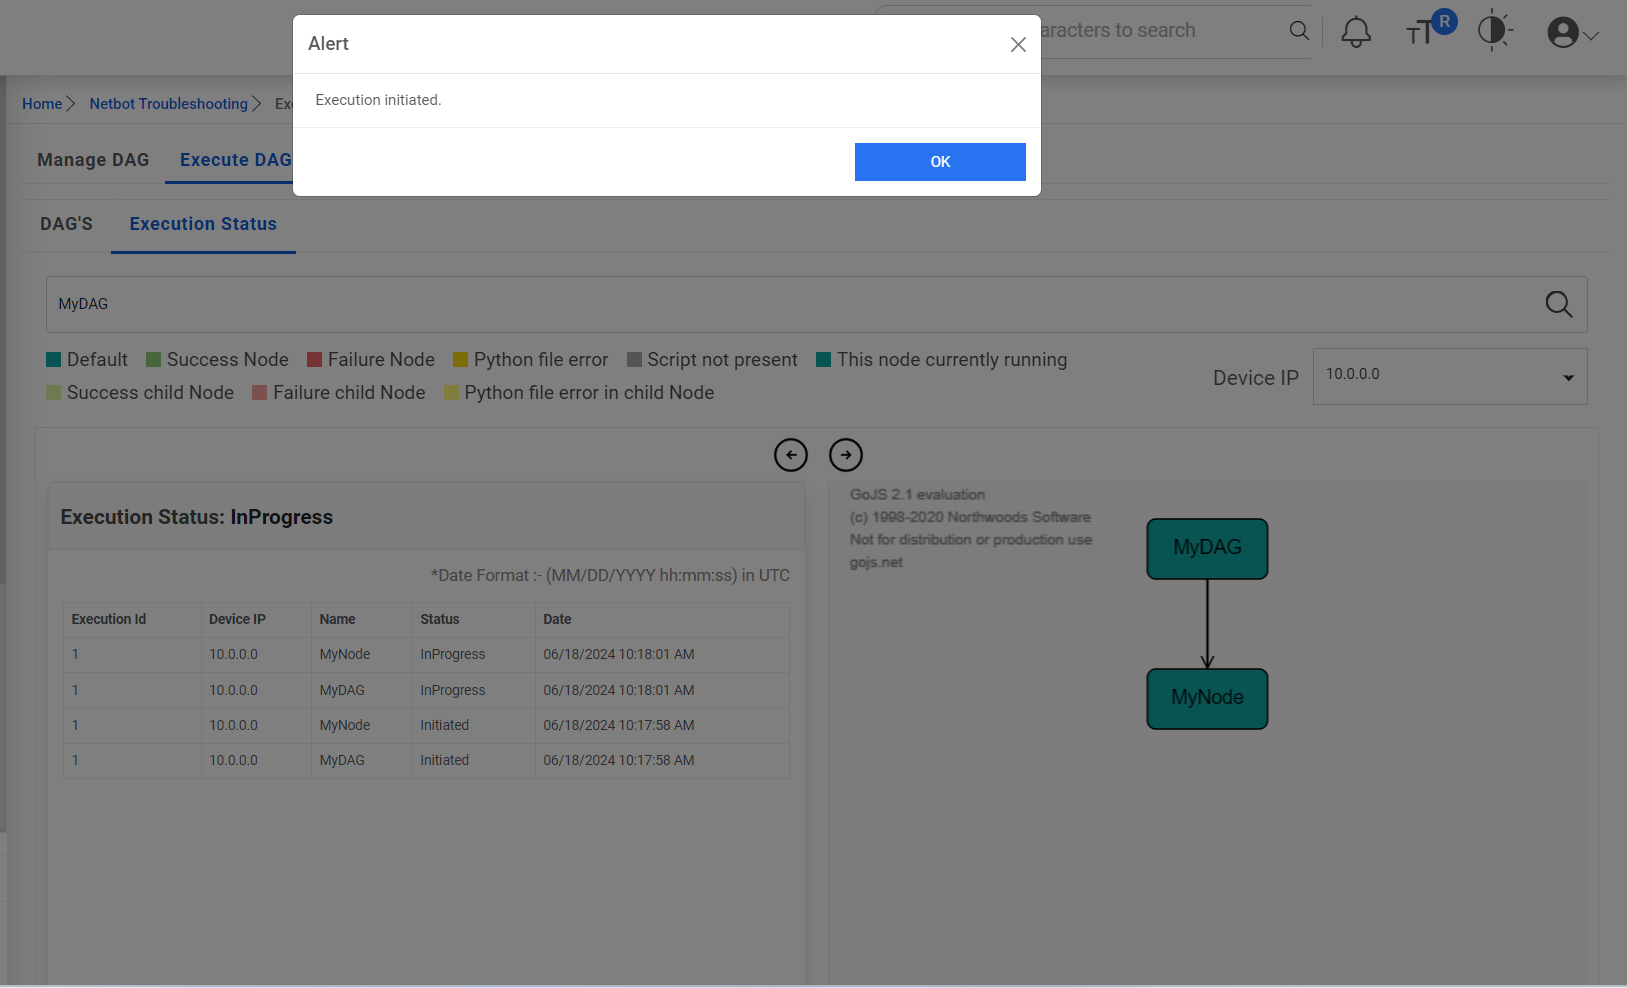
- Enter Device IP should populate in the DAG IP dropdown list and Dag/Node (diagram) should appear in right panel and related execution status should appear in left panel.
- Over the period, there should be additional status log and node color should turn as per
final execution of Node as screenshot below.
Figure 14. Execute DAG (Cont.) 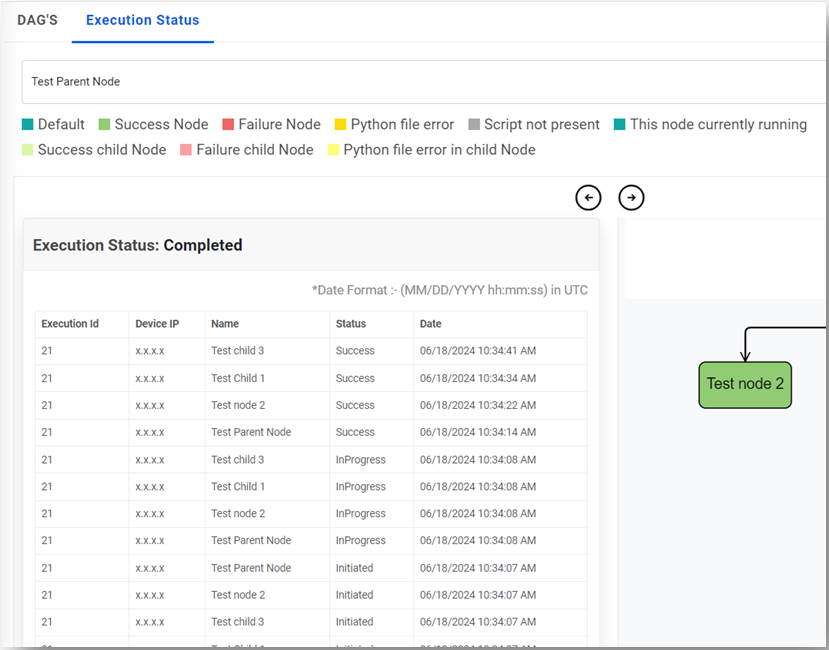
- There is 2 different ways to execute a DAG/Node- one is “Manually” wherein user enter Device_IP onscreen input box, and another one is by “Upload CSV” using download csv template and upload the same after filling the parameter values.
- After execution, all the device_IPs should appear in Dag IP dropdownlist with very first device IP in uploaded csv will appear in the Dag IP dropdown list and related Execution status will appear in the panel below.
- Users can select the different Device IP from Dag IP dropdown list and see the status.
- To see the most recent execution status of any executed Dag/Node, user can navigate to Execute Status tab and search the Dag/Node in the search filter and can see the result for all the devices executed is most recent execution.
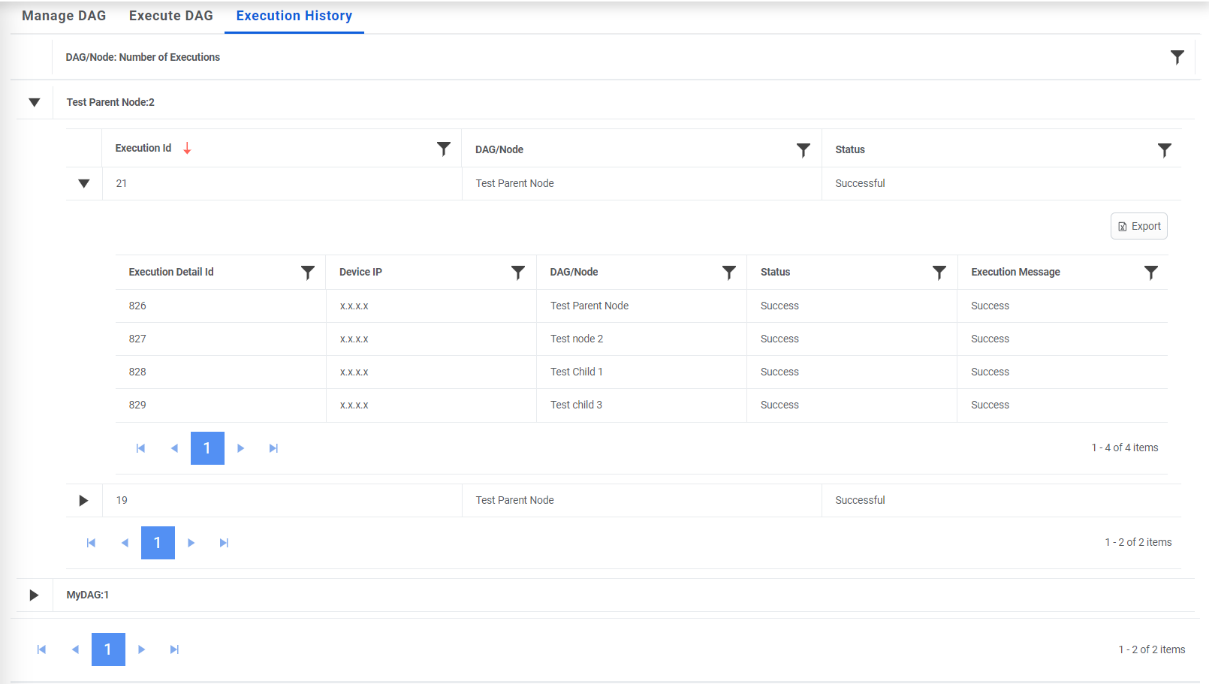
Execution History
This feature allows users to see the historical execution status of a DAG/Node. Here one can filter a DAG/Node and see all the execution that happened in the past.
- To view execution history, on main menu bar, click on Netbot Troubleshooting🡪 Execution History
- Expand the DAG to view the history of any execution Id. User can also download the logs
by clicking on Export button.
Figure 15. Execution History