Out of Memory types
Understanding Out of Memory (OOM)
An Out of Memory (OOM) error should automatically generate a java core and heapdump when it occurs. These and the verbose GC logs should be analyzed to identify the type of OOM error you are encountering. OOM errors happen in different flavors, so you must start by recognizing the kind you are encountering. Below are the listed types of OOM error that can occur, along with the information on how to identify each type.
- Heap Out of Memory
- There are also a couple of different flavors of Heap OOM error that can occur from configuration, tuning, and leaks. A heap OOM error, as the name implies, is a situation where there is not enough storage or space in the JVM (Java Virtual Machine) heap to satisfy the request of an application when it needs it. The following list describes each type of JVM Heap error.
- Leaks
- The word leak can sometimes be misleading because it is only sometimes going
to be a leak in the general sense. Granted, you will see everything reported
in MAT as a leak suspect, but leak as an object or set of objects that
continue to grow over time and never get released or recycled through the
garbage collection process. Sometimes, a thread performs some action that
causes you to cause an OOM error. You can identify each type by looking at
the verbose GC logs.
Start by using Pattern Modeling and Analysis Tool (PMAT) Community to graph the
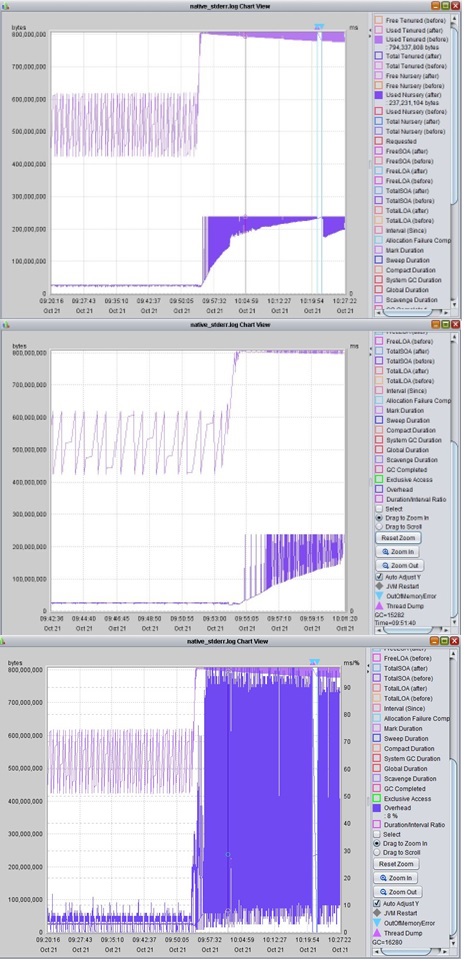
verboseGClog and look for trends. For information on PMAT, refer to, The Tools Needed to Graph the Patterns in your JVM Verbose Garbage Collection Logs in the HCLSupport Community.In the case of a fast leak, you can observe:- The general saw tooth pattern;
- A spike to the maximum capacity of the heap;
- A visual indication of the struggle of the JVM to recover.

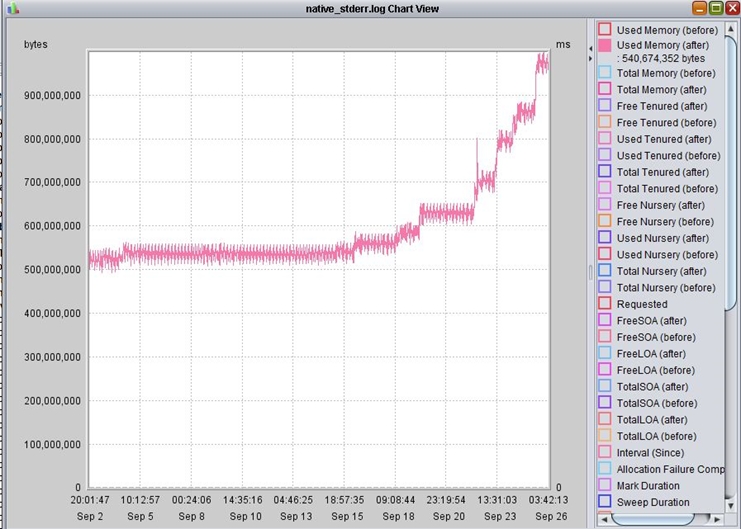
A slow leak will have a slightly different pattern, with a steady increase in memory used over time (multiple days) until eventually getting the OOM error. The following is an example of what it would look like in PMAT. Notice the steady increase of memory used over 20 plus days. As it grows, it never recovers the memory during garbage collection.

- Tuning
- Another type of OOM error that can occur is related to capacity. It is essential to understand that not every OOM error is a leak. It is not a leak if you are running out of memory because you are caching too much. It is a tuning exercise. If there is an OOM error and a leak, you will not increase the heap to resolve this error, because it will eventually hit the heap limit. However, adding additional heap space is okay if it is a tuning issue, like caching too many objects. Usually, the process of fine-tuning cache and heap configuration is done in advance during the planning phase and validated through load tests. One of the more common issues encountered is trying to cache too many objects and needing to leave more space on the heap for other objects. However, to understand if this is a problem, you must review the heapdump or cores taken at the time. If you open a heapdump, for example, and see that 70% plus of the heap was in cache, you would need to look closely at what you are caching and if it is needed. A good resource for sizing and determining the correct cache size can be found in the following post: How big is your Cache? , Key Tuning Configuration: Sizing Cache in the HCLSoftware community.
- Misconfiguration
- Misconfiguration is a tiny portion of the types of OOMs, but it is essential
to note. This type of OOM error can happen when there is not enough space in
the nursery or tenured space, which causes excessive GC activity and,
eventually, an OOM error. The configuration of the nursery can directly
affect the tenured space. For example, if the nursery is set to be too
large, it affects how much space is available for tenured to write objects.
The nursery must be appropriately configured. Having it too large or too
small leads to issues with the critical tuning setting for the nursery size
-Xmn. The default value is 25% of the maximum heap
size, which means the tenured space is 75%. Here are two examples where the
nursery is set to too high and too low. Here are example entries from a
verboseGClog.<af type="nursery" id="8229" timestamp="Dec 18 18:35:39 2013" intervalms="2619.846"> <minimum requested_bytes="16" /> <time exclusiveaccessms="0.154" meanexclusiveaccessms="0.154" threads="0" lastthreadtid="0x000000003489BE00" /> <refs soft="9295" weak="33746" phantom="1717" dynamicSoftReferenceThreshold="8" maxSoftReferenceThreshold="32" /> <nursery freebytes="0" totalbytes="200000000" percent="0" /> <tenured freebytes="1820290728" totalbytes="6979321856" percent="26" > (cont)... </af> <af type="tenured" id="2" timestamp="Dec 14 08:02:09 2013" intervalms="5200781.651"> <minimum requested_bytes="15000000" /> <time exclusiveaccessms="0.150" meanexclusiveaccessms="0.150" threads="0" lastthreadtid="0x0000000032CB6600" /> <refs soft="36012" weak="48498" phantom="1318" dynamicSoftReferenceThreshold="13" maxSoftReferenceThreshold="32" /> <nursery freebytes="355426016" totalbytes="1024000000" percent="36" /> <tenured freebytes="8705208" totalbytes="512000000" percent="1" >In the first entry, you can see that it is requesting to allocate a 16-byte object to the nursery, but the available free bytes are 0. By having a relatively small nursery setting, you can encounter performance issues from the overhead of frequent garbage collections and potentially an OOM error. The more common issue is when the nursery is set to too high, which leaves less space for tenure. The example above shows that the second entry requests a 15 MB object to be allocated to the tenured space. The total heap size is 1.5 GB, but the nursery is set to 1024 MB, which only leaves 512 for the tenured. So when objects are trying to be moved from nursery to tenured, it will fail and likely log an OOM error. With a small tenured space, the JVM can struggle, leading to performance and memory problems.
- Native Out of Memory
- Native OOM error is not the same as a heap OOM error. The heap is a Java
concept and is contained inside the Java process. It is also possible for
Java to run out of memory outside the JVM process. If no memory is available
for native code allocation or threads, then a Native OOM error can occur.
You might find the following entries in the data collected:
-
- Systemout.log
-
JVMDBG001: malloc failed to allocate …
"Failed to fork OS thread", or "cannot create anymore threads".
-
- Native_stderr.log
-
**Out of memory, aborting**
*** panic: JVMCL052: Cannot allocate memory in initializeHeap for heap segment
This application has requested the Runtime to terminate it in an unusual way.... JVMDG215: Dump Handler has Processed Error Signal 22.
-
- Javacore
-
0SECTION TITLE subcomponent dump routine
NULL ===============================
1TISIGINFO Dump Event "systhrow" (00040000) Detail "java/lang/OutOfMemoryError":
"Failed to create a thread: retVal -1073741830, errno 11" received
Finding the users of native memory can be a lengthy process, as there is no way of knowing which code allocated the native memory. There are no comparable heapdumps for native memory, but the following technote is a good place to start Troubleshooting Native OOM. in the IBM support notes.
-