Report Performance
To provide a responsive user experience and to reduce the load on the UI docker container and the client browser when viewing reports that contain large amounts of data, import processing can perform a pre-processing step automatically, for specific supported reports, at the end of any action that may result in changed repository database contents.
Once the product administrator has enabled the report pre-processing feature, any subsequent repository updates using any of the available repository utilities, import or Aggregator executions, will automatically perform any related report pre-processing actions on supported reports. To ensure all supported reports are loaded for pre-processing with current data after the Administrator activates the pre-processing feature, an Aggregator execution should be performed on each repository currently loaded with data.
Actions, such as importing usage detail data with usage period data or importing large amounts of usage period data into a repository, can result in very large amounts of DASD storage being required for pre-processed report database storage.
Depending upon how much data is resident in the repository database, this step may take a few seconds to complete through to a number of minutes. The reports that are available for use as pre-processed reports, their status and data load information are available in the Admin report Preprocessed Reports Summary. Each report that is available for each category is shown with a support status and a loaded data status. Not all reports are supported for use with pre-processing.
If you tend to load IQ data separately from usage period data, you may notice that a number of supported pre-processed reports are not loaded with data. As some reports require usage data, these will be unavailable until usage data is loaded into the repository.
Pre-processing, when activated by an administrator, can provide a more responsive report viewing time for large repositories compared to a report that is loaded directly from the repository database. By eliminating a lot of the real-time data analysis that is performed on the repository data directly as it is being viewed, a pre-processed report can load faster and be more responsive when paging backward or forwards through the data interactively.
The trade-off here is that in exchange for reduced immediate CPU, memory requirements, and a more responsive browser experience, more DASD storage is required to store the pre-processed reports that will be ready for viewing when required. The Usage Monitor File Detail report is one such report that can significantly increase DASD storage requirements if large amounts of usage detail data is loaded during usage import processing (selected when initiating import processing ).
Should DASD usage become too excessive, the administrator can deactivate the pre-processing support. To return the used pre-processing DASD back to the system for use, an aggregator execution on each of the affected repositories needs to be run after pre-processing deactivation is performed. Once this is completed, the database DASD consumed for pre-processing will be returned to the host system. However, report viewing performance may be degraded.
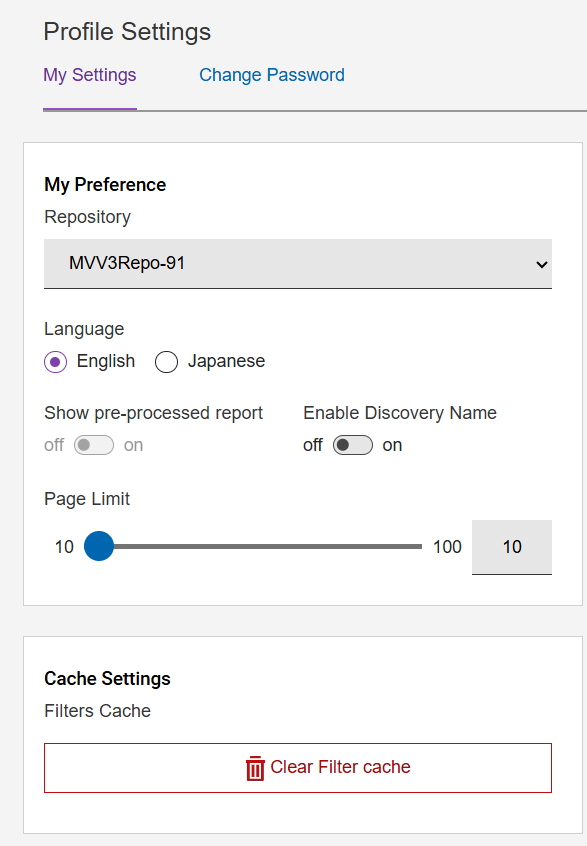
If pre-processed reports have been enabled by your product administrator and you select a pre-processed report to view with loaded data, but the data is still not viewed using the pre-processed database (the lightning bolt icon is absent), ensure your account profile has the Show from Pre-processed report option set to On. If the lightning bolt icon on the shown report is red, this indicates a loading issue, and hovering the mouse pointer over the red icon will show information on the cause.
If the lightning icon changes to a red outline, this indicates the report is eligible for pre-processing and this feature is enabled, but the data loading process has either not completed or failed to complete successfully. You can hover your mouse pointer over the thunderbolt icon to see details on the pre-processing status.