Chart View
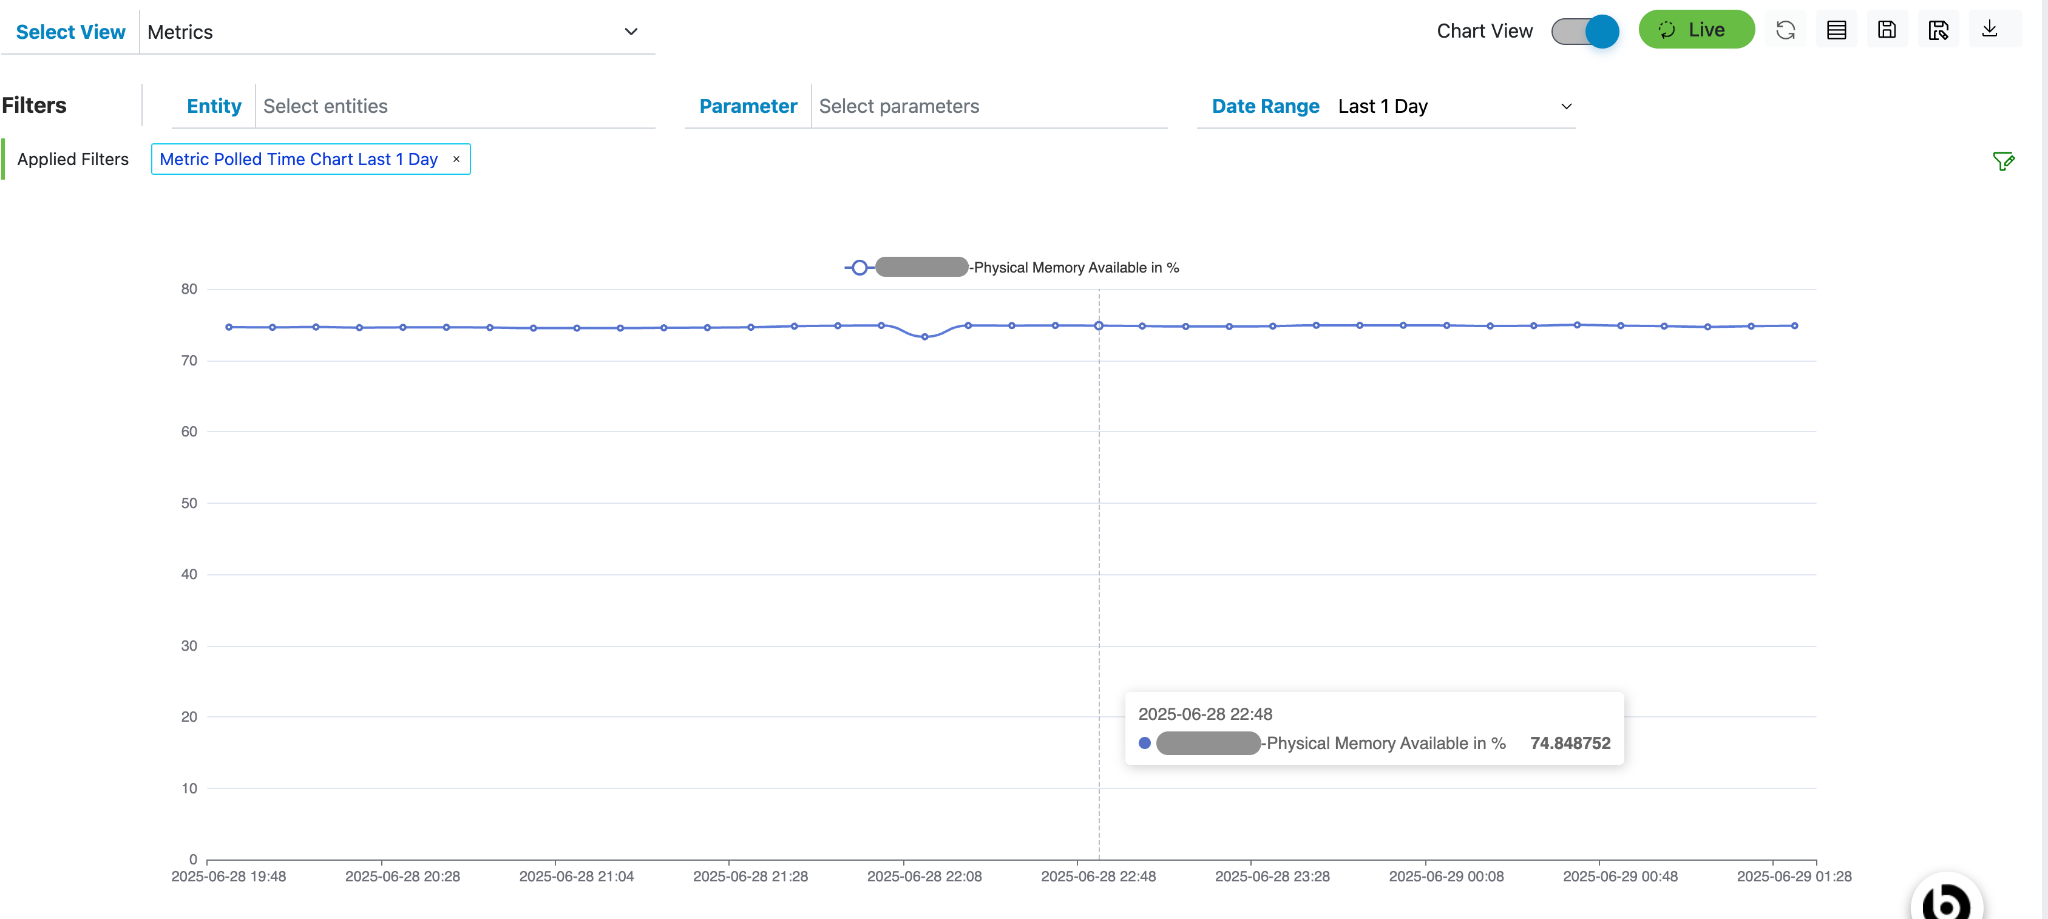
The Chart View allows users to visualize metric data values for a specific combination of entity and parameter, plotted against time.
The time range displayed on the chart corresponds to the date range selected by the user in the Date Range filter.
This view helps users analyze trends and patterns in metric data over a specified period, making it easier to identify anomalies or performance changes.
- To view char view, click on the toggle button in the bar above Grid next to text
“Grid View”.
Figure 1. Grid view Toggle button. 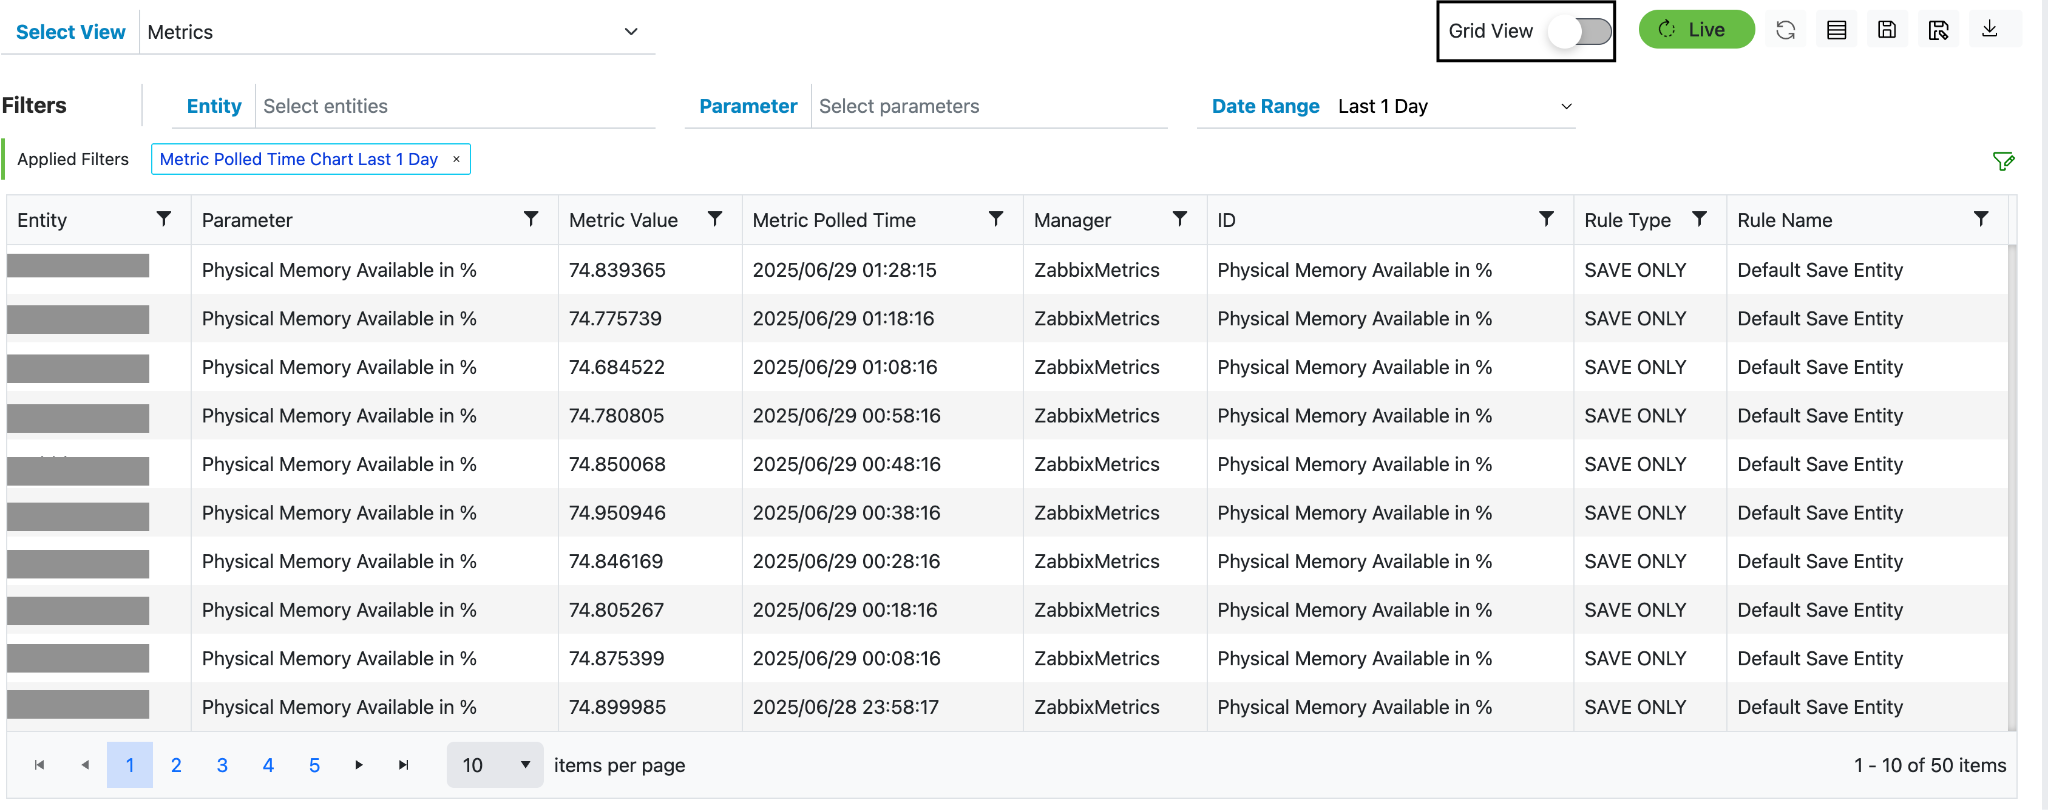
- If there is no metric data available for the default time range (e.g., Last 1 Hour), you can change the Date Range using the dropdown filter.
- As shown in the image below, selecting "Last 1 Day" provided metric data, which is then
displayed in the chart.
Figure 2. Chart View 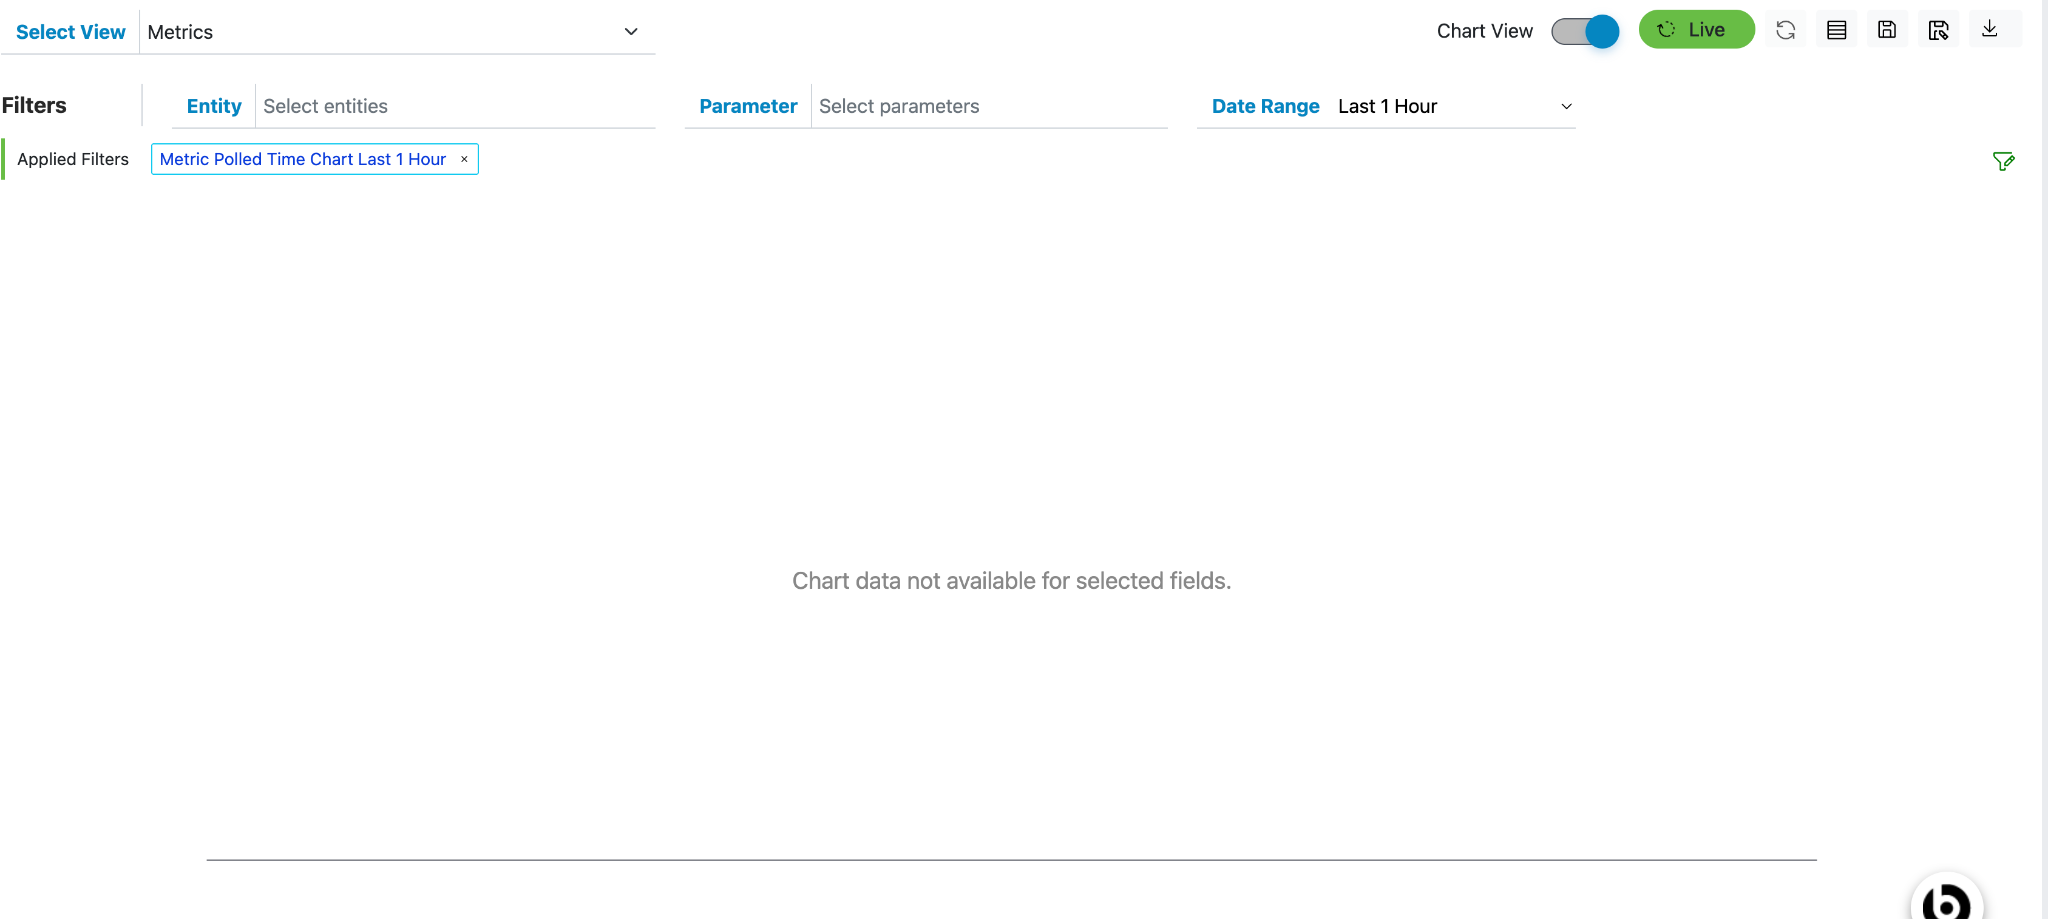
Figure 3. Date Range 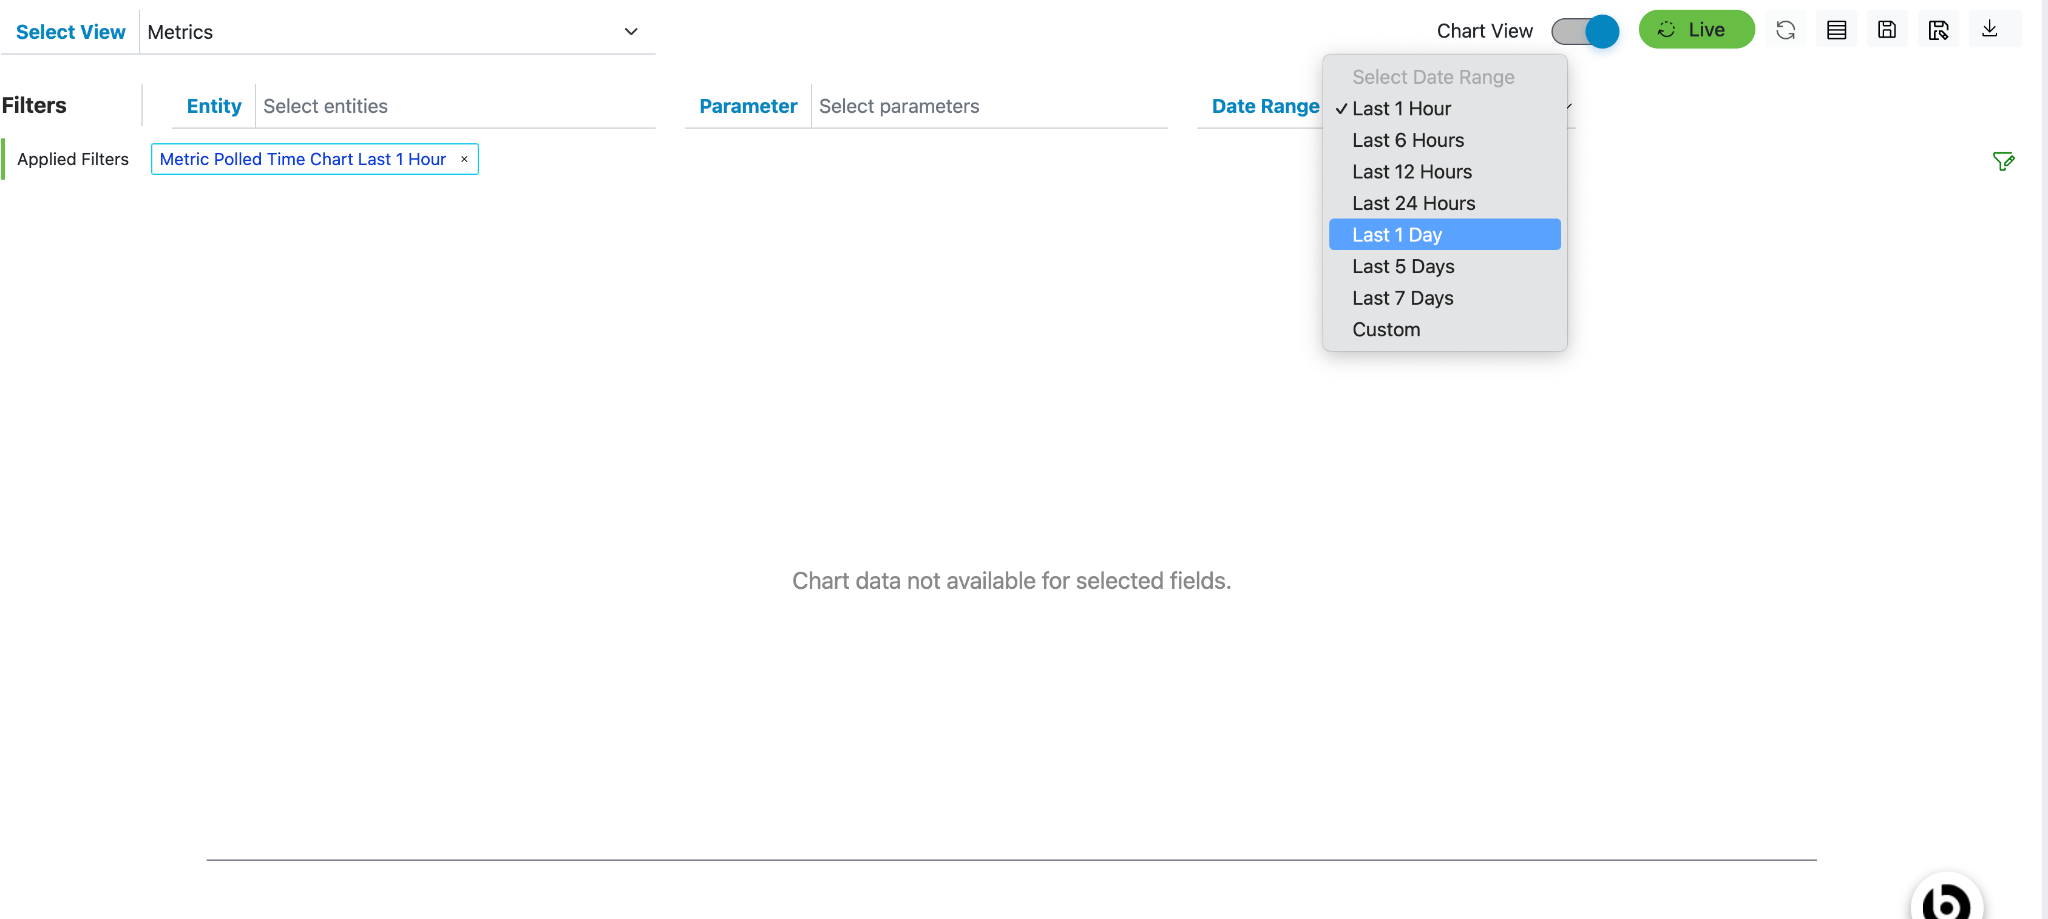
Figure 4. Chart View