Summary View
Provides a high-level summary of the analysis
- Ticket Types (Unique Clusters) – Distinct number of ticket categories identified based on the nature of tickets from the overall ticket dataset uploaded.
- Runbooks Available – Ticket categories for which the runbooks are available based on system driven recommendations.
- Knowledge Base Available – Number of Knowledge Articles, sourced from various web-based datasets, available for reference by end users.
- Scripts Available – Number of scripts available for use, to create automation, which are not available in the out-of-the box runbook repository.
- No Content Available – Number of ticket categories for which no runbooks, KB articles or scripts are available.
-
Invalid Ticket Description – Number of ticket categories which has not enough
information for system to understand for processing.
Figure 1. SaaS based Ticket Analysis – Summary View 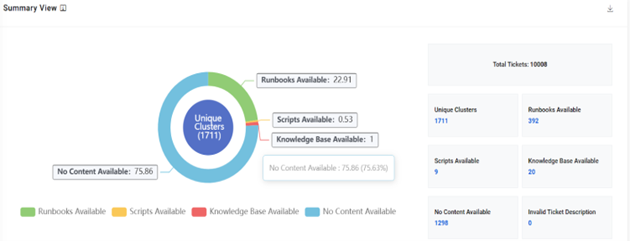
-
Top 10 Ticket Types - Provides a view of the top 10 unique ticket categories sorted
by count and is indicative of the most voluminous issues in the environment.
Figure 2. SaaS based Ticket Analysis – Top 10 Ticket Types (Chart View) 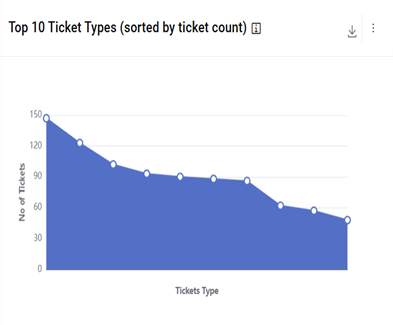
Figure 3. SaaS based Ticket Analysis – Top 10 Ticket Types (Tabular View) 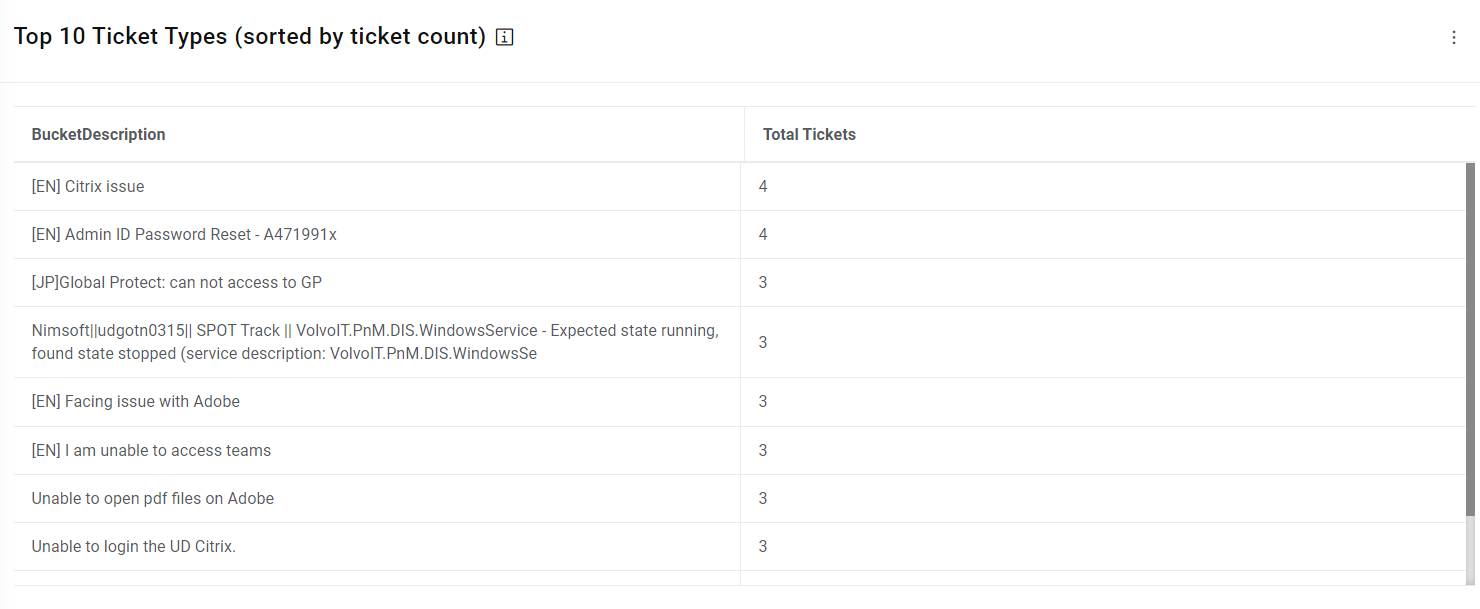
-
Top 10 Ticket Types with Automation Content Available (sorted by ticket count) –
Provides a view of the top 10 unique ticket categories sorted by count for which automations
are available within iAutomate. It also presents a view of available runbooks, scripts, and
documents / knowledge articles.
Figure 4. SaaS based Ticket Analysis – Top 10 Ticket Types with Automation Content Available 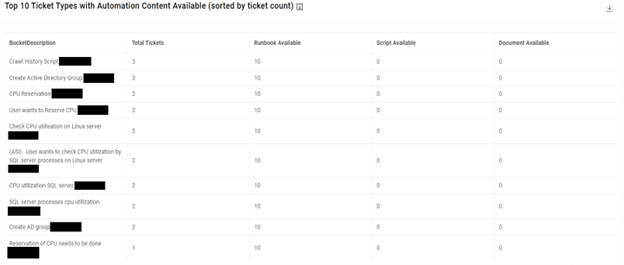
-
Top 10 Ticket Types with No Content Available (sorted by Ticket Count) – Provides a
view of the top 10 unique ticket categories sorted by count for which automations are not
available within iAutomate.
Figure 5. SaaS based Ticket Analysis – Top 10 Ticket Types with No Content Available (Chart View) 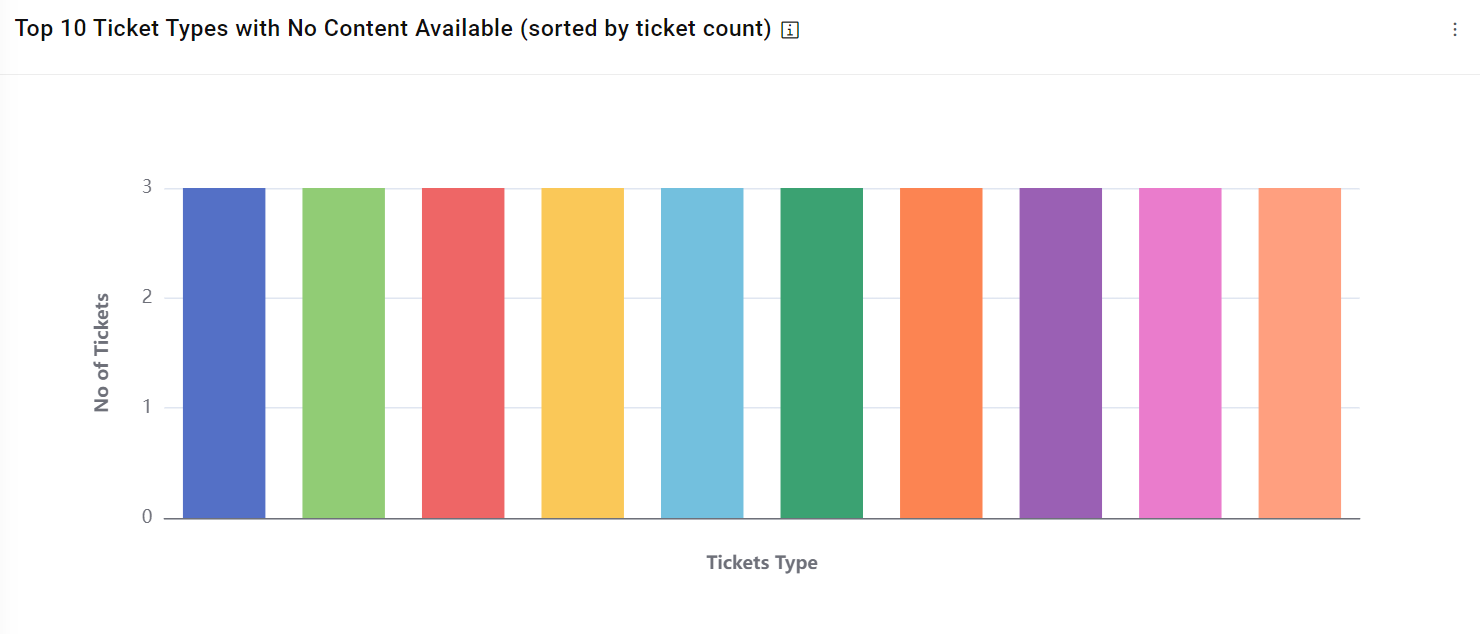
Figure 6. SaaS based Ticket Analysis – Top 10 Ticket Types with No Content Available (Tabular View) 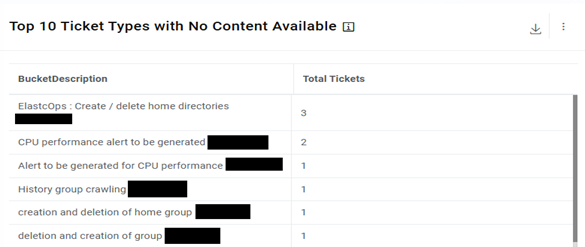
-
Tiles View Dashboard – This widget highlights the top unique tickets which are
automatable in nature (considering similarity score > 60), the recommended runbook and
the potential effort savings which can be achieved through their automated remediation.
Figure 7. Tiles View Dashboard 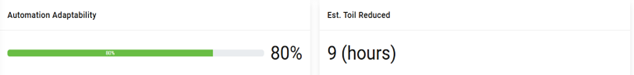
Figure 8. Tiles View Dashboard (Cont.) 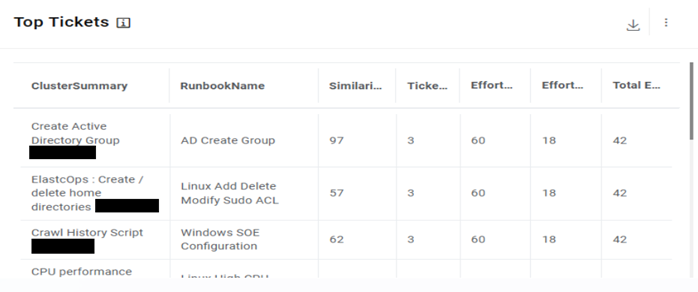
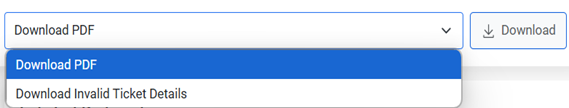
- Click Download PDF to download the pdf report or click Download CSV to
download the CSV file with the detailed ticket analysis which can be used to arrive at the
automation percentage. Note:
In the PDF file, all the ticket variations with Similarity score greater than 0.6 can be considered as potential automation candidates.
Figure 9. SaaS based Ticket Analysis – Download Report 
- Feedback
To provide the feedback on the recommendations obtained for an analysis, click on
.png) corresponding to the
analysis, it will take you to Feedback Menu. The feedback feature is to enhance the
recommendation results where SME can provide his feedback on whether the correct
recommendation is received for a cluster and if not then he can vote for the right
runbook for that cluster.Note:
corresponding to the
analysis, it will take you to Feedback Menu. The feedback feature is to enhance the
recommendation results where SME can provide his feedback on whether the correct
recommendation is received for a cluster and if not then he can vote for the right
runbook for that cluster.Note:The feedback option is only available if the logged in user belongs to SAAS-SME group. To map users to SAAS-SME group, login with super admin and on Group Management page, Add User to SAAS-SME group.
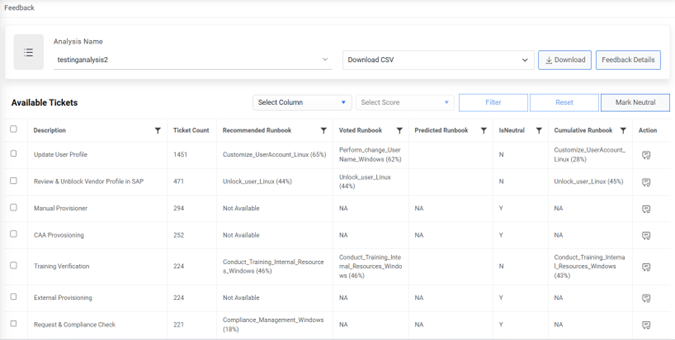
The feedback page opens as below:
Figure 10. SaaS based Ticket Analysis – Feedback 
- There are 3 kinds of runbook columns available in the grid:
-
Recommended Runbook: The runbook recommended by the recommendation engine.
-
Voted Runbook: The runbook voted by SME, in case the runbook recommended by the recommendation engine is not accurate.
-
Predicted Runbook: The runbook which is predicted by the feedback model out of the top recommended runbooks once the feedback model is built with sufficient data based on the votes provided by SME earlier.
- For any description, if the recommended runbook is not accurate as per SME, then he
can vote for the correct one for the same. For that, click on
 corresponding to a description. The
slide opens as shown below:
corresponding to a description. The
slide opens as shown below:
Figure 11. SaaS based Ticket Analysis – Ticket Feedback 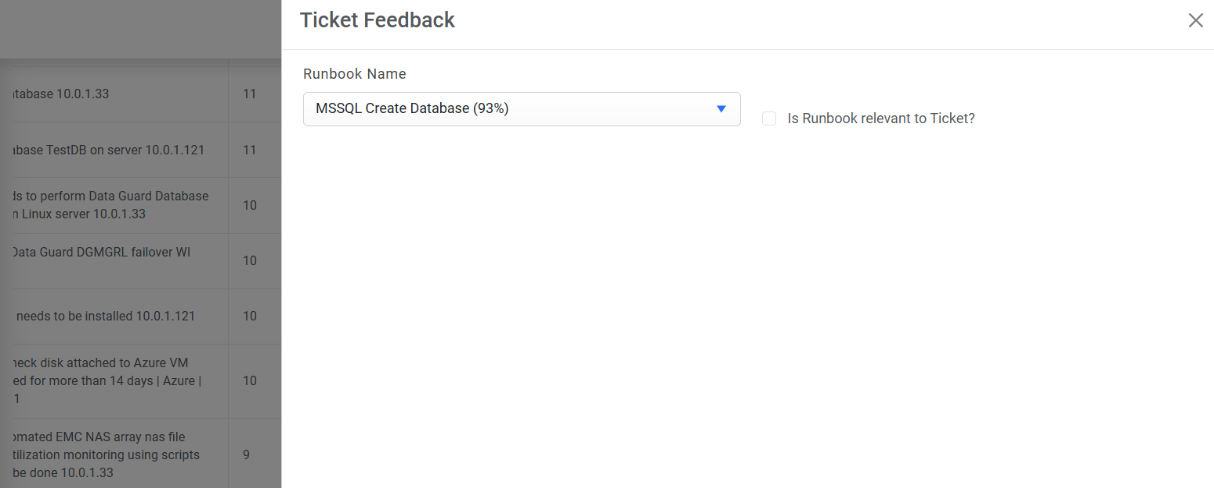
- The SME will select the runbook that he finds suitable for the description and checks ‘Is Runbook relevant to Ticket?’ checkbox. It will then open a Runbook Feedback Questionnaire.
Figure 12. SaaS based Ticket Analysis – Runbook Feedback Questionnaire 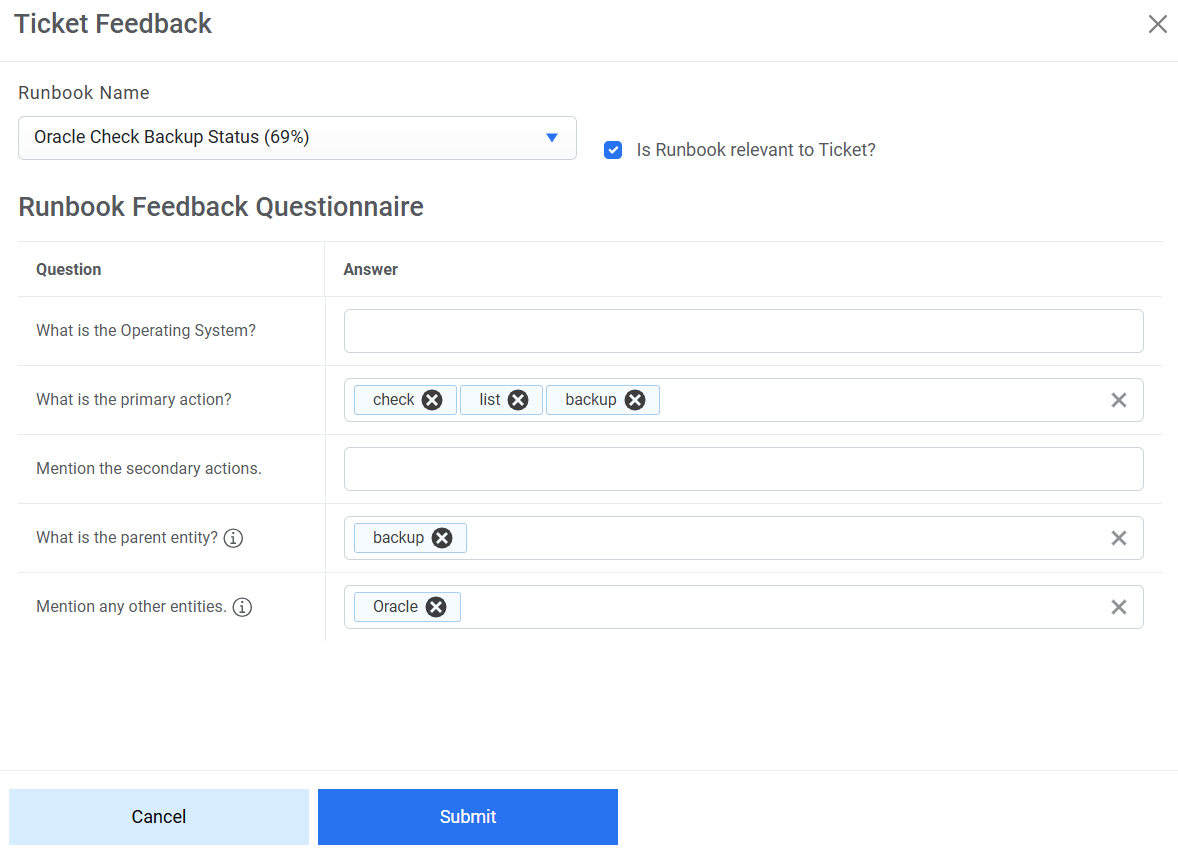
- The SME will provide answers to this questionnaire and click Submit.
Figure 13. SaaS based Ticket Analysis – Runbook Feedback Questionnaire Submitted 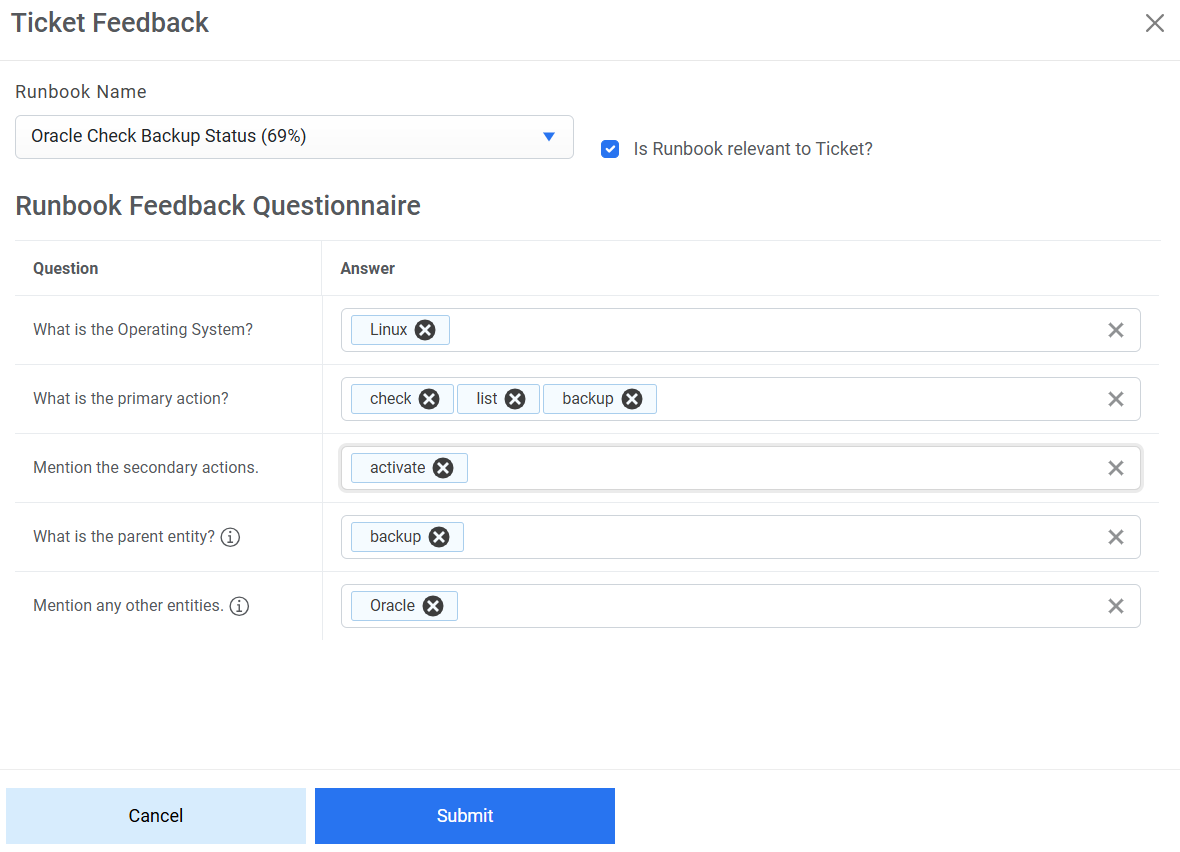
- The runbook voted by SME will now be visible under ‘Voted Runbook’ column in the grid.
Figure 14. SaaS based Ticket Analysis – List of Voted Runbook 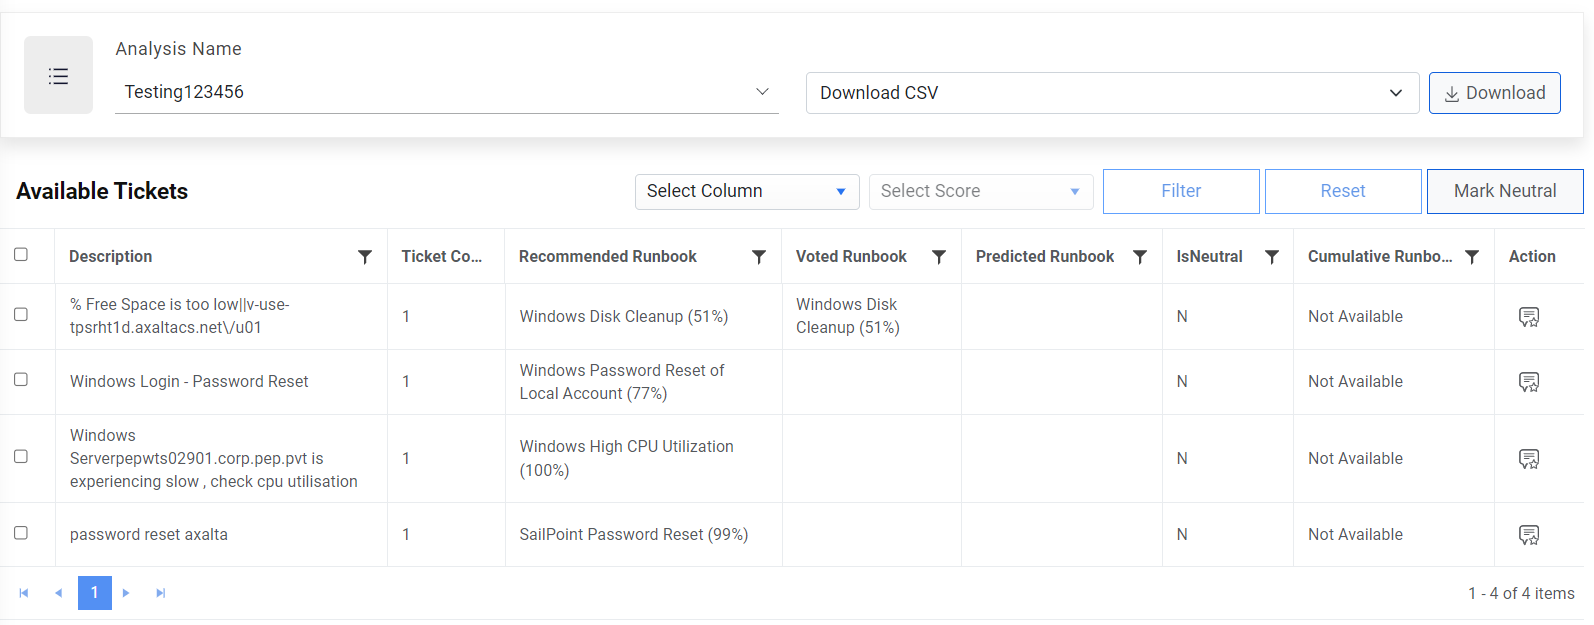
-
Once sufficient feedback is received, the user can login with super admin credentials and navigate to build models screen and build the Feedback Model to obtain values under ‘Predicted Runbook’ column.
Once the feedback model is built successfully with sufficient data, then user can see the data under predicted runbook. The predicted runbook is the outcome of feedback model where SME has given sufficient feedback in the environment and based on that feedback the model has predicted a runbook.
For all those descriptions which are not valid and the recommendations on those tickets are invalid as well and we don’t have the valid recommendation for such descriptions in our system, we can mark those descriptions as Neutral.
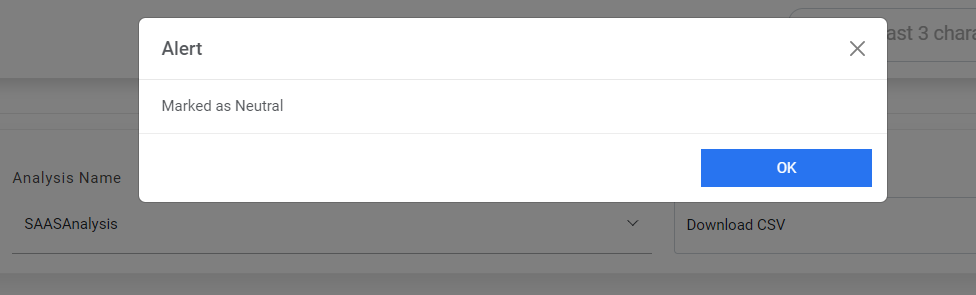
- To mark one or more descriptions as neutral, check all those descriptions and click on ‘Mark Neutral'. An alert will be generated:
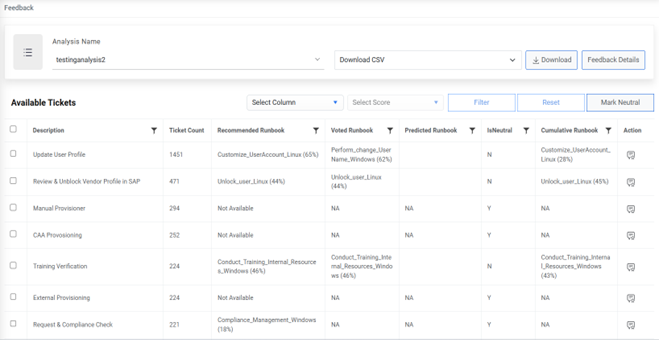
- For the description(s) that has been marked as neutral, the voted and predicted runbook columns become NA and IsNeutral column will now display Y.
- If, in future, if the SME feels that either the description has been wrongly marked as neutral or we might now have valid recommendation in our system later, we can again provide feedback on such descriptions.
To provide feedback on the descriptions that have been marked as
neutral, click on  corresponding to
that description and perform the steps to provide feedback. The
description will now be marked IsNeutral as
‘N’ and now Voted Runbook will be
visible corresponding to this.
corresponding to
that description and perform the steps to provide feedback. The
description will now be marked IsNeutral as
‘N’ and now Voted Runbook will be
visible corresponding to this.
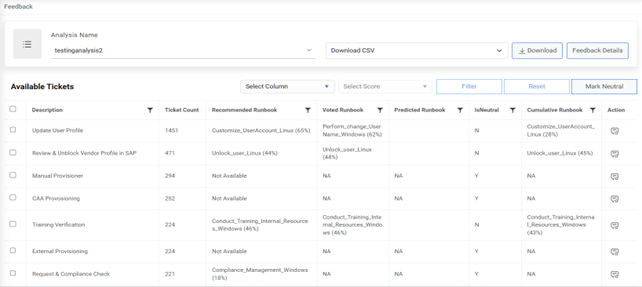
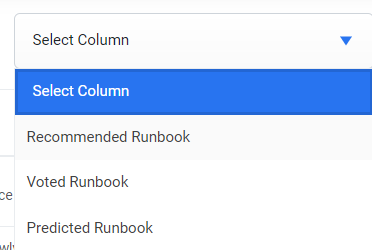
The data on the feedback screen can also be filtered based on ‘Recommended Runbook’, ‘Voted Runbook’ or ‘Predicted Runbook’. Select any of these from ‘Select Column’ dropdown. Then apply filter on ‘Select Score’ dropdown and click filter. It will filter the data in the grid based on the chosen filters.
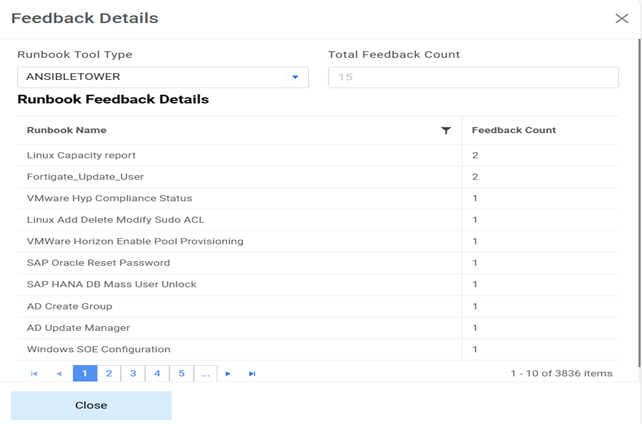
The Feedback Details provide the information about the feedback provided to each voted Runbook and the Total Feedback Count. Users need to click on Feedback Details and then in the opend popup the Total feedback count and particular feedback corresponding to each voted Runbook will be visible.
To get the detailed report of the data on feedback screen, Download CSV for any analysis. The downloaded CSV will contain the description, Runbook Name which has been recommended with the similarity score, the runbook voted by SME with the score, no. of tickets under the cluster, Efforts Before Automation (Min), Efforts After Automation (Min) and Total Efforts Saved (Min).