Top Bottom Nodes
Top Bottom Nodes allows a user to view the reports for utilization of all the Mibs, i.e. CPU, memory, disk in-out, network in-out in a graphical form.
- The objective is to view data center information at different hierarchical levels.
- Report data is viewed based on the role of a logged-in person.
- User views VM information at different hierarchical levels.
To view the Top-Bottom Nodes, users need to follow the below steps:
- On the main menu bar, click Reports→ Performance and then click Top-Bottom Nodes.
- The Top-Bottom Nodes Reports screen appears and allows the user to fill the details
in the form to get the desired report.
Figure 1. Top-Bottom Nodes 
Refer to the below table to understand the fields mentioned in the above figure.
Table 1. Top Bottom Nodes Fields Description Platform Name of Cloud service providers Cloud Account Name of environment (cloud endpoint). Only enabled Endpoints configured in Performance Configuration Screen at Provider Admin level, will be populated here. Period The lease period for which a resource is required From Date Starting date of log To Date End date of log Chart type Types of charts used for data visualization Device List the type of resources that needs to be shown on the report Order By Order of data can be ascending or descending Number of Record Total no of records can be 5 or 10 HA Category Displays whether high availability (HA) is enabled or not - To view the Top Bottom Nodes Report, users need to follow the following steps:
Cloud Filter : It allows the user to filter the results. Based on the requirement, users get a report only from cloud environment.
- Select Platform and Provisioning Endpoint.
- Select Period, for which user requires a report.
- Select From and To Date.
- Select a Chart Type i.e., Bar, Meter, or Line.
- Select a Device and then select Mibs Parameters from the available options.
- Select Order By and No. of Records.
- Enter No. of Records.
- Select HA Category.
- Click Filter to get the result.
Figure 2. Top-Bottom Nodes (Cont.) 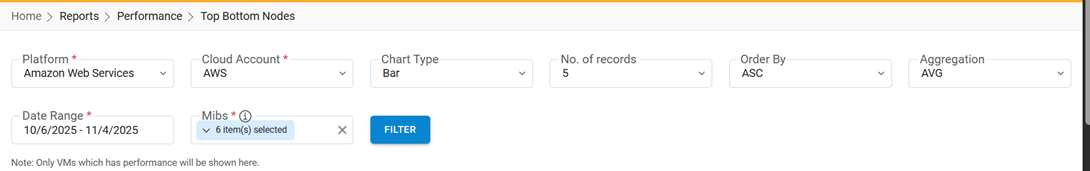
Reports appear in a graphical form, as shown below:
Figure 3. Top-Bottom Nodes (Cont.) 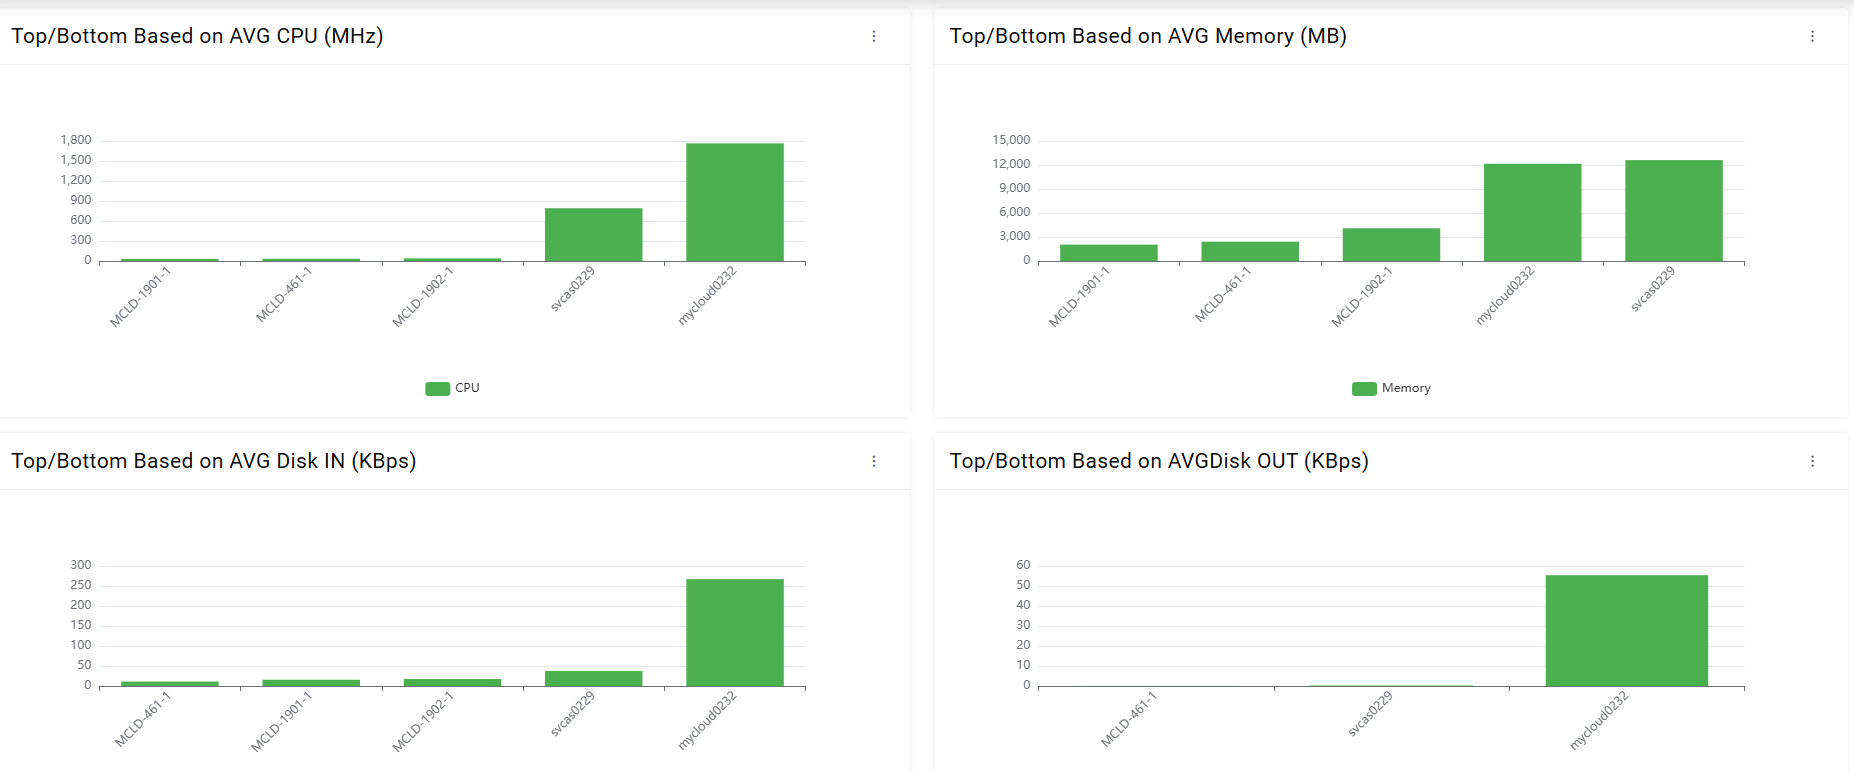
If a user want to export the file, follow the below steps:
- Select Aggregation.
- Select File Output as PDF, Excel, or CSV.
Figure 4. Select file for Export 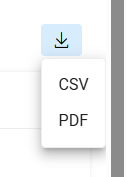
- Click Export Button.
Figure 5. Export Functionality 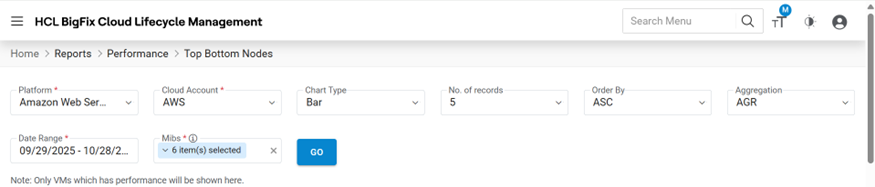
The file gets downloaded on the system.
Note:All fields marked with an asterisk (*) are mandatory.