Node Utilizations
This step explains how to manage the requester dashboard. The report displayed under requester dashboard shows machine level graph of CPU (MHz), memory (MB), disk in-out (Kbps), network in-out (Kbps) along with the status and state of the machine.
The objective of requester dashboard is to view the last 30- or 60-minutes statistics of VMs.
Report data is viewed based on the role of the logged in user.
- User views the drill down details for specific VM as status of CPU/memory /hard disk.
- User views CPU utilization, memory utilization, network utilization, disk I/O utilization for specific period (Date/Time) as data view or chart view.
To view the Requester Dashboard,
- On the main menu bar, click Reports→ Performance→ Utilizations.
- The Node Utilizations screen appears and allows the user to fill in the details in
the form to get the report:
Figure 1. Node Utilizations 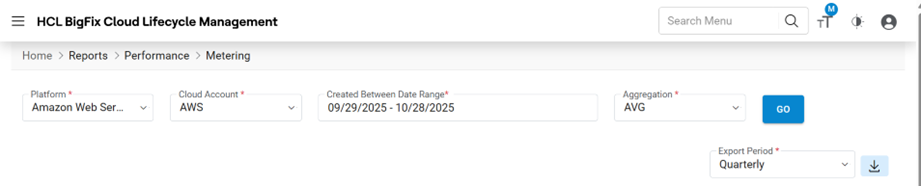
Refer to the below table to understand the fields mentioned in the above figure.
Table 1. Node Utilizations Fields Description Platform Provide the name of Cloud service providers loud Account Displays the name of the environment (cloud endpoint). Only enabled Endpoints configured in the Performance Configuration Screen at Provider Admin level, will be populated here. Aggregation Lists the type of data aggregation type - To view Node Utilizations reports, users need to follow the below steps:
Cloud Filter- It allows the user to filter the results. Based on the requirement, User gets a report only from cloud environment.
- Select Platform.
-
Select Cloud Account.
- Select Aggregation i.e., Average, to get reports based on average usage, Max to get reports based on maximum usage, or Min to get reports based on minimum usage.
-
Click Filter.
Figure 2. Node Utilizations 
.png)
Reports appear in a tabular form, as shown below:
- Click Server Name.
Figure 3. Requester Dashboard 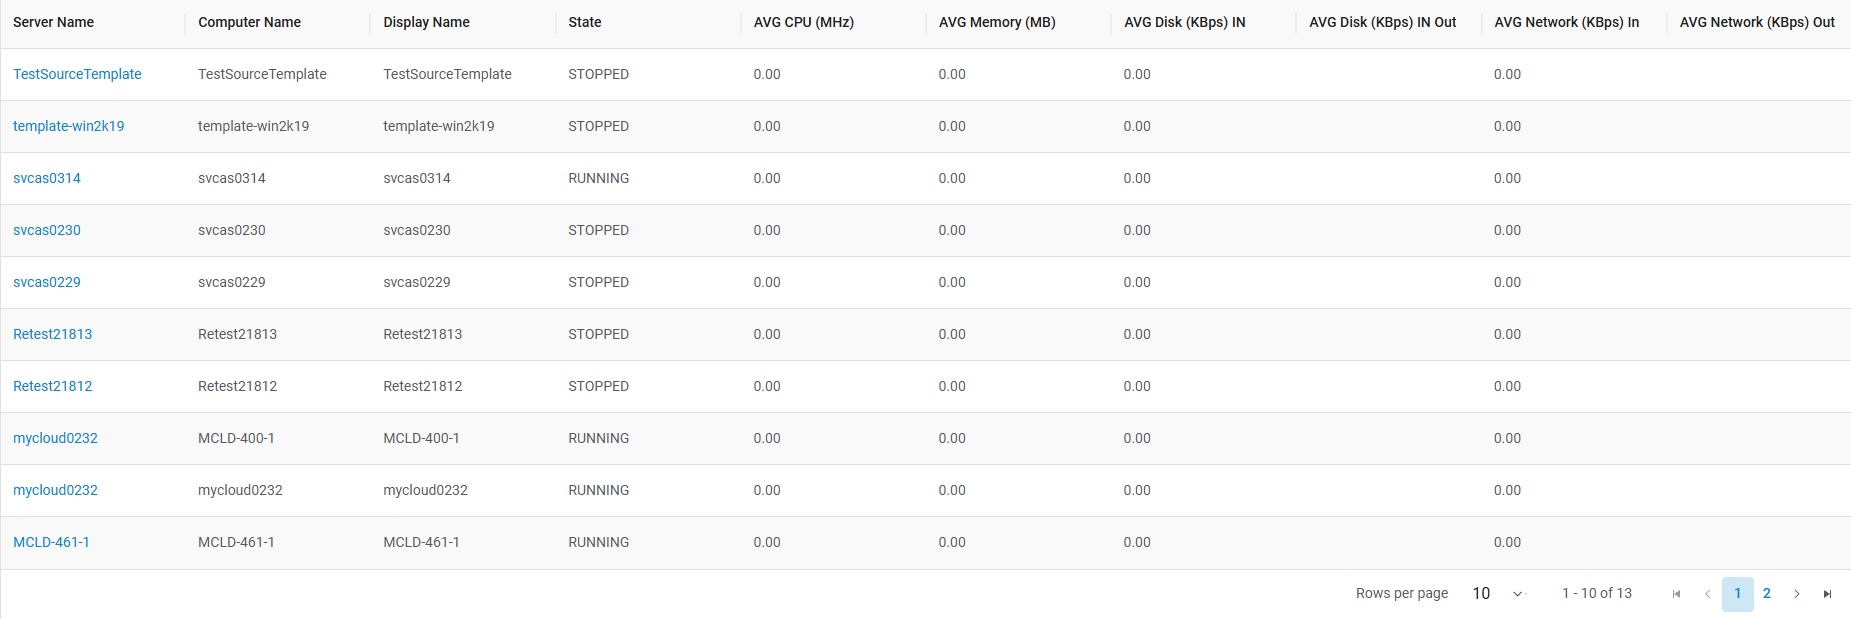
Refer to the below table to understand the fields mentioned in the above figure.
Table 2. Requester Dashboard Fields Fields Description Server Name Name of the server Computer Name Name of the computer Display Name Name assigned by a user AVG CPU (MHz) Average CPU (MHz) utilization of the server AVG Memory (MB) Average memory (MB) utilization of the server AVG Disk (Kbps) Average disk (KPBS) utilization of the server AVG Network (Kbps) Average network in-out (kbps) of the server Note:Green status signal shows trouble-free functioning of the machine. - Clicking Server Name opens the following window where a user views the detailed
report of selected server:
Figure 4. Requester Dashboard (Cont.) 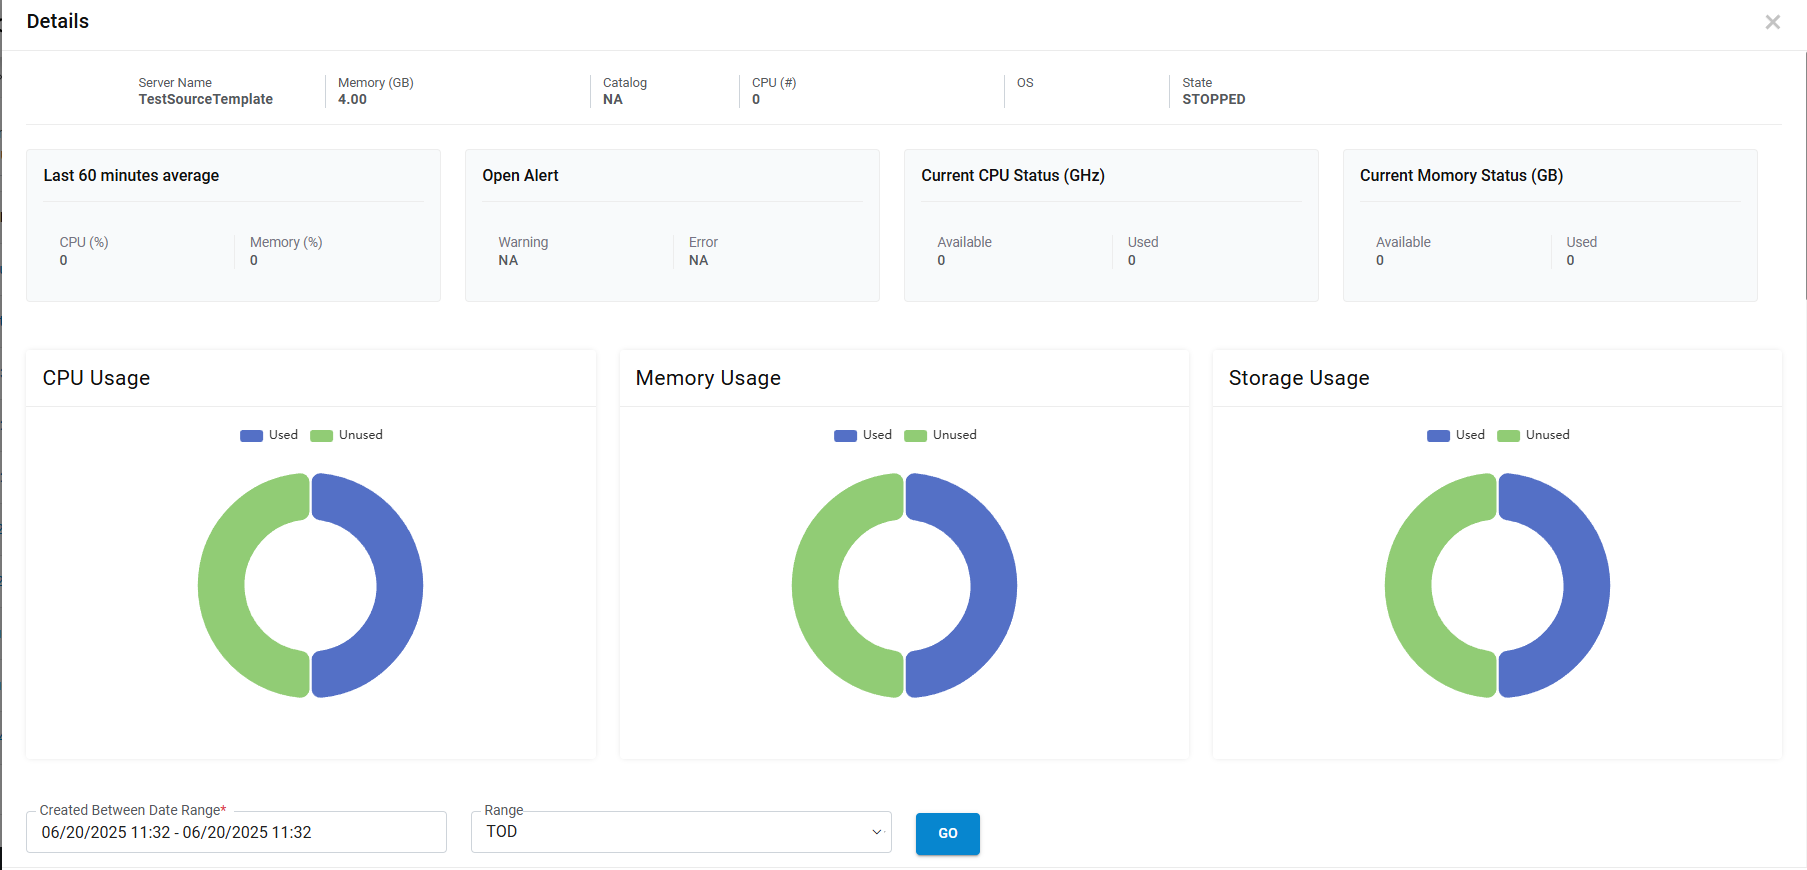
Refer to the below table to understand the fields mentioned in the above figure-
Table 3. Cloud Control Fields Description Server Name Displays the name of server. CPU Displays the server compute Memory (GB) Displays the server memory Catalog Displays the catalog which is being used to deploy the server State Shows the current state of server whether active or not OS Displays operating system of the server
If a user want to export the file, follow the below-mentioned steps:
- Select file output as PDF, Excel, or CSV.
- Click Export.
Figure 5. Export Functionality 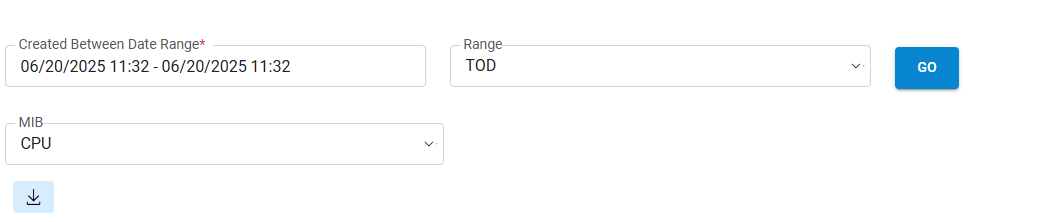
- File gets downloaded on the system.