
Deploying the Kibana dashboard
Import the pre-built Kibana dashboard that visualizes QRA scan data stored in Elasticsearch. Complete this task only if your organization uses Elasticsearch.
Before you begin
This task applies only to environments with Elasticsearch. Configure DataBridge and run a forwarding scan option first, so that the dashboard has data to display. You need the Kibana URL and Kibana credentials.
About this task
HCL provides a pre-built Kibana dashboard (NDJSON format) that visualizes the QRA scan data stored in Elasticsearch. Deploying it is a one-time action. The Task posts the Kibana Saved Objects export (NDJSON) to your Kibana endpoint using the Saved Objects import API.
Procedure
-
In the BigFix Console, open the Task named Kibana Saved Object
Dashboard Import.
Figure 1. Kibana Saved Object Dashboard Import. The Kibana Dashboard Import Parameters with Kibana URL, Username, Password, and Allow insecure TLS fields. 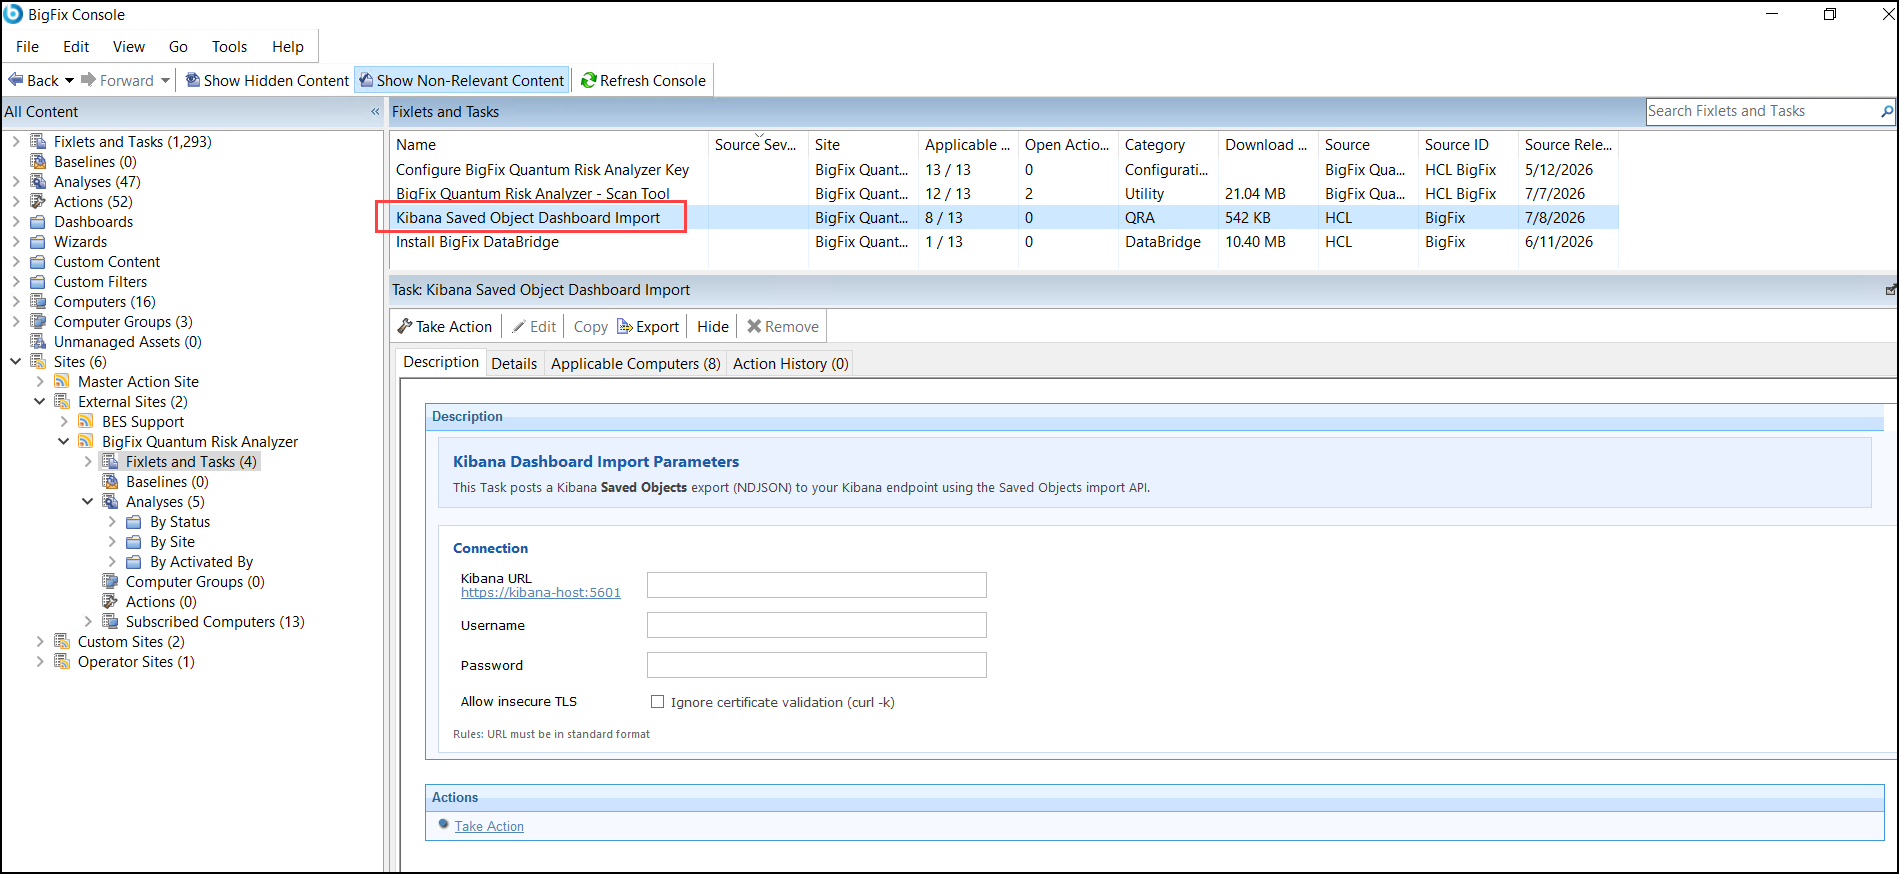
-
Click Take Action. In the Task's
Connection fields, enter your Kibana
URL in standard format (for example,
https://<kibana-host>:5601) and your Kibana Username and Password.If the Kibana certificate is self-signed, select Allow insecure TLS ("Ignore certificate validation").
Note:This Task has its own Allow insecure TLS option. It applies only to this Kibana import request and does not change the DataBridge Elasticsearch TLS setting.
-
On the Target tab, select your target computers and click
OK to deploy the action.
Figure 2. Take Action dialog for the Kibana import Task. The Target tab with Select devices, the list of applicable computers, and the OK button. 
Results
After the action completes, open your Kibana instance and verify the QRA dashboard appears under Dashboards.