
Reviewing reports
QRA surfaces scan results through two channels: BigFix Web Reports (available to all QRA deployments) and the optional Kibana Dashboard (for organizations with Elasticsearch).
After a scan completes, allow time for the BigFix Client to report results and for the activated Analyses to evaluate before expecting updated Web Report data.
BigFix Quantum Risk Analyzer Dashboard (BigFix Web Reports)
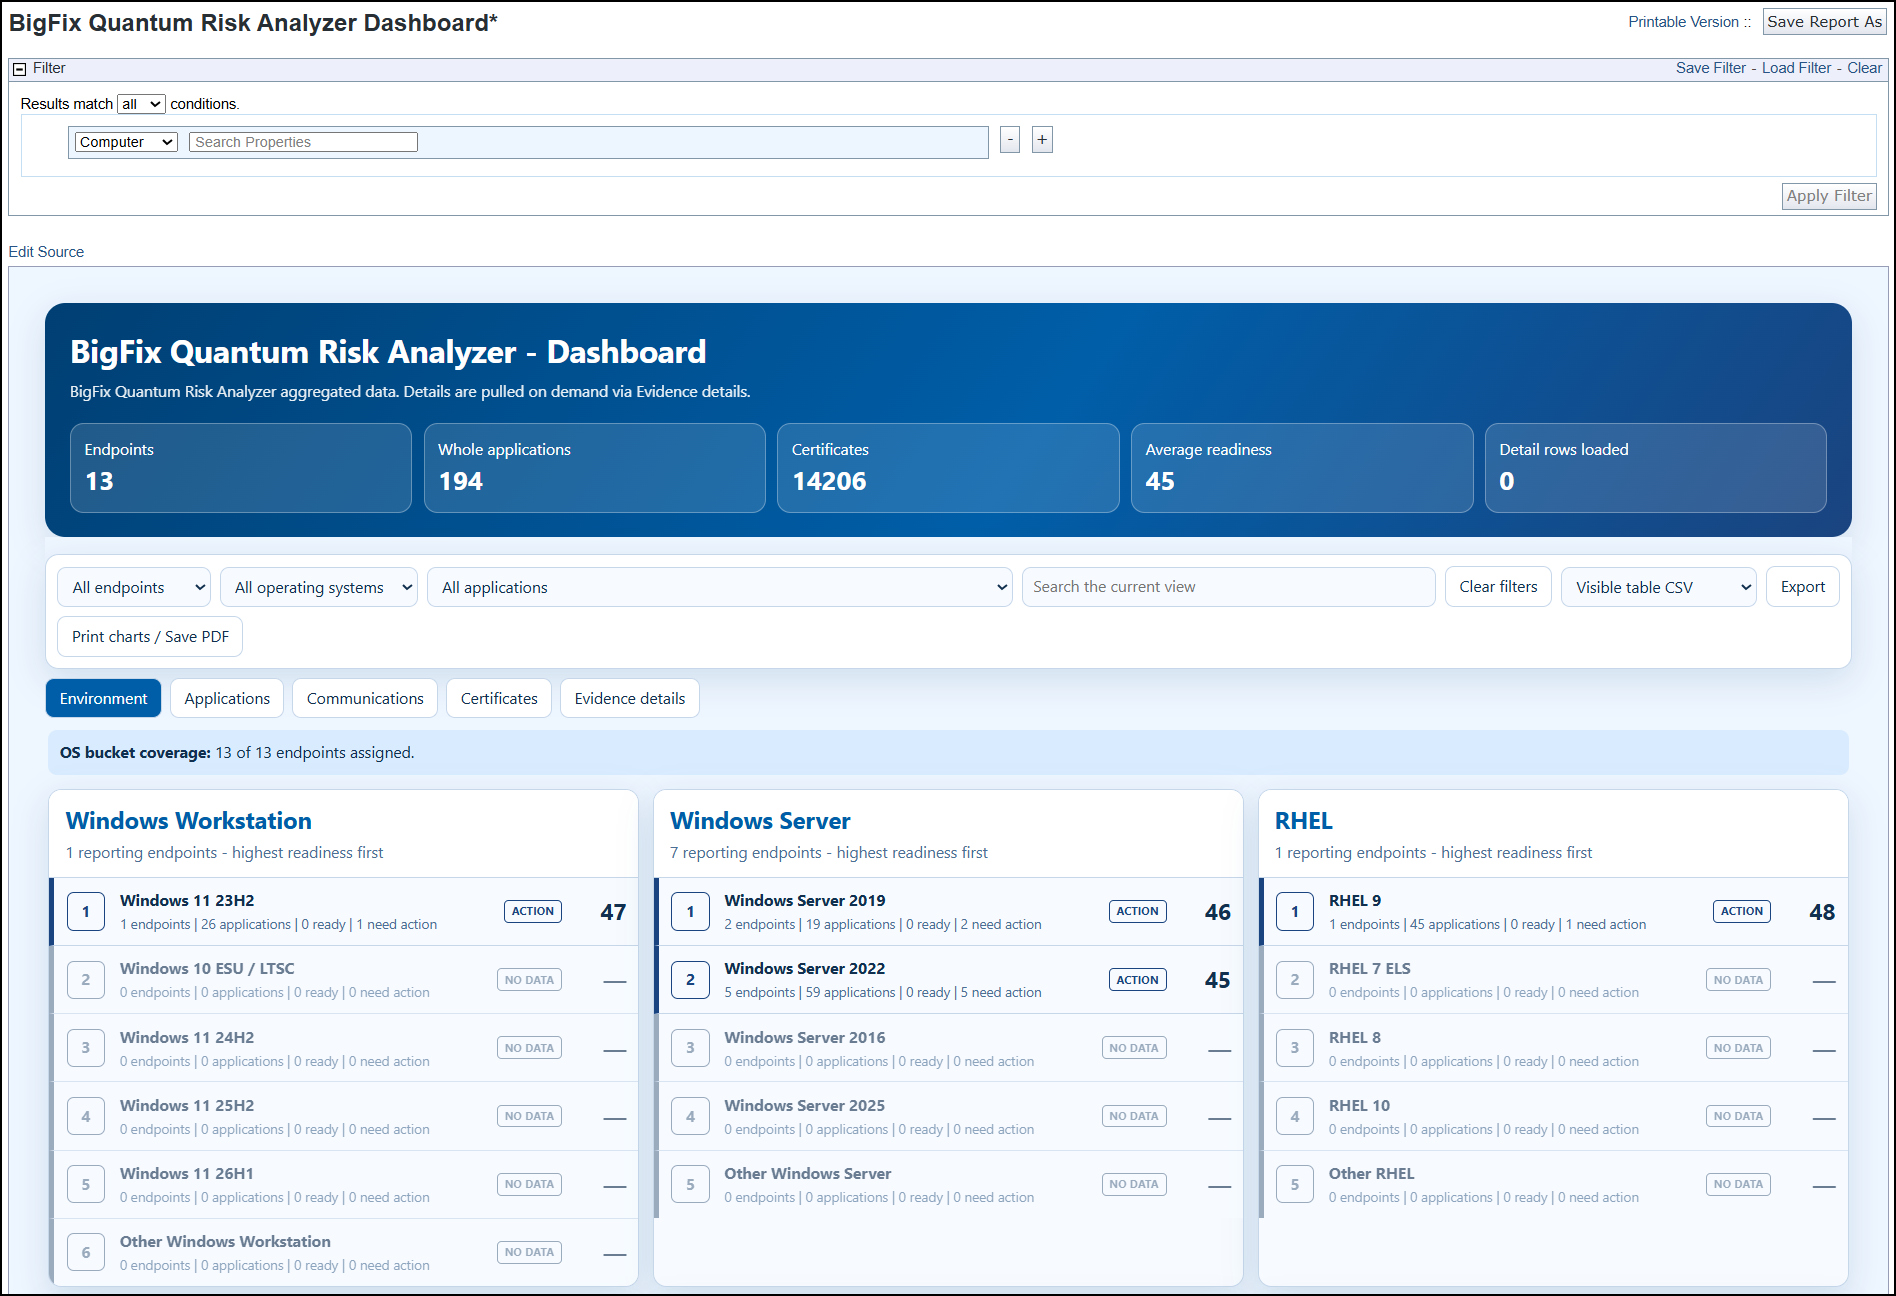
The BigFix Quantum Risk Analyzer Dashboard is the main results report, providing your cryptographic risk assessment. Access it from the BigFix Web Reports portal.
The report loads summarized data first, from the Quantum Risk Analyzer -
Aggregate Dashboard Data Analysis, so you can review environment
readiness, applications, communications, certificates, and endpoint posture without
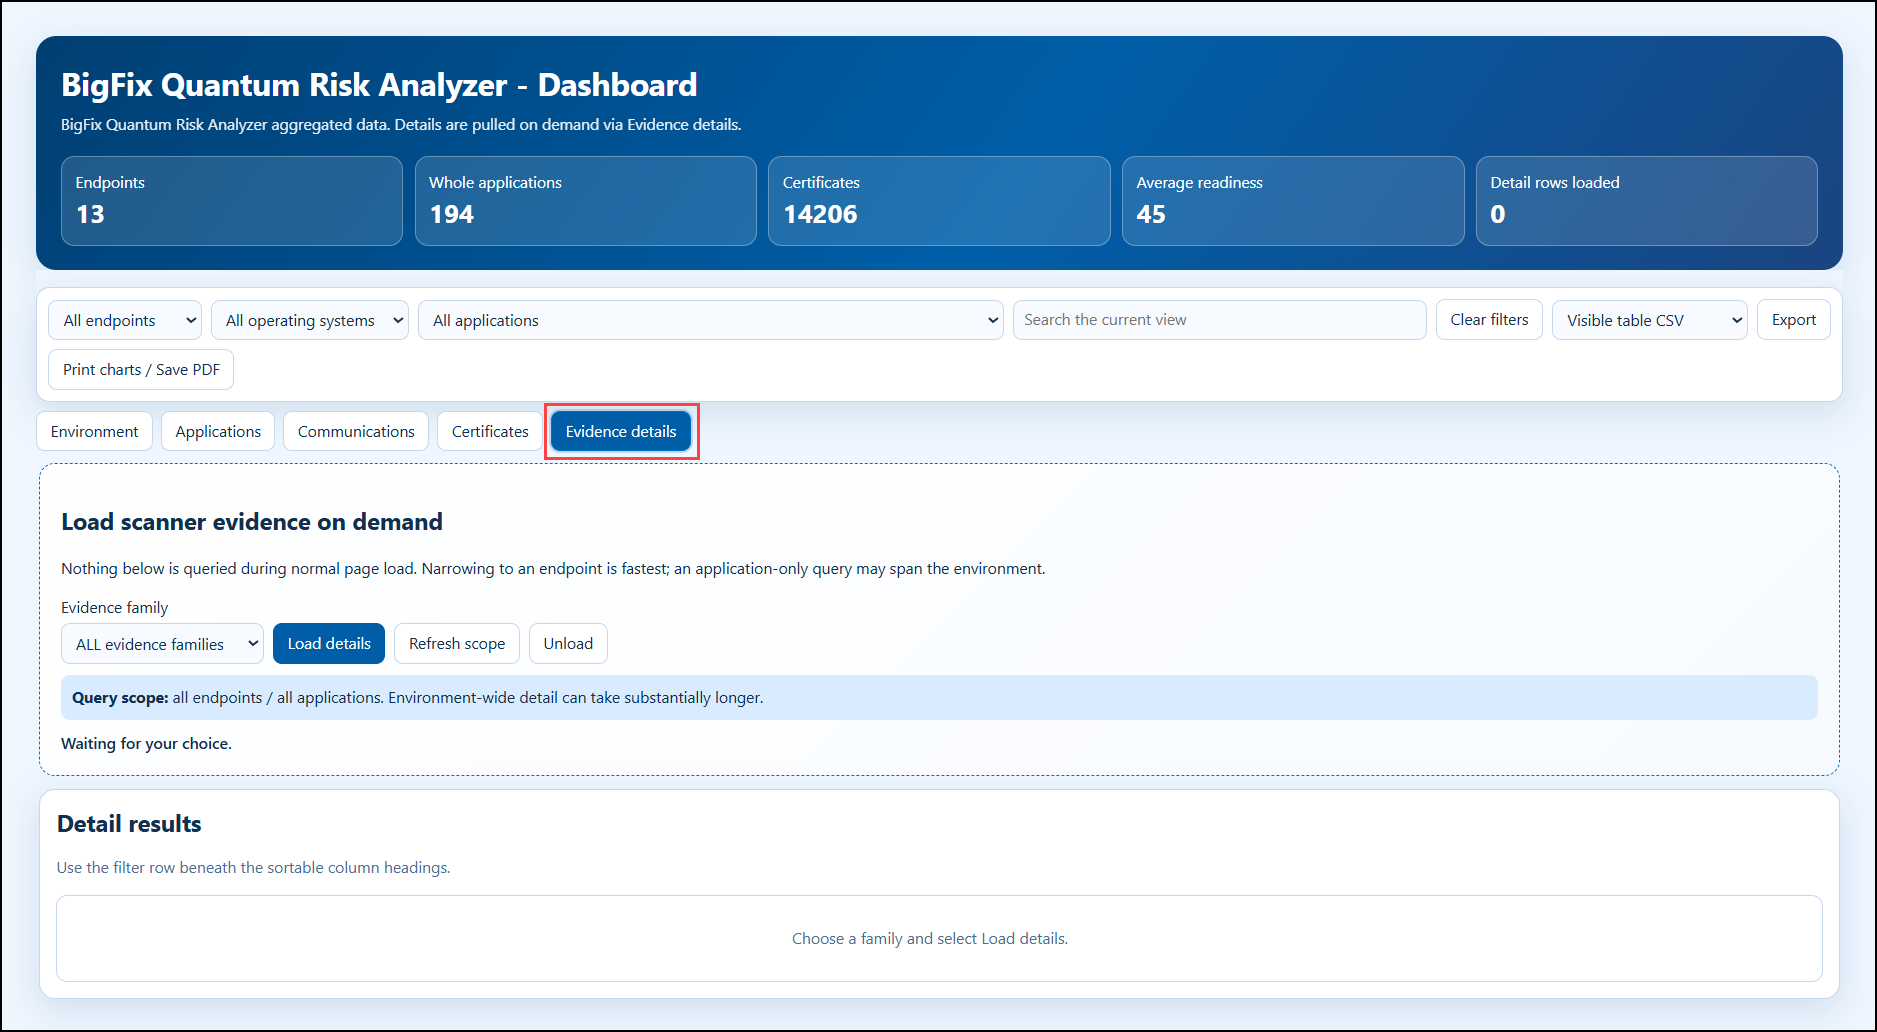
loading every evidence row. The Evidence details tab reads
the Quantum Risk Analyzer - On-Demand Detail Data Analysis only
after you explicitly select Load details; filtering to an
endpoint first produces a smaller and faster query. The report supports filtering,
sorting, CSV/JSON export, and printing to PDF.
The Dashboard report opens with environment KPI cards (endpoints, whole applications, certificates, average readiness, and detail rows loaded) and clickable filters, organized in tabs: Environment, Applications, Communications, Certificates, and Evidence details (see BigFix Quantum Risk Analyzer Dashboard report). The report is application-centric and supports exporting data as CSV, JSON, and group JSON.
The Evidence details tab loads scanner evidence on demand: nothing is queried during normal page load, and you can narrow the scope to an endpoint or an evidence family (for example, Ports and OMB/CRQC) before loading details (see Dashboard report, Evidence details tab). This tab supports United States federal civilian reporting needs such as the OMB report.
Because QRA datasets can be very large, Web Reports displays load-time warnings with a Continue prompt before running long queries. Exported data is pipe-delimited, and you can select specific subsets of data rather than pulling the entire aggregate dataset.
- Open your BigFix Web Reports server in a browser (typically http://<root-server>:8083). Log in with your operator credentials.
- Navigate to Reports and locate the Quantum Risk Analyzer report group. Open the BigFix Quantum Risk Analyzer Dashboard report.
- The report displays:
- Quantum Readiness Score (0-100) per endpoint across four weighted categories.
- Risk breakdown by endpoint - red/orange/yellow/green based on cryptographic vulnerability severity.
- Cryptographic Bill of Materials (CBOM) - inventory of every cryptographic implementation discovered.
Quantum Readiness Score - Category Breakdown
The score is a 100-point assessment across four weighted categories. A 32-bit endpoint receives an automatic score of 0 (Not Ready) regardless of other factors.
| Category | Sub-category | Max Pts | Key factors |
|---|---|---|---|
| Hardware (40) | CPU Capabilities | 20 | 64-bit required; AES-NI, AVX2, BMI; core count; generation |
| Hardware (40) | Memory Capacity | 15 | 8 GB=8-10 pts; 16 GB=12-13 pts; 32 GB+=15 pts |
| Hardware (40) | Security Hardware | 5 | TPM, Secure Boot, Hardware RNG, Intel SGX/ARM TrustZone |
| OS (30) | Version Support | 20 | Win 11 24H2+/macOS 15+/Kernel 6.0+=20 pts; older=lower |
| OS (30) | Crypto Framework | 10 | Native PQC APIs; PKCS#11, CNG, Security.framework; HSM/TPM |
| Crypto Libraries (25) | OpenSSL Version | 15 | 3.4.0+=15 pts; 3.3.0+=12; 1.1.1=3; 1.1.0 or older=0 |
| Crypto Libraries (25) | System Crypto | 10 | CNG/CAPI (Win), Security.framework (macOS), libgcrypt/NSS (Linux) |
| Network (5) | Bandwidth | 3 | Gigabit+=3; 100 Mbps+=2; 10 Mbps+=1 |
| Network (5) | Protocol Support | 2 | TLS 1.3, HTTP/2, HTTP/3, IPv6, QoS |
Readiness Classification Thresholds
| Status | Workstation Score | Server Score |
|---|---|---|
| Ready | 88-100 | 92-100 |
| Partially Ready | 68-87 | 75-91 |
| Update Required | 45-67 | 55-74 |
| Not Ready | 0-44 | 0-54 |
Systems with less than 4 GB RAM receive 0 points for Memory (up to 15 pts lost), but assessment continues. Only 32-bit architecture is a hard block resulting in score 0.
BigFix Quantum Risk Analyzer Scan Health (BigFix Web Reports)
The BigFix Quantum Risk Analyzer Scan Health report is your primary operational monitoring tool for QRA. It answers: "Is the scanner actually running on my endpoints, and did it succeed?"
Use it to find completed, running, failed, stale, or missing scans and to review scan timing and recent activity. Common problems are surfaced directly in this report: an invalid or expired license, unreachable Elasticsearch, bad Elasticsearch credentials, and aborted scans. The report supports searching, sorting, and CSV export.

The Scan Health report and its DataBridge Status tab track the operational status of scans and the health of DataBridge transfers, giving visibility into data coverage across the environment.
The report's DataBridge Status tab shows transfer audit
information only when DataBridge is installed and the HCL DataBridge
Audit Status Analysis is active on the Root Server.

This report requires the Quantum Risk Analyzer Scan Health
Analysis to be activated. If the Analysis is not active, this
report shows no data.
- In BigFix Web Reports, open the BigFix Quantum Risk Analyzer Scan Health report from the Quantum Risk Analyzer report group.
- Review per endpoint:
- Last run time - when the scanner last executed successfully.
- Success/failure status - whether the last scan completed without errors.
- Endpoints not reporting - where results are absent or stale.
- For failed or stale endpoints, check the troubleshooting information before re-deploying the scan Task.
Review the Scan Health report before the Dashboard report. Stale scan data in the Scan Health report means the Dashboard report may understate your cryptographic risk.
Kibana Dashboard (optional)
The Kibana dashboard provides advanced visualization beyond BigFix Web Reports: time-series trending, heat maps, custom filtering, and real-time updates through DataBridge.
The dashboard organizes the scan data in tabs: Inventory, Application Report, Application Detail, Certificate Report, Application Connections Topology, and Cost Analysis (see Kibana dashboard, Inventory tab through Kibana dashboard, Certificate Report tab). Each panel supports clickable filtering, and the KQL filter bar and time-range selector narrow every view.
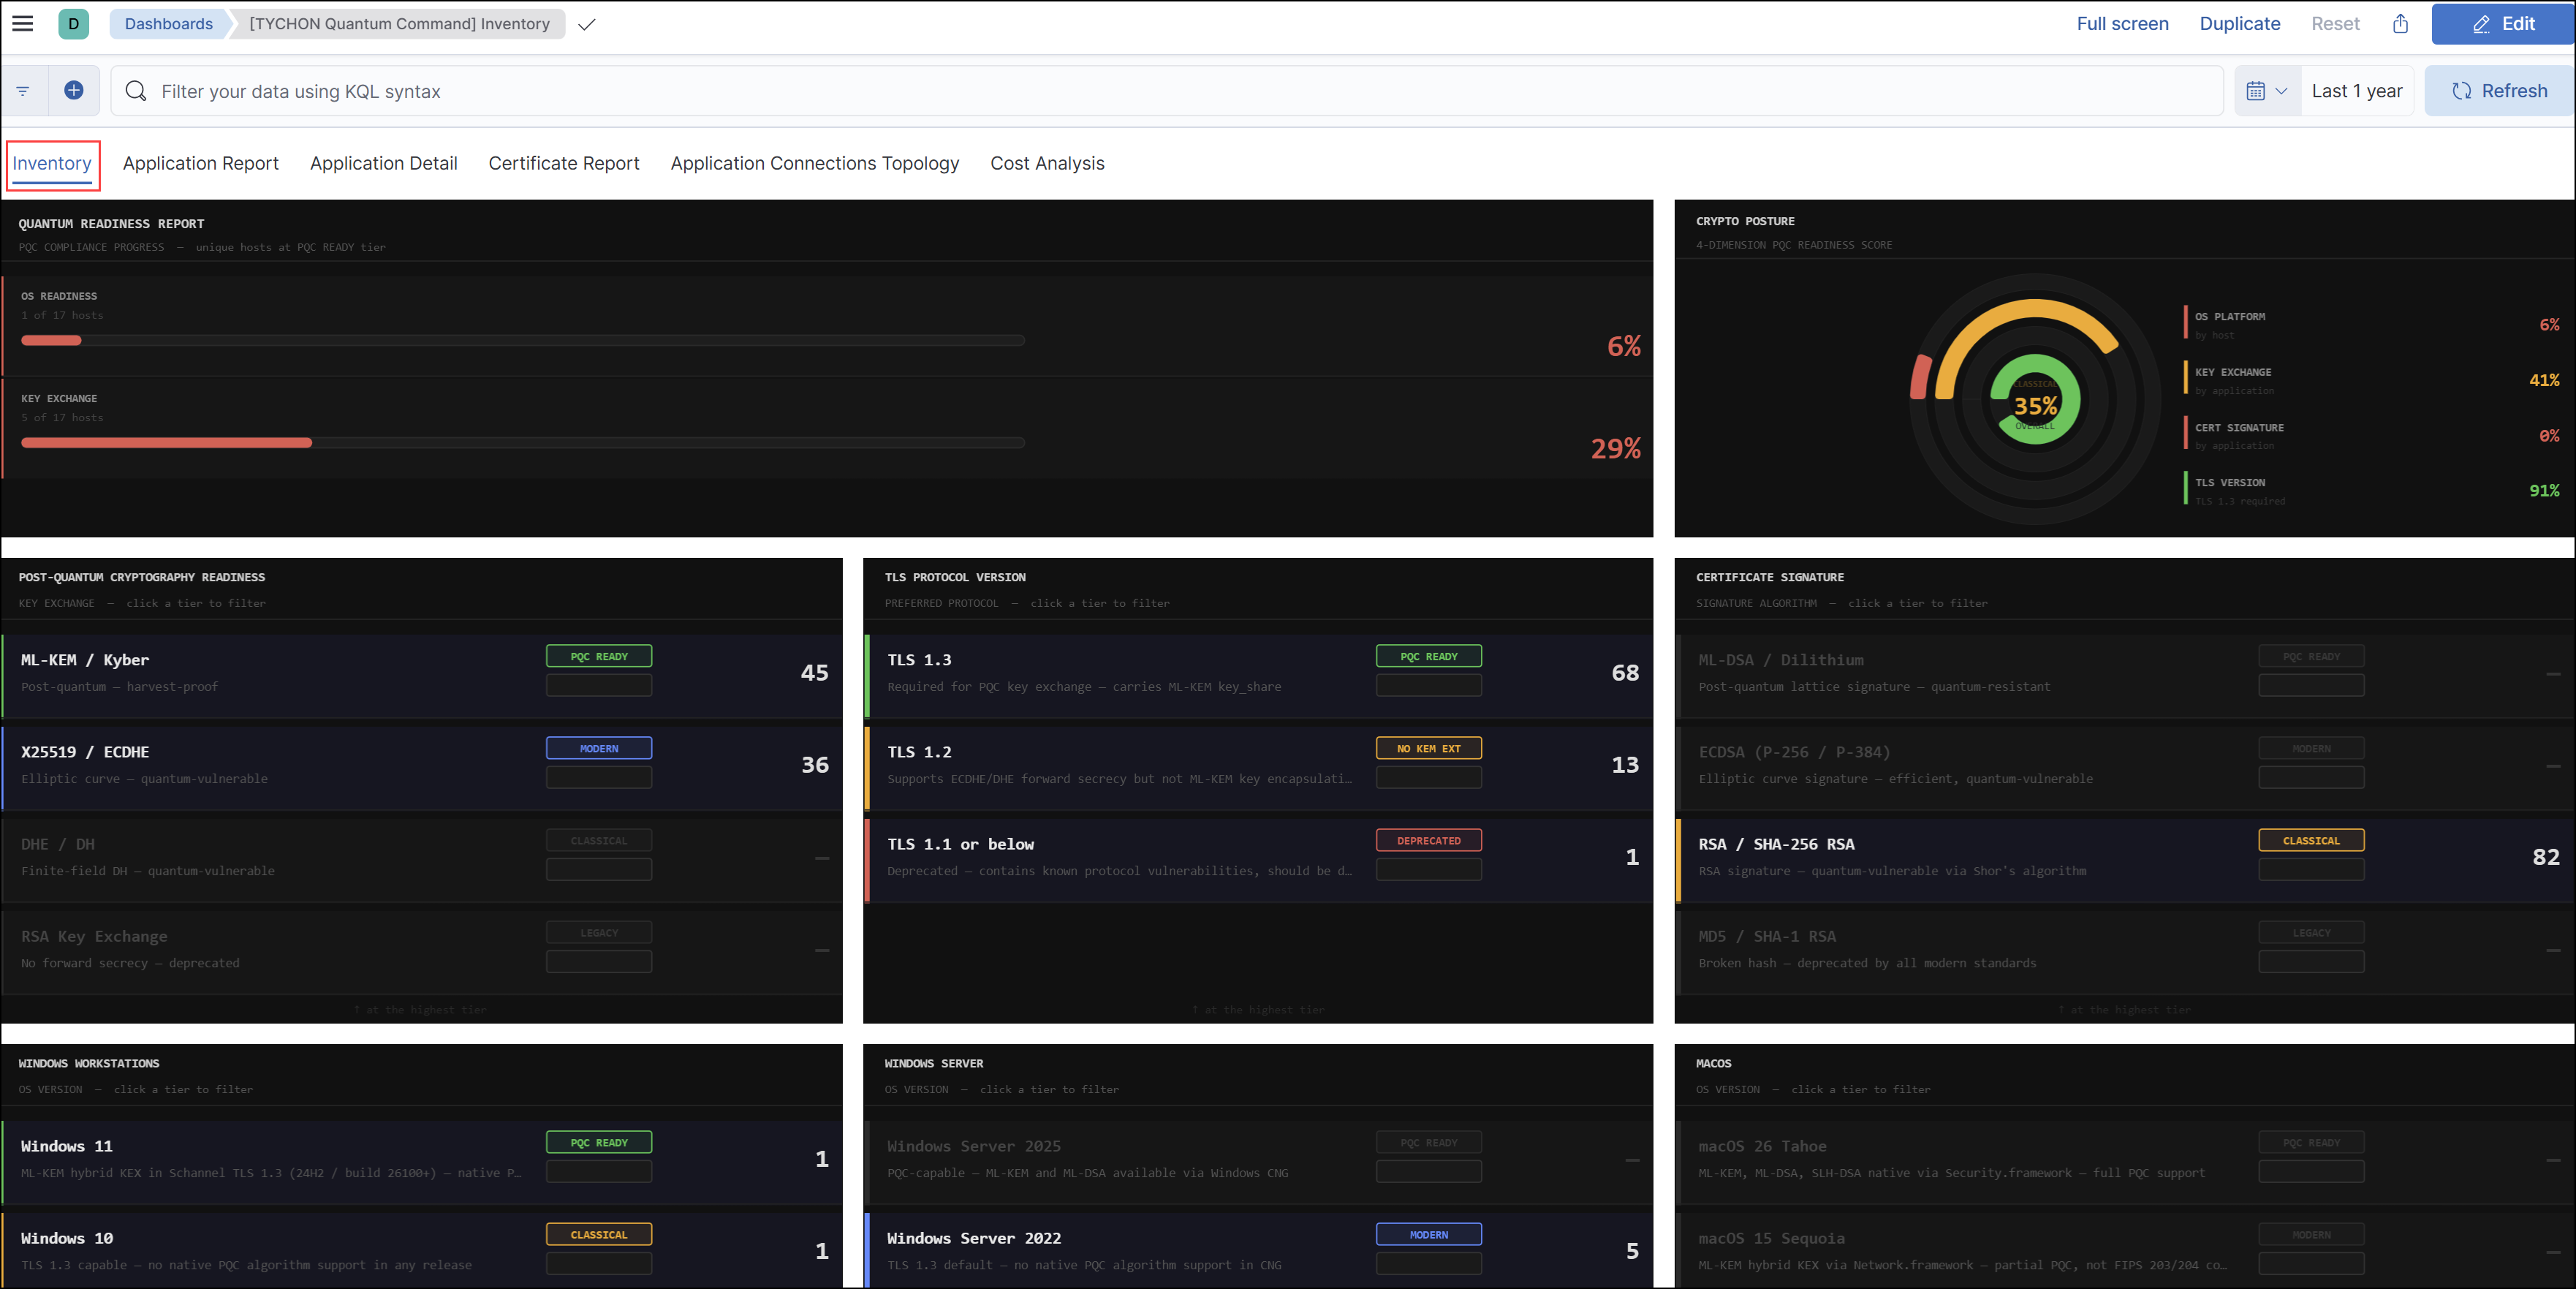

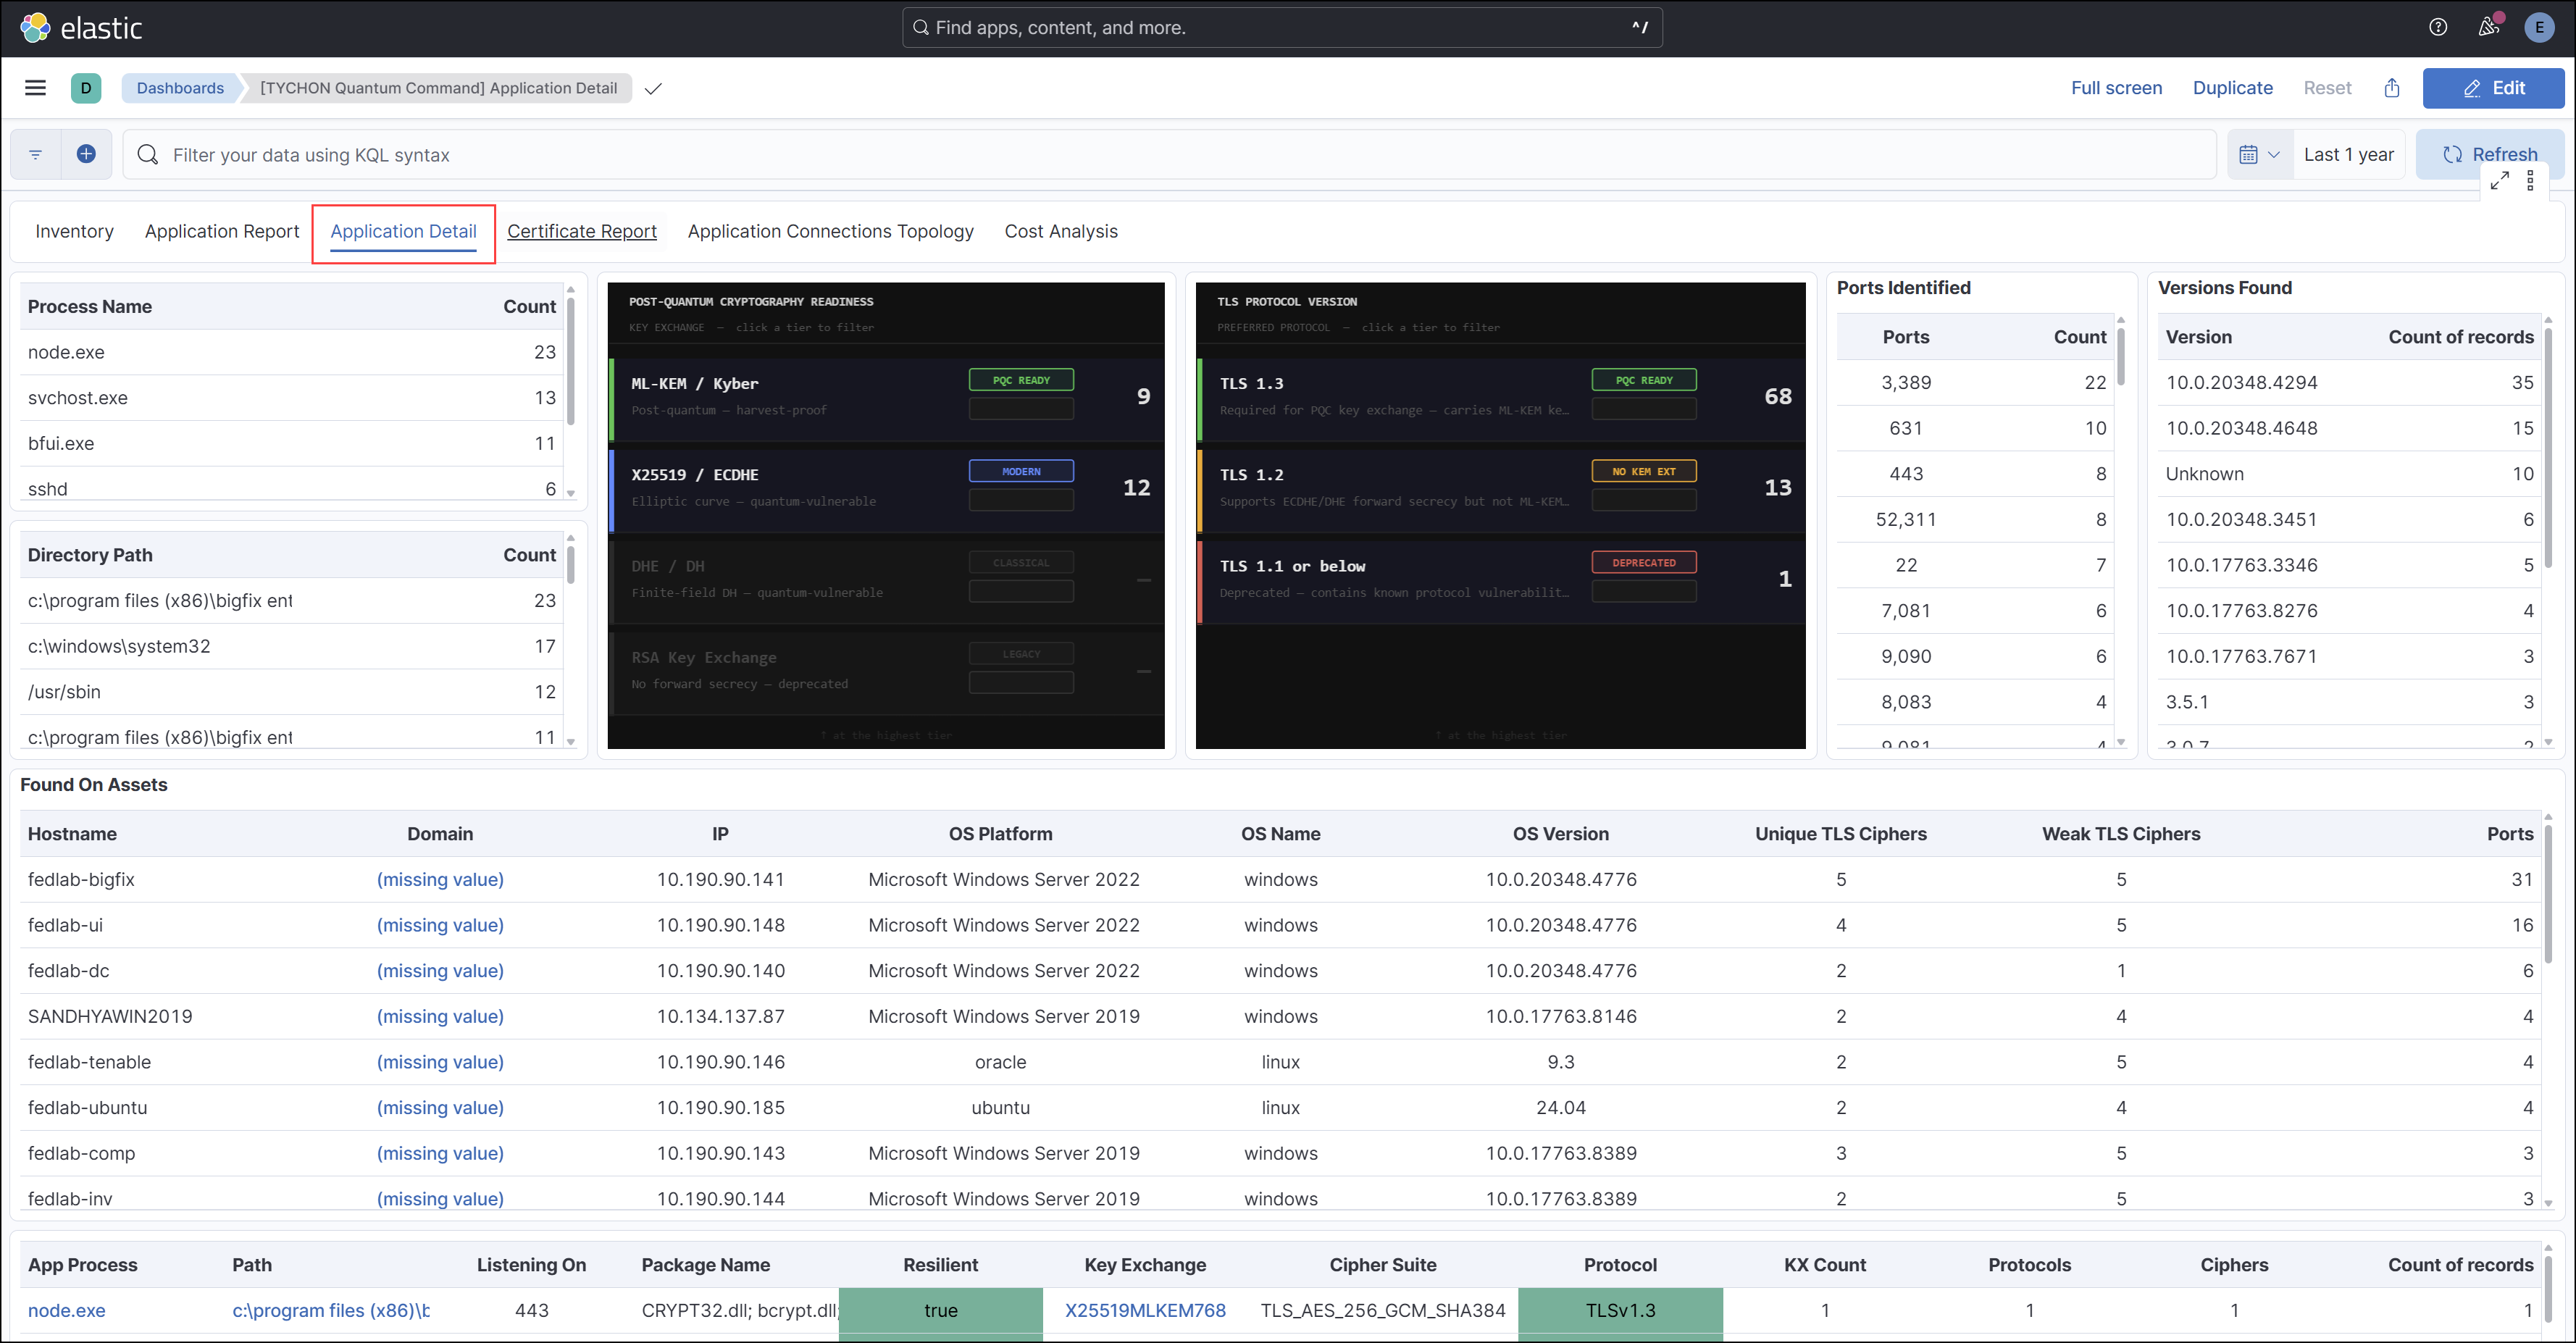

After deploying the dashboard, access it in Kibana under Dashboards.
The dashboard requires Elasticsearch data to be flowing. Without DataBridge configured and a forwarding scan option in use, the dashboard shows empty visualizations.
ServiceNow integration (optional)
If the BigFix-to-ServiceNow connector is configured in your environment, you can use the ServiceNow integration to send QRA quantum-readiness data to ServiceNow. This makes readiness data available to security, leadership, and workstation teams in the tools they already use.