Viewing and exporting dashboard data
Display any widget's underlying data as a table, and export the whole dashboard or an individual widget.
Exporting the dashboard
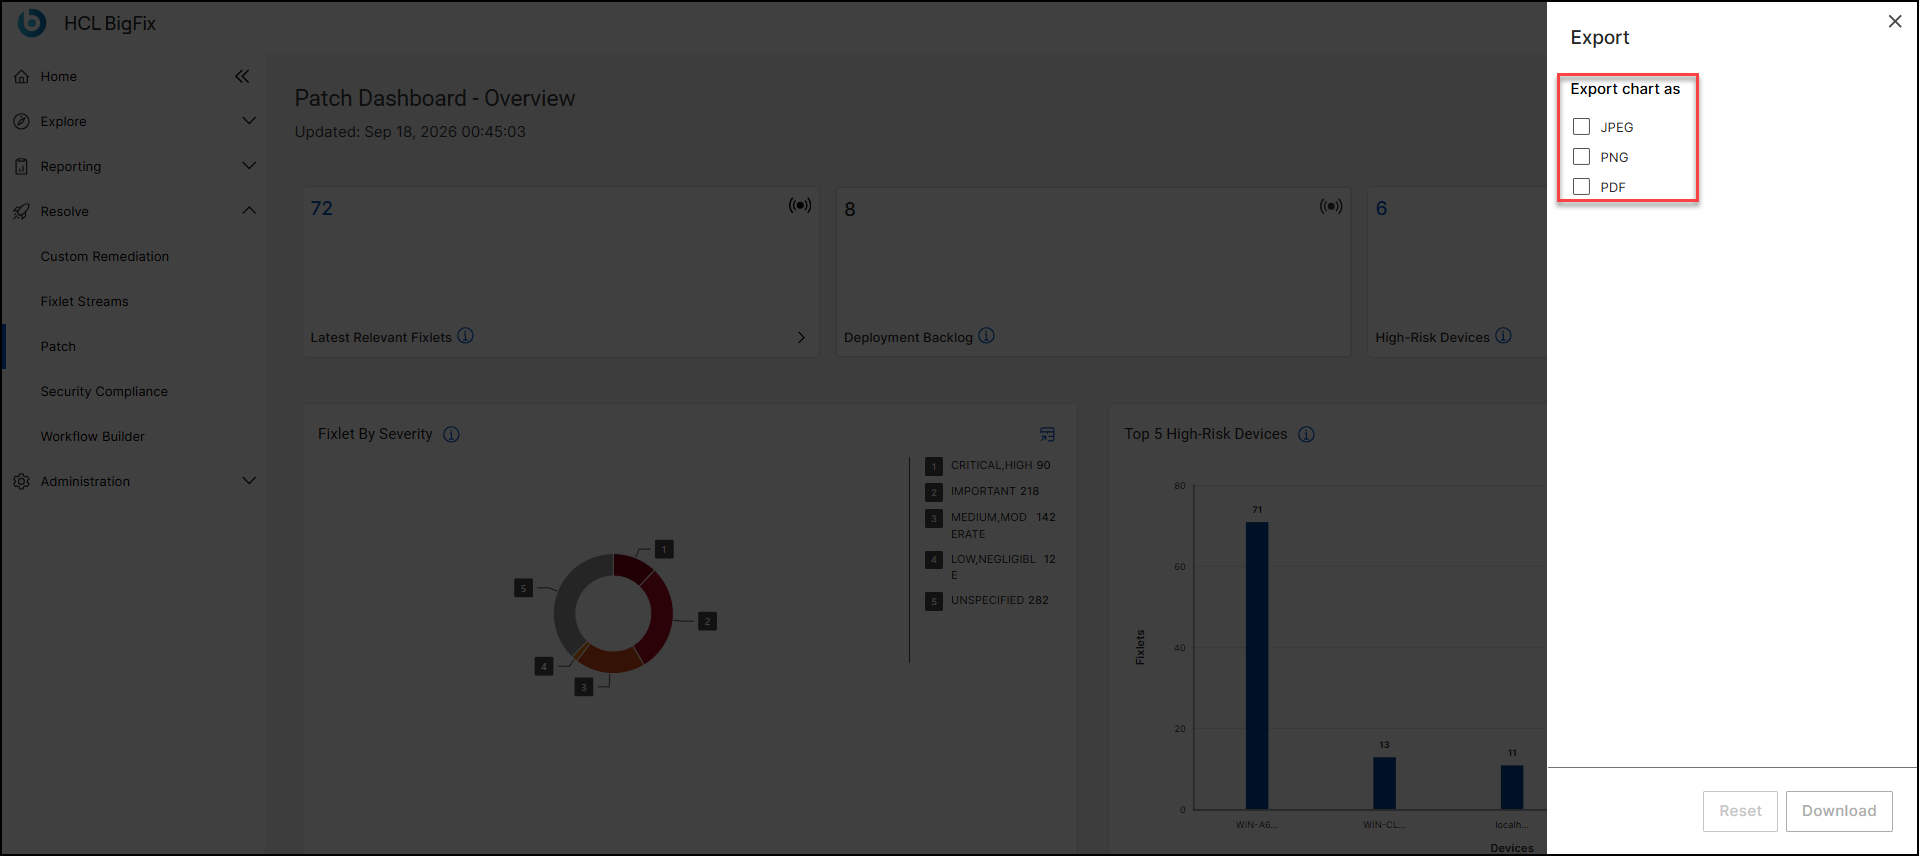
Select the Export icon on the main header to download a snapshot of the whole Overview page as PDF, PNG, or JPEG. The export contains the KPI cards and charts as displayed, including any filters currently applied, together with the Updated timestamp.
Viewing and exporting a widget's data
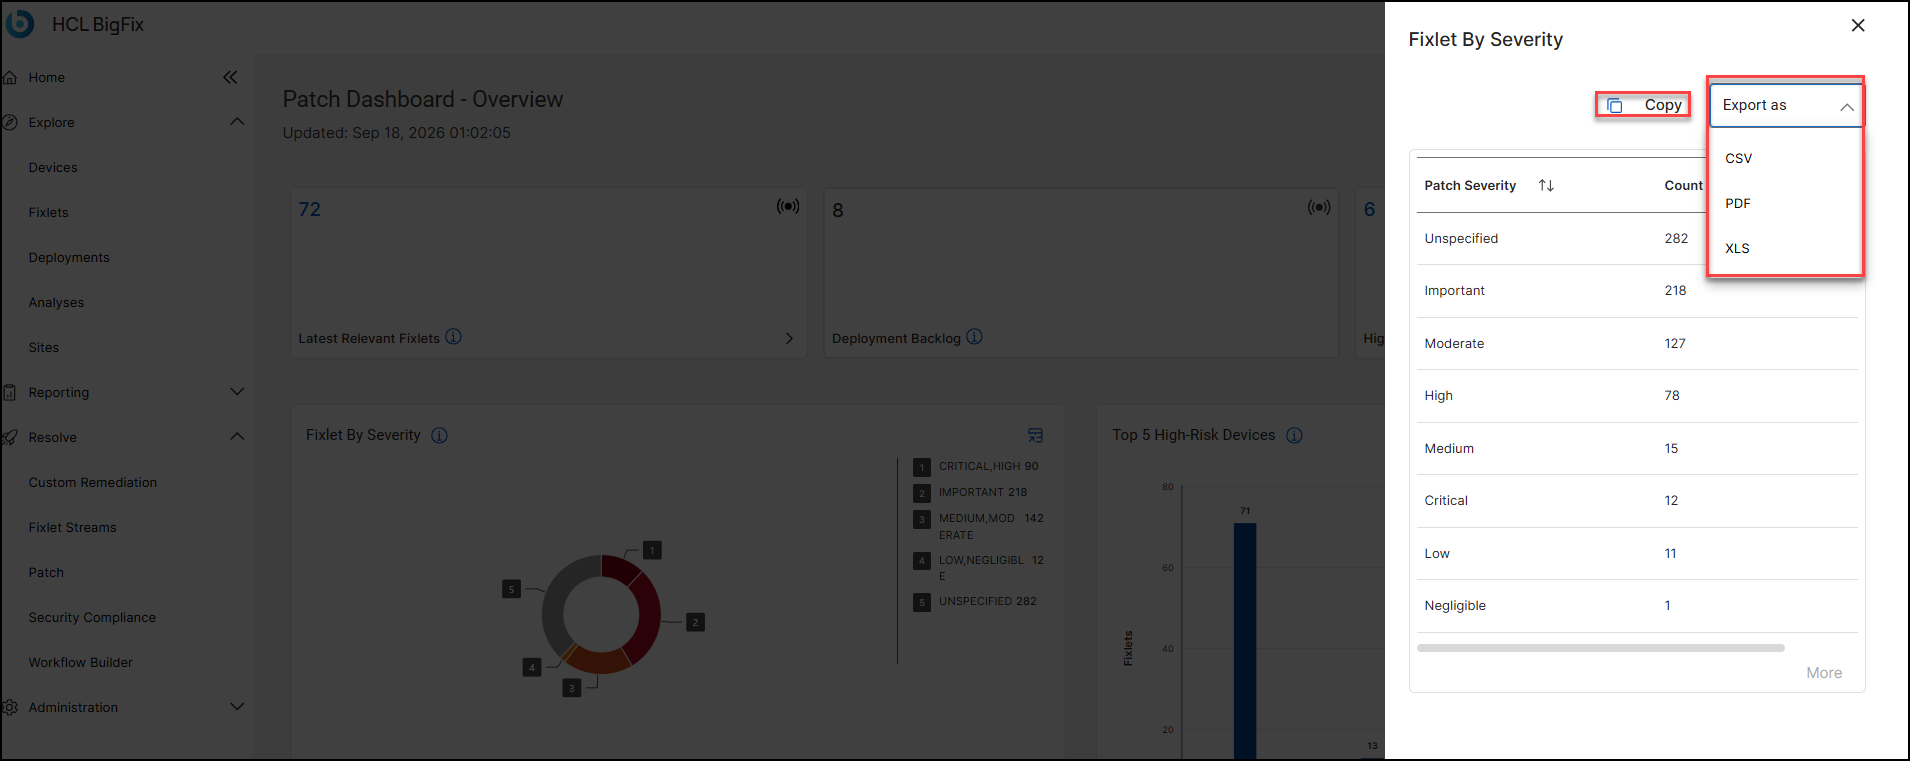
- Select the Data Table icon in the top-right corner of a widget. A side panel opens with the widget title and a table of the underlying, ungrouped values.
- To sort the table, select a column heading.
- To copy the table to the clipboard, select Copy.
- To download the table, open the Export as list, and then select CSV, PDF, or XLS.