
Charts and widgets
Charts and ranked-list widgets visualize patch risk and impact across your environment.
| Widget | What it shows | Where it takes you |
|---|---|---|
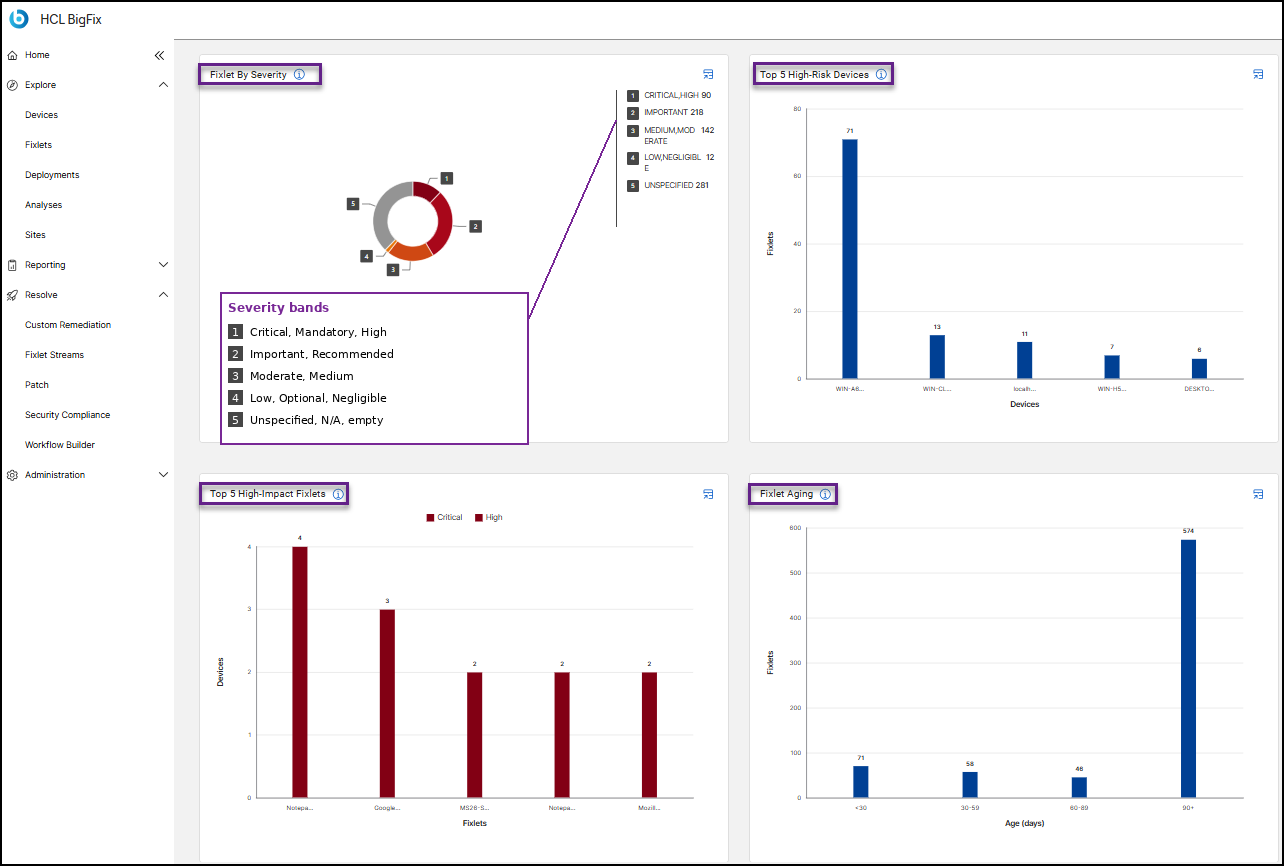
| Fixlets by Severity (donut chart) | Total applicable Fixlets distributed across severity levels.
Severities are grouped into five bands; see Severity bands used by the Fixlets by Severity chart for the full severity-to-band mapping. Note: The chart
groups multiple severities into 5 core color slices due to UI color
palette constraints. Select the Data Table
icon on the widget to see exact, ungrouped counts for every severity
level. |
Fixlets (under Explore), filtered by the selected severity |
| Top 5 High-Risk Devices (bar chart) | Lists the top 5 devices with the maximum number of Critical, High, or Mandatory severity patches applicable but not yet deployed. The x-axis shows the device names, and the y-axis shows the count of applicable Fixlets. | Device details page for the selected device, opened on the Relevant Fixlets tab. |
| Top 5 High-Impact Fixlets (bar chart) | Lists the top 5 patches with the maximum number of applicable devices. Defaults to Critical, High, and Mandatory severities, adjustable using the dashboard filters. Bars are colored by severity. | Fixlet details page for the selected Fixlet. |
| Fixlet Aging (bar chart) | Groups unapplied patches into age buckets: <30, 30-59, 60-89, and 90+ days. Age is calculated from the day the patch was released by the OEM, not from the date the Fixlet became relevant on a device. | Fixlets (under Explore), filtered by the selected age range. |
Select the Data Table icon on the top-right of a widget to open a table listing the individual, ungrouped counts behind that widget. For steps, see Viewing and exporting dashboard data.
Severity bands used by the Fixlets by Severity chart
BigFix content uses several severity vocabularies. The donut chart merges them into 5 bands so that the chart stays readable.
| Band | Severity values included |
|---|---|
| 1 | Critical, Mandatory, High |
| 2 | Important, Recommended |
| 3 | Moderate, Medium |
| 4 | Low, Optional, Negligible |
| 5 | Unspecified, N/A, and empty values |
Note: Fixlets whose severity field is blank cannot be selected in the dashboard filter
and might not appear in the chart. This is a limitation of the underlying
data.