Patch Compliance Report
The Patch Compliance Report shows the update health of your environment by tracking, for every applicable patch, how many of the targeted devices have been successfully remediated. Use it to isolate outstanding vulnerabilities and to produce audit-ready evidence of patch compliance.
Where the Patch dashboard tells you what needs patching, the Patch Compliance Report tells you how far patching has progressed. Each row of the report is a patch (Fixlet); the report compares the devices on which the patch has been remediated with the devices on which it is still applicable, calculates a compliance percentage for the patch, and rolls the results up into an overall compliance score for the environment.
The report is designed for two audiences:
- Patch and release managers, who track deployment progress against SLAs and need a compliance figure they can report to security leadership.
- Auditors and compliance teams, who need an exportable, timestamped record that documents patch status at a point in time.
Opening the report
In the BigFix UI, click and you will see Patch Compliance Report.
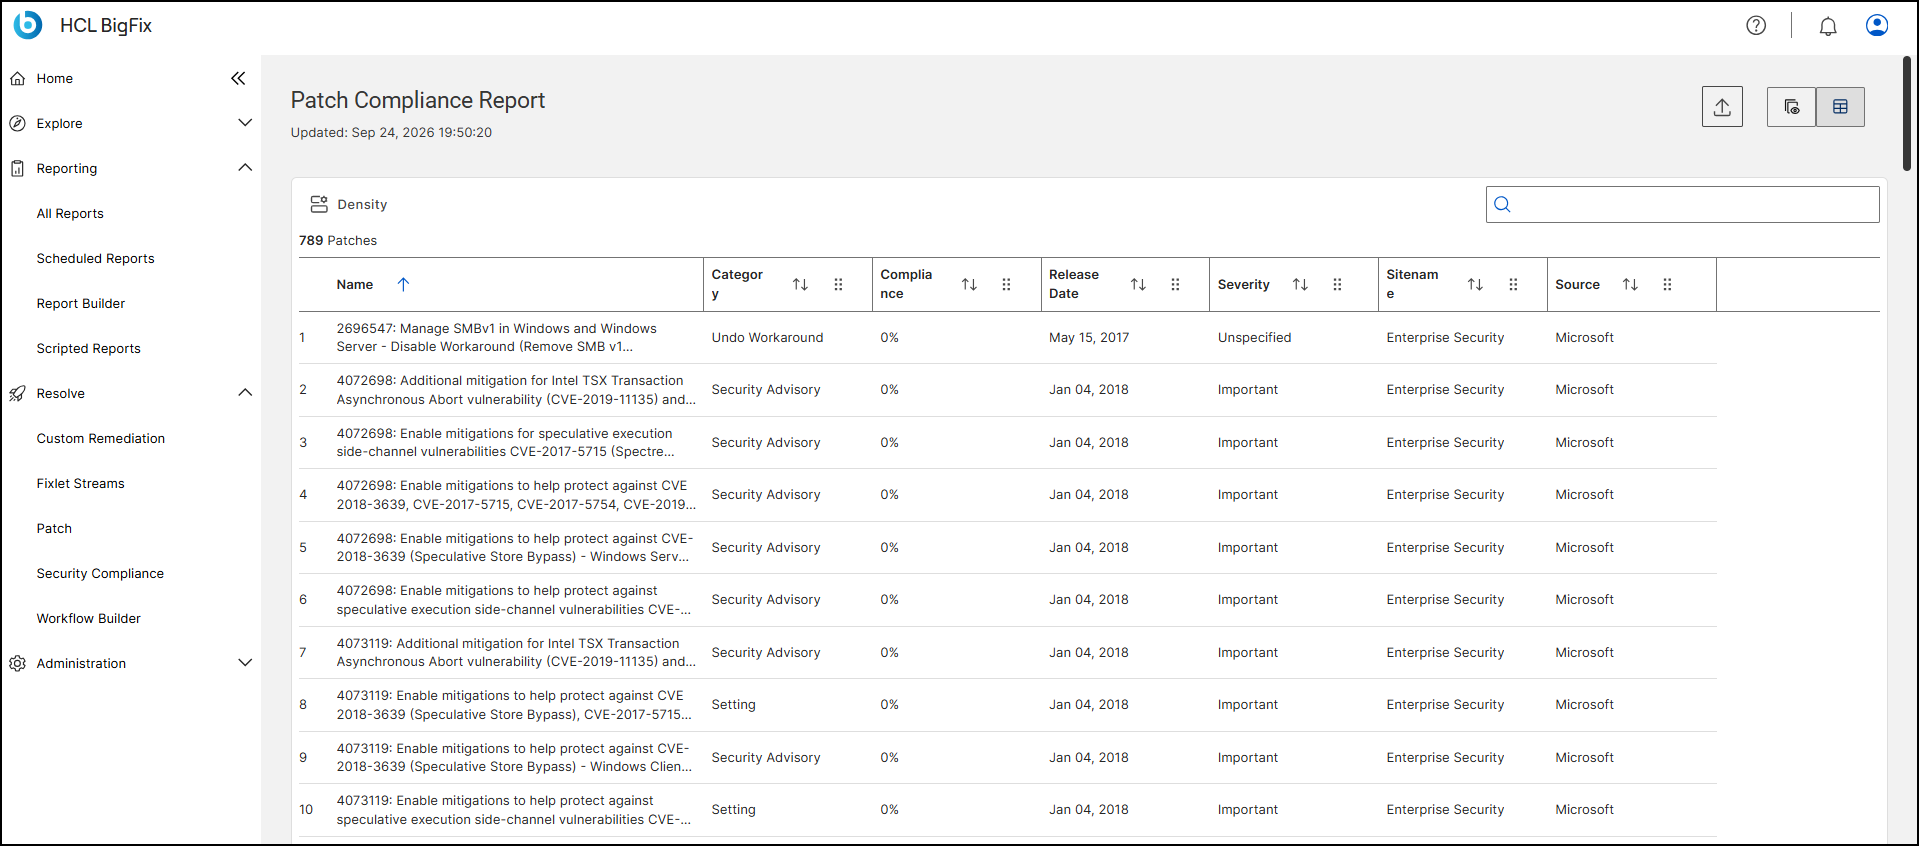
The report header shows the date and time at which the report was generated. These values are also included in exported copies, so that a saved report is self-describing. The header also contains the Export icon and two view-toggle icons for switching the report's layout.
Report toolbar and controls
Below the page header, the report provides the following controls:
| Control | Description |
|---|---|
| Density | Click the Density icon to switch the table between a compact and a comfortable row height. This does not change the data shown, only how much of it is visible without scrolling. |
| Search | Use the search box on the right of the toolbar to filter the table to rows matching your search text. |
| Patch count | The report displays a running total of patches above the table, for example 789 Patches. This count reflects any search filtering currently applied. |
Table columns
The table lists one row per patch. Each column header can be sorted in ascending or descending order, and columns can be reordered using the drag handle next to the sort arrows.
| Column | Description |
|---|---|
| Name | The Fixlet ID and title, for example 4072698: Enable mitigations to help protect against CVE-2018-3639. Sorted ascending by default. |
| Category | The Fixlet category, such as Security Advisory, Setting, or Undo Workaround. |
| Compliance | The compliance percentage for the patch. See How compliance is calculated. |
| Release Date | The date the patch was released. |
| Severity | The patch severity, such as Important or Unspecified. |
| Sitename | The BigFix site that provides the patch, for example Enterprise Security. |
| Source | The vendor the patch originates from, for example Microsoft. |
How compliance is calculated
For each patch, compliance is the share of devices that needed the patch and have received it:
Compliance % = Remediated / (Remediated + Applicable) × 100
| Term | Meaning |
|---|---|
| Remediated | Devices on which the patch was applicable and has been successfully deployed, so the patch is no longer relevant. |
| Applicable | Devices on which the patch is still relevant and has not yet been successfully deployed. |
Because the denominator is the total population of devices that ever needed the patch, a patch that has been deployed to every relevant device shows 100% compliance, and a patch that has not yet been deployed anywhere shows 0%.
Deployment status
The report can also show deployment progress from the point of view of the deployments you have created, rather than the devices that need the patch:
Deployment % = Remediated / Targeted × 100
Here Targeted is the number of devices that a deployment of the patch was sent to. If a patch has not been deployed at all (Targeted = 0), the deployment status is shown as N/A. The same red, amber and green thresholds apply.
Compare the two figures to distinguish between patches that were never deployed (low compliance, N/A deployment) and patches whose deployments were sent but have not completed on all devices (low compliance, low deployment %).
Exporting the report
To keep a copy for audit purposes, export the report:
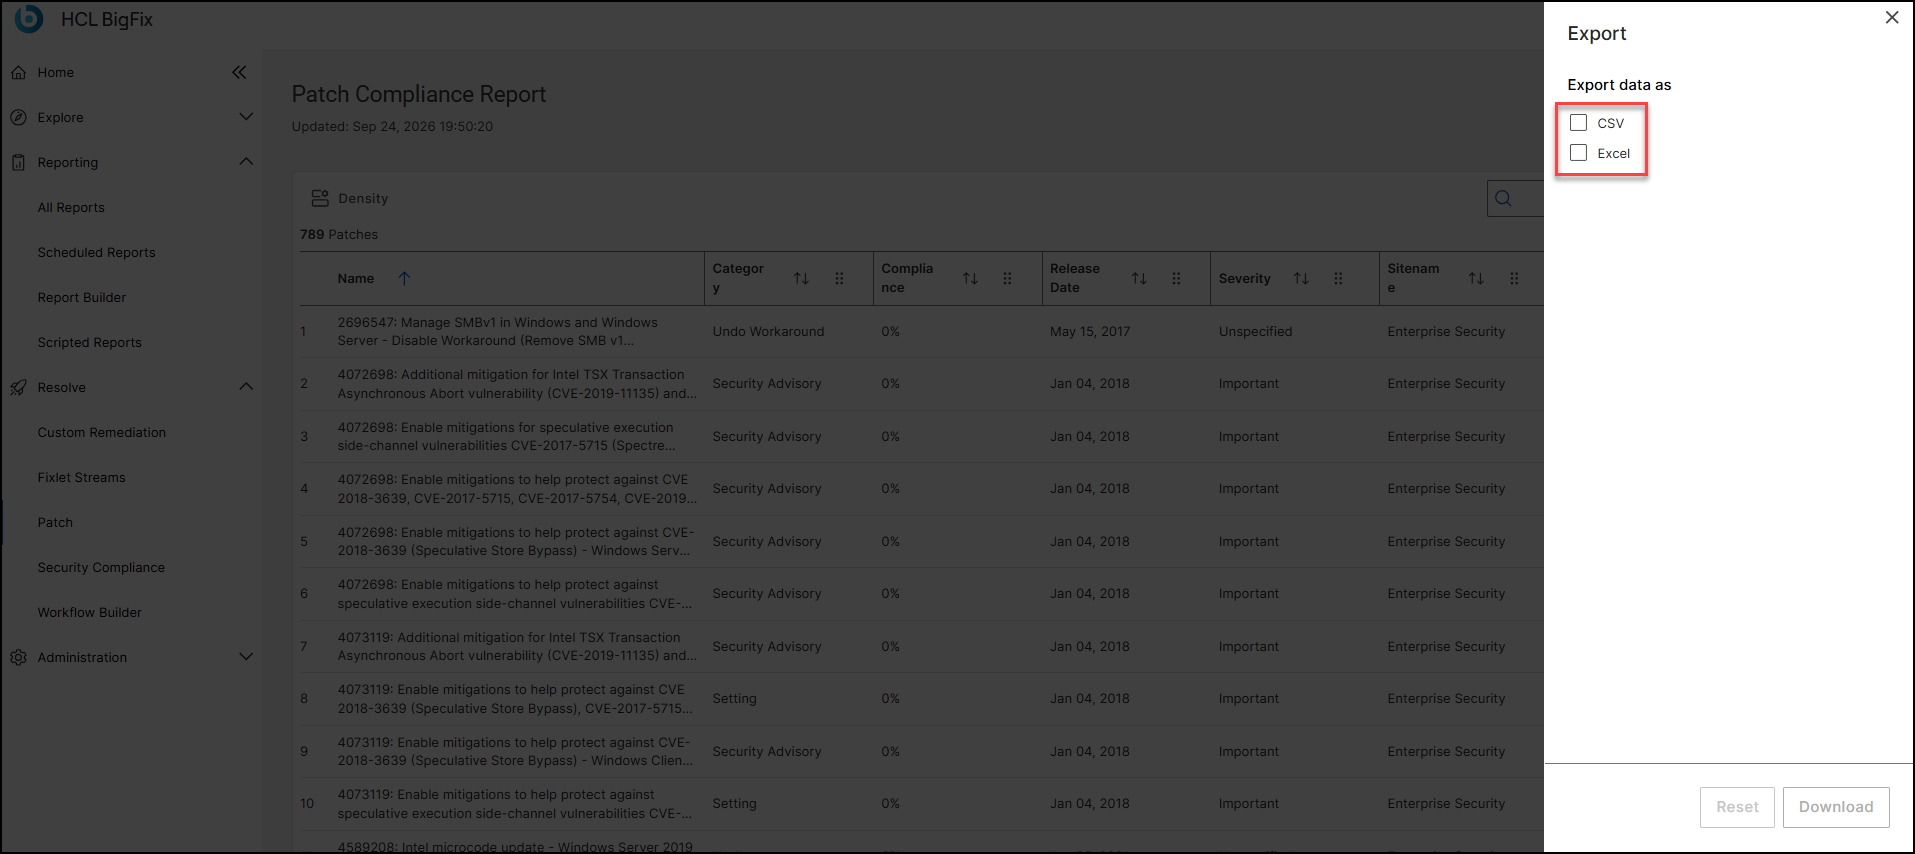
- Click the Export icon in the toolbar to open the Export panel.
- In the panel, under Export data as, select one or both checkboxes: CSV and Excel.
- Click Download to generate the file in the selected format or formats, or click Reset to clear your selection.
- Close the panel using the X icon in the top-right corner.