

Common Functionalities
Familiarize yourself with the functionalities that are available across modules. These features help you to effectively manage users, devices, and deployments and enhance your management capabilities.
Filtering Data
Filtering allows you to view specific subsets of data based on defined criteria. You can narrow the list of displayed data by applying filters based on specific properties and conditions. The Filter data window helps you define one or more filter conditions to refine your results.
Use filters to quickly locate devices that match defined criteria such as operating system, compliance status, or configuration type.
- In the List View, click the Filter
 icon in the upper-right corner.
The Filter data window appears.

- In the Filter data window, select the top level filter condition:
-
Single condition: Applies a single block of filter conditions to your data.
-
Multiple condition (Criteria: OR): Displays results that meet the criteria of any of the defined filter blocks.
-
- Under Filter block 1, select the block-level condition:
-
Single condition: Applies one condition within the filter block.
-
Multiple condition (Criteria: AND): Displays results that meet all the conditions defined within this specific block.
-
- Define the criteria for Condition 1:
-
From the Property drop-down list, select the property you want to filter by.
-
From the Operator drop-down list, choose a comparison operator.
-
In the Value field, enter or select the matching value.
-
- (Optional) Click Remove all to clear your configured conditions and start over.
- Click Apply. The list view refreshes to show only the devices or fixlets that meet the specified conditions.
- You can define multiple conditions using AND or OR logic to refine your results.
- The applied filter remains active until you close the Filter data window or manually clear the input fields and click Apply again.
- Filtering is available only within the active session; filters reset when you reload the page.
Manage Reports
The Manage Reports feature allows users to save, load, and organize custom reports generated within the BigFix UI. This feature helps preserve frequently used report views or filter conditions in Device Explorer and Fixlet Explorer. Reports saved in one application (for example, Device Explorer) are automatically listed in the All Reports page, allowing centralized management and quick access.
The Manage Reports panel slides out when you select Manage Reports from the upper-right corner of the List View. It provides two tabs:
- Save Report – to store a new report configuration.
- Load Report – to view and reopen previously saved reports.
Key Features:
- Save a report with a meaningful name and optional description.
- Load existing reports to reapply saved filters or data views.
- Manage reports across multiple BigFix UI applications.
- Access user-specific saved reports for personalized workflows.
- In the Device Explorer or Fixlet Explorer List View, click Manage
Reports.
The Manage Reports panel slides out when you select Manage Reports from the upper-right corner of the List View
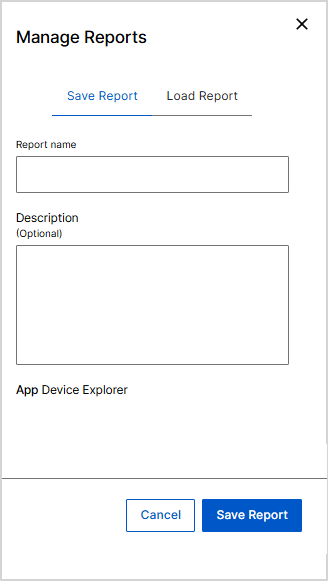
- Enter a Report name.
- Optionally, provide a Description to help identify the report’s purpose or filter set.
- Verify the associated application (for example, App Device Explorer).
- Click Save Report.
- The report now appears under the All Reports page for future access.
- Click Manage Reports on the List View toolbar or open
the All Reports page.

- Select the Load Report tab.
- Review the list of available saved reports.
- Click a report name to load it
The associated filters, columns, charts and view settings are automatically restored.
-
(Optional) Edit filters or sorting and re-save the report with a new name if needed.
- Reports are saved per user and are not shared globally.
- When loading older reports, ensure the related data sources (devices, fixlets, etc.) are still available in your environment.
- Saved report names must be unique within each application.
Columns
Use the column chooser to control which columns appear in the data table.
- Above the table, select Column. The column chooser opens.
- Optional: In the search box, enter a column name to filter the list.
- Select the checkbox next to each column you want to show, and clear the checkbox for each column you want to hide. You can display up to 63 columns; the panel shows the current limit as Max items limit: 63.
- Optional: Select Reset to restore the default column selection.
- Select Apply. The table updates to show the columns you selected.
Density
Use the density control to set the row spacing of the data table.
- Above the table, select Density. A menu opens.
- Select the row spacing you want:
- Compact – fits the most rows by reducing row height.
- Standard – the default row height.
- Comfortable – adds space between rows for easier reading.
The table updates immediately to use the spacing that you selected.
Sorting Data
Sorting can be applied to individual columns, allowing users to arrange data according to their current focus or needs. This feature enhances data readability and ensures users can efficiently work with large sets of information by keeping relevant details readily accessible. Sorting organizes your data in ascending or descending order based on a selected column. Each column in the list table includes a Sort icon (double arrows) that allows you to organize your data alphabetically or numerically
- To sort a column: Select the Sort icon in the column
header.
-
The first selection sorts the data in ascending order (for example, A to Z or 1 to 10).
-
Selecting the icon again sorts the data in descending order (for example, Z to A or 10 to 1).
-
- To clear a sort: Select the icon until the arrows return to their default, neutral state.
Exporting Data
The Export Data option is available on Deployments, CyberFOCUS, All reports, and list view pages of Devices, Fixlets. Use this option to download tabular report information from list view pages for offline analysis or record-keeping.
It enables users to export visible report data—filtered, sorted, or customized to commonly used spreadsheet formats like CSV or Excel.
This allows users to review device inventories, fixlet compliance, or deployment summaries outside the BigFix UI environment.
How to Export Data:-
Click the Export Report icon located in the upper-right corner of the page.
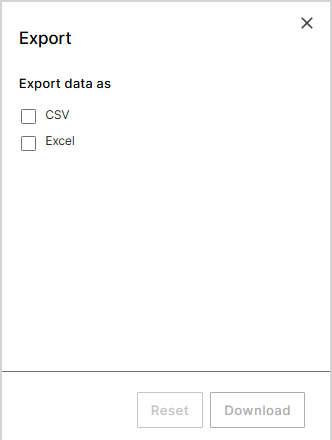
The Export panel slides out and displayed.
-
In the Export panel that appears:
- Select CSV to export raw comma-separated data for importing into other tools.
- Select Excel to export data into a formatted spreadsheet (.xlsx) file.
-
Choose Data to Export: Depending on the module and screen you are in, you have the option to export the entire dataset visible on the screen or apply filters to export a specific subset of data.Note:
- If applicable, apply filters or selections within the module to export only the necessary data, reducing file size and focusing on relevant information.
- Depending on your user role and permissions, access to certain data subsets may be restricted.
-
After selecting the desired format, click Download. The file gets generated and downloaded to your device.
- (Optional) Click Reset to clear all selections before downloading again.
Exporting Charts
The Export charts option is available on CyberFOCUS and Overview pages of Devices, Fixlets. Use this feature to capture dashboard visualizations from overview pages as image or document files for reporting and presentation purposes. It allows users to download graphical widgets such as bar charts, donut charts, or summary tiles that visualize system compliance, device types, or OS distribution trends.
Charts can be exported as JPEG, PNG, or PDF files, making it easy to include BigFix data visuals in internal reports or external presentations.
How to Export Charts-
Click the Export Report icon located in the upper-right corner of the page.
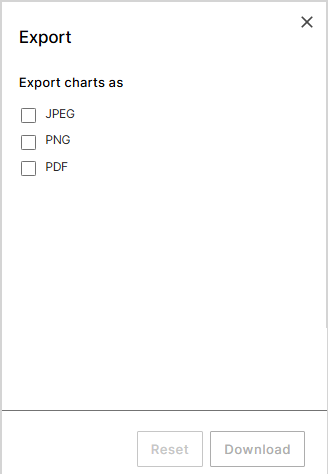
The Export panel slides out and displayed.
-
In the Export panel, select one or more of the following options:
- JPEG – Exports charts as compressed images suitable for quick sharing.
- PNG – Exports charts in higher resolution for professional documentation.
- PDF – Consolidates all visible charts into a single report document.
-
Choose Data to Export: Depending on the module and screen you are in, you have the option to export the entire dataset visible on the screen or apply filters to export a specific subset of data.Note:
- If applicable, apply filters or selections within the module to export only the necessary data, reducing file size and focusing on relevant information.
- Depending on your user role and permissions, access to certain data subsets may be restricted.
-
Confirm and Download: After selecting the desired format click Download. The file gets generated and downloaded to your device.Note: If you have choosen more than one format to export, the files will be downloaded in a single zip folder.
- (Optional) Use Reset to deselect all options before making a new export.
Viewing chart data in a table
Each chart has an icon in its top-right corner that opens the chart's data as a table, with options to copy or export it.
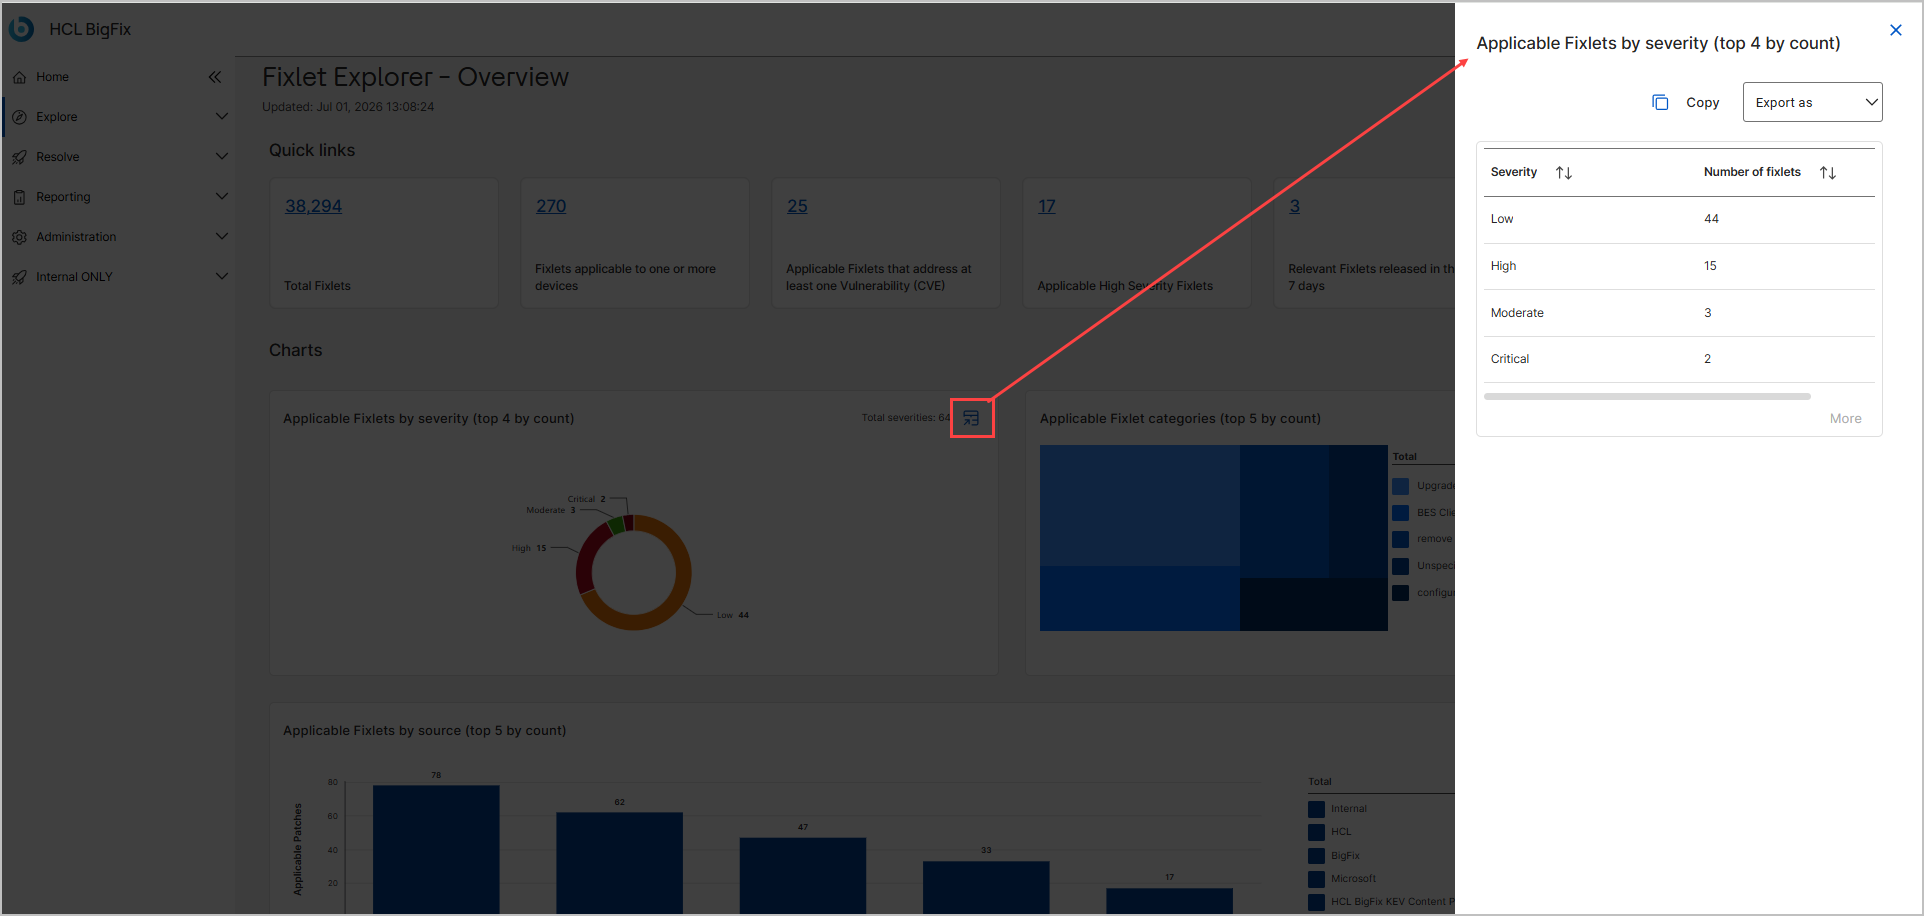
Each chart can display its data as a table that you can copy or export
- Locate the chart that you want, such as Applicable Fixlets by severity (top 4 by count).
- In the chart's top-right corner, select the See data in data table format with download options icon. The chart's data panel opens and displays the data as a table, such as Severity and Number of fixlets.
- Optional: To sort the table, select the sort icon in a column header.
- Optional: If a More link appears, select it to load additional rows.
- To copy the table to the clipboard, select Copy.
- To download the data, select Export as and choose a format.
- To close the panel, select Close (X).
Help Center
The Help Center provides quick access to support and documentation resources directly from the BigFix UI. You can open it by clicking the ? icon located in the upper-right corner of the screen.
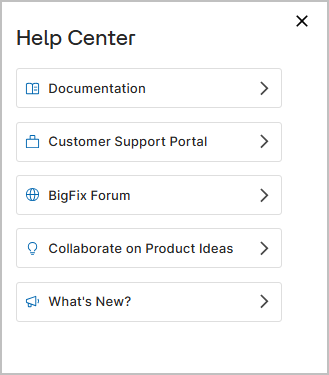
The Help Center panel slides out from the right side and includes the following options:
- Documentation – Opens the BigFix product documentation site for detailed feature and usage guidance.
- Customer Support Portal – Navigates to the official BigFix support site where users can raise tickets or review existing cases.
- BigFix Forum – Redirects to the BigFix community discussion forum for peer assistance and technical insights.
- Collaborate on Product Ideas – Opens the BigFix idea portal where users can share feature suggestions and vote on proposed enhancements.
- What’s New? – Displays information about recent updates, new features, and product release notes.
Each option launches an external site in a new browser tab, allowing users to seamlessly access the latest information and resources without leaving the BigFix UI.