

My Dashboard
The customizable dashboard is the home page of the BigFix UI. It shows the applications and reports that you use most as a grid of widgets that you can add, remove, and reorder to match your workflow.
After you sign in to the BigFix UI, the customizable dashboard opens as the home page. From the dashboard, you open the application or report that you want, either by selecting its widget or by using the side navigation. To return to the dashboard at any time, select My Dashboard in the side navigation.
The page opens with the title Welcome to HCL BigFix and the prompt Choose a module to get started. Use the Customise page button to choose which widgets appear, and the Restore defaults button to return to the default layout.
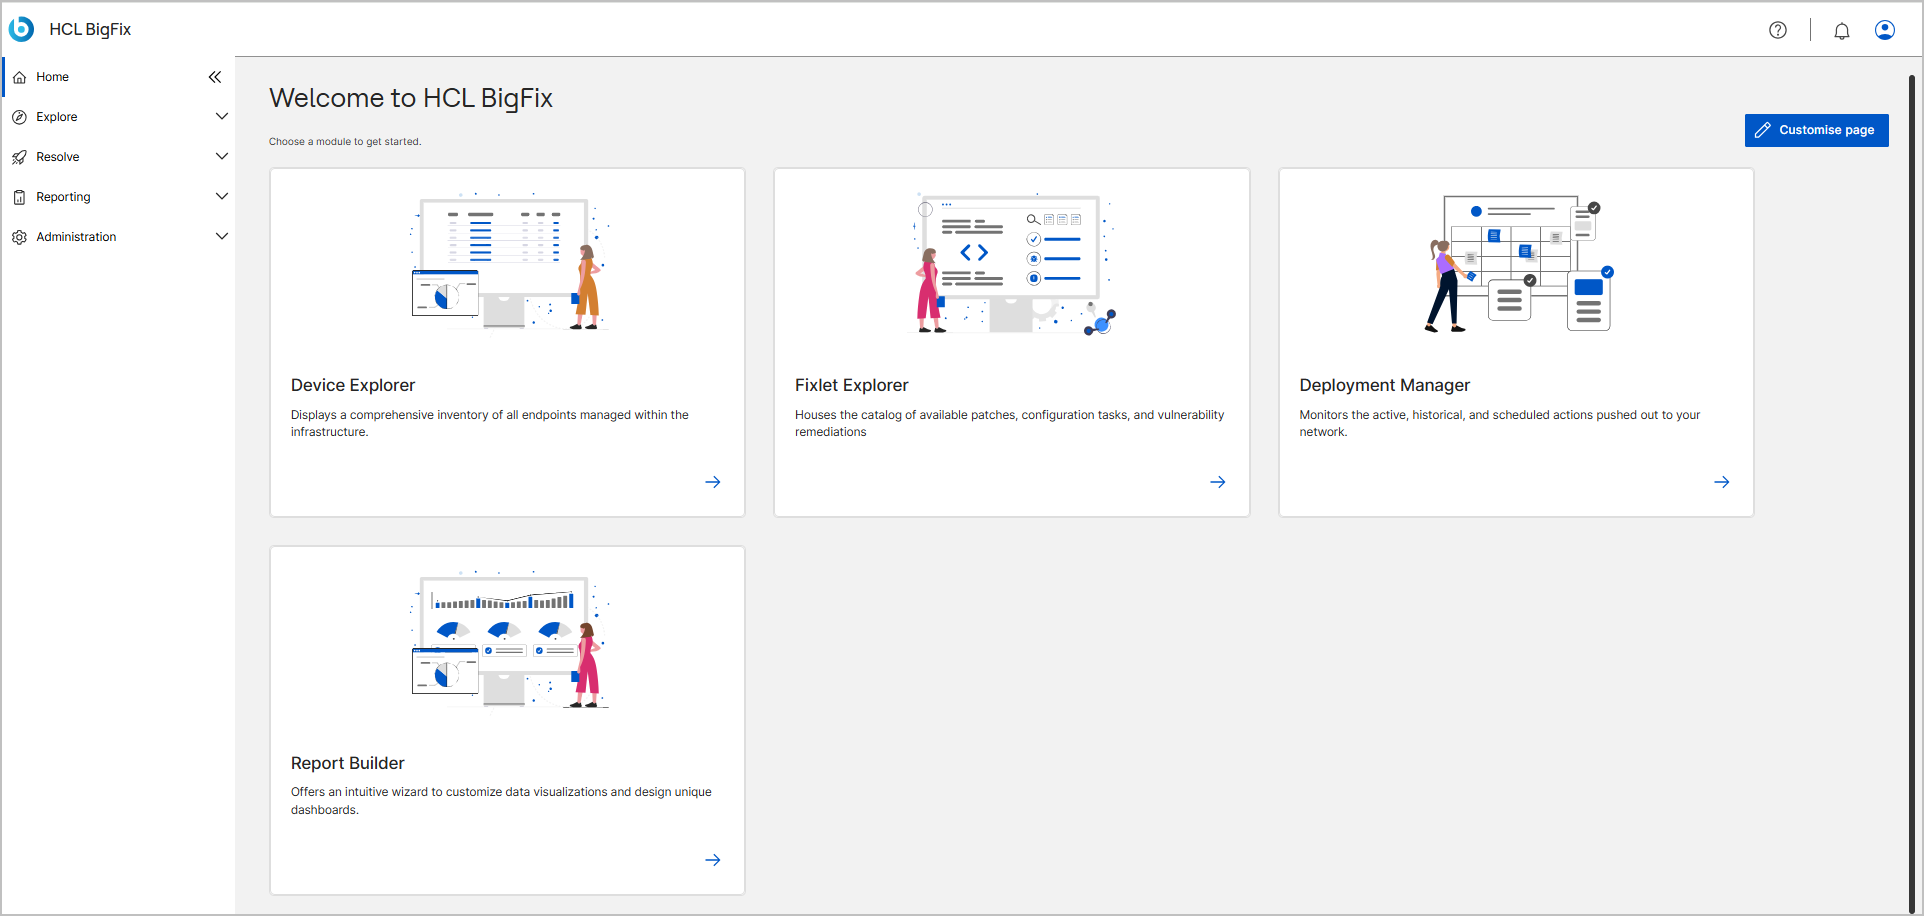
The first time you open the dashboard, the BigFix UI shows a default set of cards. You can then tailor the layout: add or remove cards, and drag them into the order that you want. The BigFix UI saves your layout to your profile, so it persists across sessions.
Widget cards
Each application or report on the dashboard appears as a card. A card shows an illustration, the application or report name, and a short description. Each card also provides the following controls. Pause over a control to display its tooltip, which names the card that the control acts on, such as Drag Devices Explorer - List view.
| Control | Description |
|---|---|
| Drag (grid icon, upper-left corner) | Moves the card to a different position in the grid. Select and hold the icon, and then drag the card where you want it. |
| Delete (trash icon, upper-right corner) | Removes the card from the dashboard. The application or report itself isn't deleted, and you can add the card again from the Customize page panel. |
| Open (arrow icon, lower-right corner) | Opens the application or report that the card represents. |
To rearrange the cards on your dashboard by using drag-and-drop:
- Pause over the Drag icon in the upper-left corner of the card that you want to move. A tooltip confirms which card you are about to move, such as Drag Devices Explorer - List view.
- Select and hold the Drag icon.
- Drag the card to the position that you want in the grid. The surrounding cards shift to show where the card will land.
- Release the card to drop it in the new position.
The BigFix UI saves the new arrangement to your profile automatically, so the layout is the same the next time you open the dashboard.
To remove a card from your dashboard:
- On the card that you want to remove, select the Delete icon.
To open an application or report from your dashboard:
- On the card that you want to open, select the Open icon. The application or report opens.
Customise page
Use the Customize page panel to choose which application and report cards appear on your dashboard. The panel lists only the applications and reports that you have permission to view, and it provides an Application tab, a Report tab, and a Search box.
To personalize your dashboard:
- Select Customise page to open the Customise
page panel.
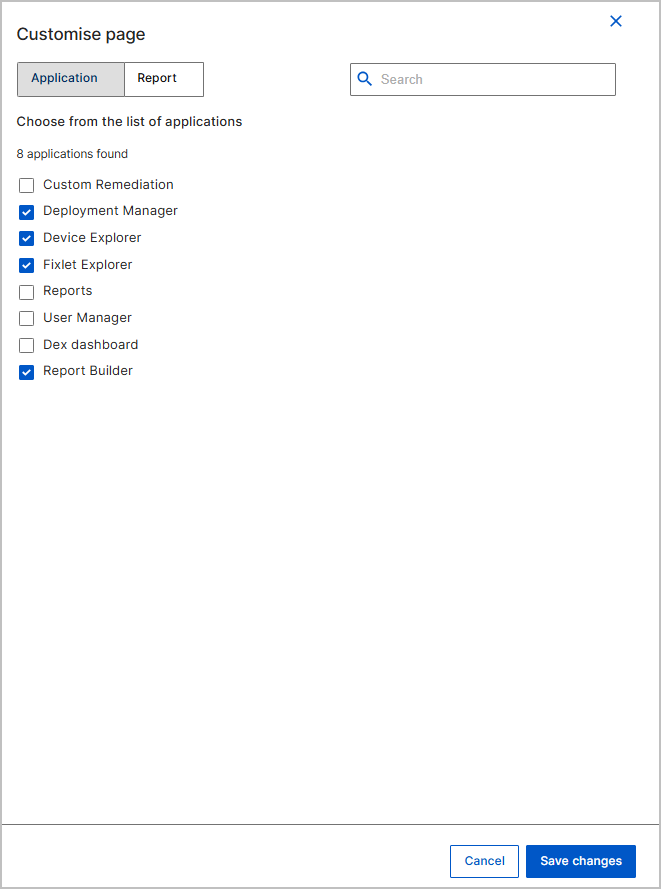
- On the Application tab, select or clear the checkbox next to each application. A selected application appears as a widget; a cleared application is removed. To filter the list, enter a name in the Search box.
- On the Report tab, select the checkbox next to each report that
you want to add as a widget. Use the columns described in Report tab columns to identify the correct
report.

- Select Save changes to apply your selections, or select Cancel to close the panel without changing your dashboard.
The dashboard then shows the cards that you selected.
| Column | Description |
|---|---|
| Name / Label | The name of the report. |
| App | The application that the report belongs to, such as Report Builder or Device Explorer. |
| Author | The user who created the report. |
| Visibility | Whether the report is private or shared. |
| Schedule | Whether the report runs on a schedule. |
Restore defaults
The Restore defaults button, next to Customize page in the top-right corner of the dashboard, discards your personalization and returns the dashboard to the factory default layout. Restoring the defaults removes any cards that you added, brings back any default cards that you removed, and resets the card positions.
To return the dashboard to its default set and arrangement of cards:
- Select Restore defaults.
The dashboard immediately shows the default cards in their default positions, and the BigFix UI saves this layout to your profile. You can personalize the dashboard again at any time.