
Data aggregation by endpoints
This section explains the categorisation of score data that is visible on the dashboard and upon further drilling down of the respective score pages.
- Group-level endpoint view
- Single-level endpoint view
Group-level endpoint view
The main page of the DEX dashboard shows a group-level score calculation that functions as the high-level aggregation plane. Overview score widgets shows the overall DEX score and the scores for device, application and sentiment score (based on the surveys). They give an indication of the overall, group-level health state of the endpoints. Click on the “>” icon within the score widget (as shown in the screenshot below) to navigate to the score page, which displays the individual score.
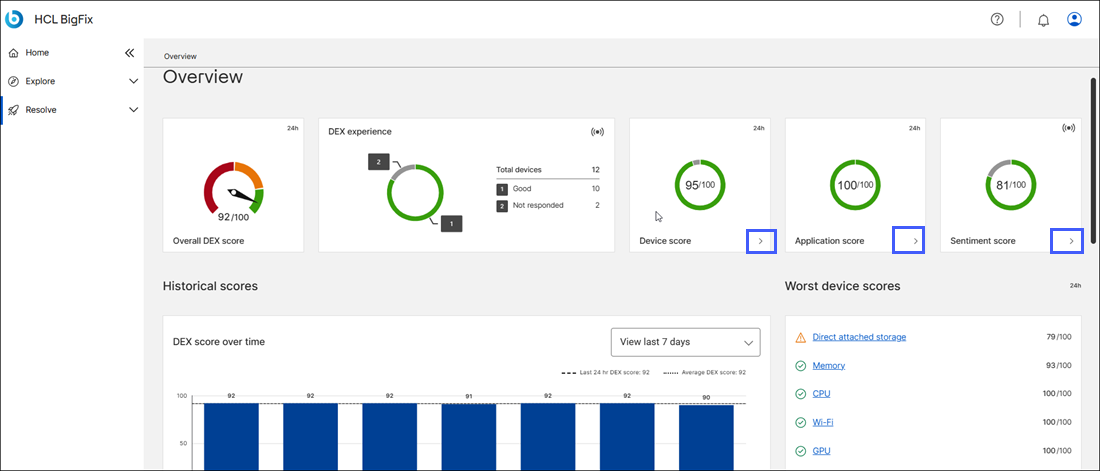
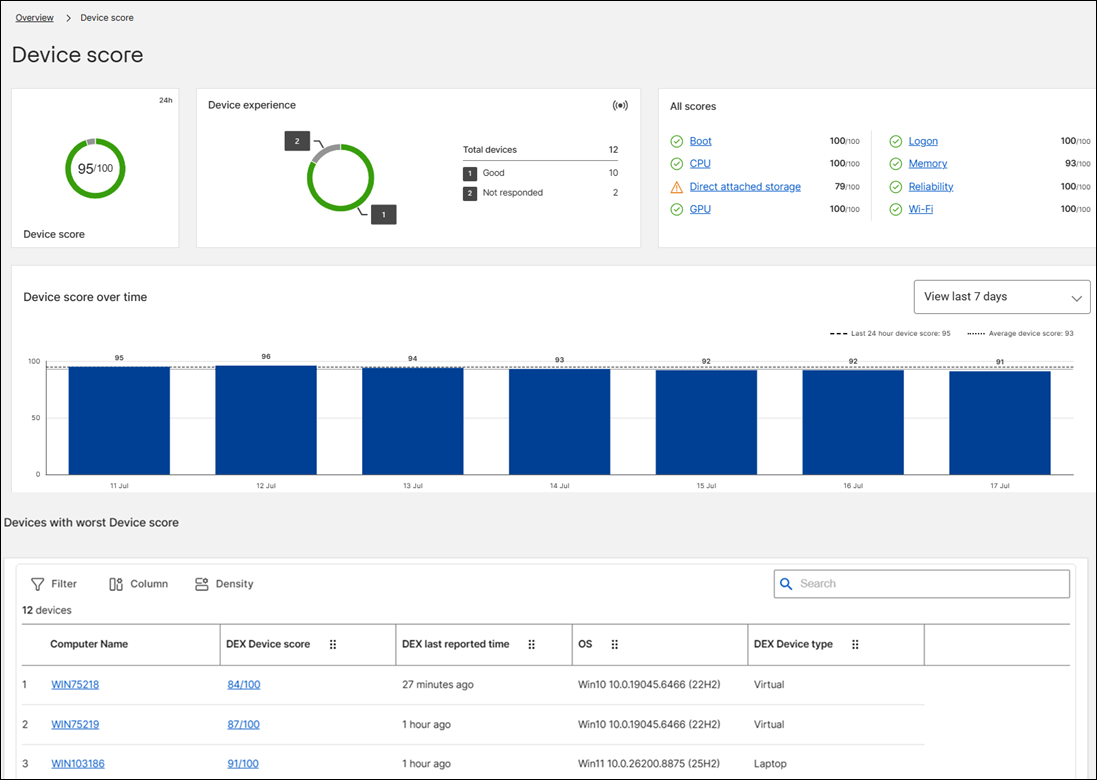
Clicking on one of the leaf node, for example Boot, takes your to the Boot score group of devices view.
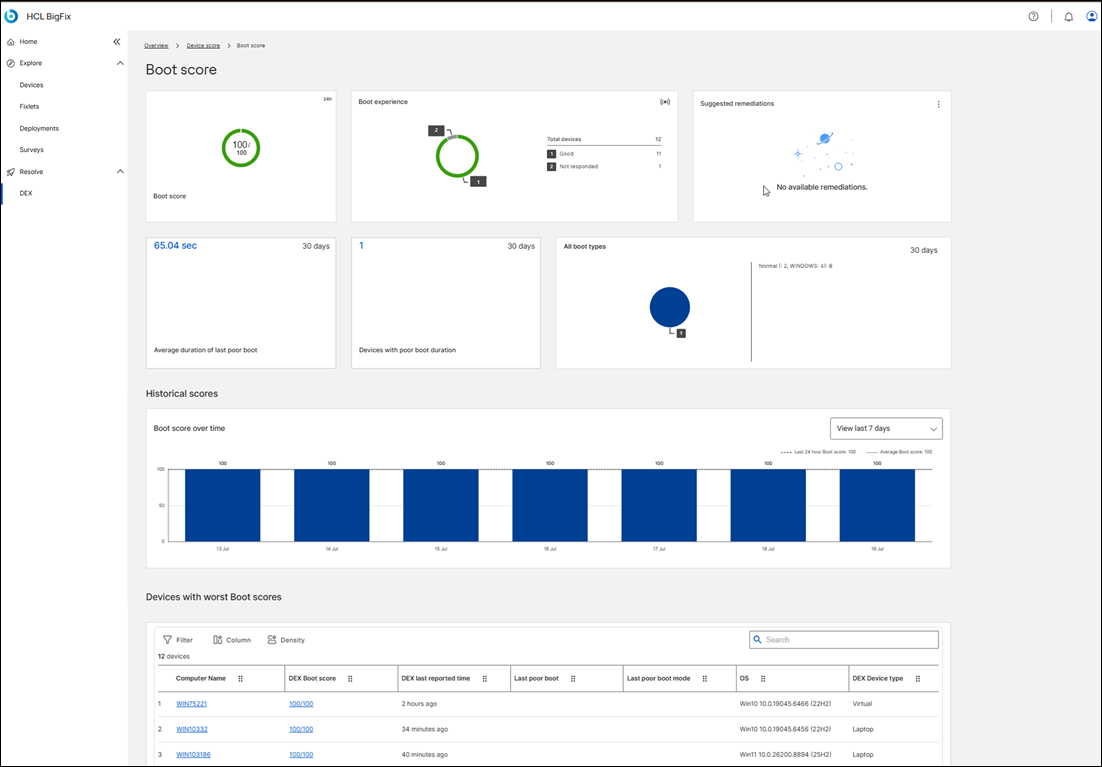
User experience of the group-level view
- Score: The overall score of all devices/applications/sentiments.
- experience: Leaf scoresbased on the thresholds defined within the DEX core, which includes parameters, such as good, fair, not available.
- all scores: scores around each areas, such as CPU, memory, etc.
- score over time: score shown for a date rang: 7 days or 30 days.
- worst scores for devices/applications/sentiments: top 5 worst scores across endpoints for the selected score type
Single-level endpoint view
The single-level endpoint views provides an isolated, detailed analysis exclusively on a single device/application module, package, or specific version string.
Navigating to the single-level view
- Once you click on a single endpoint in above group-level view, you will
reach the single endpoint view of that leaf category. takes you to the single endpoint view.
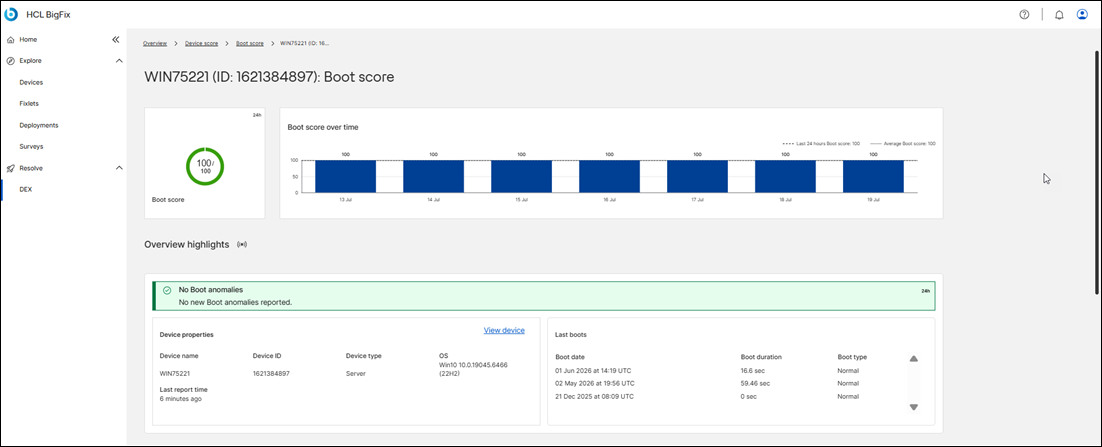
-
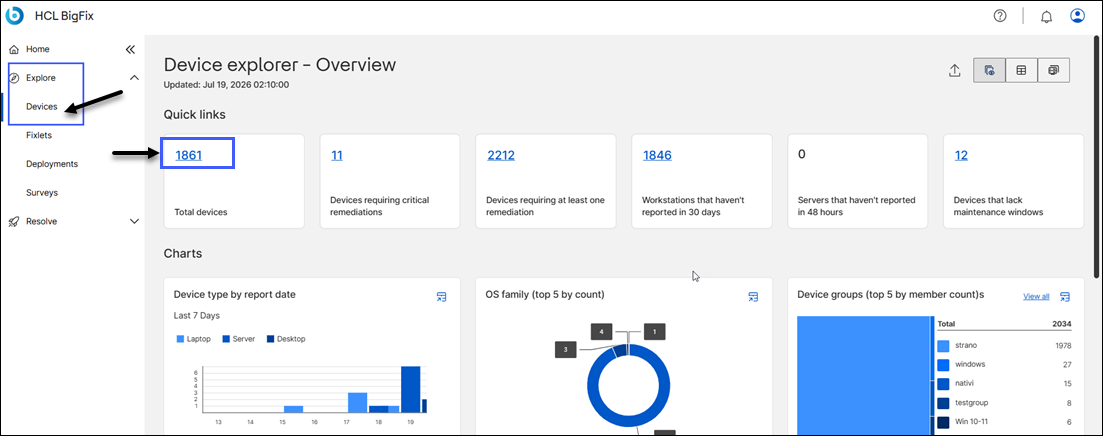
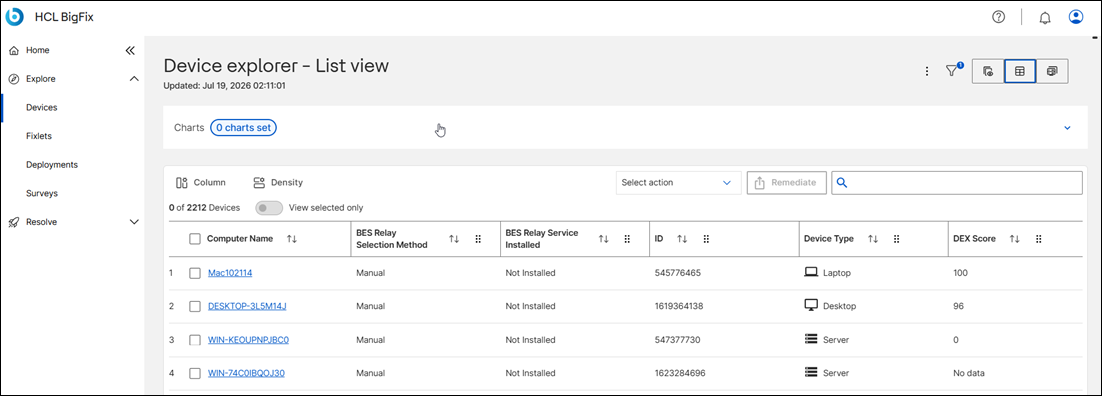
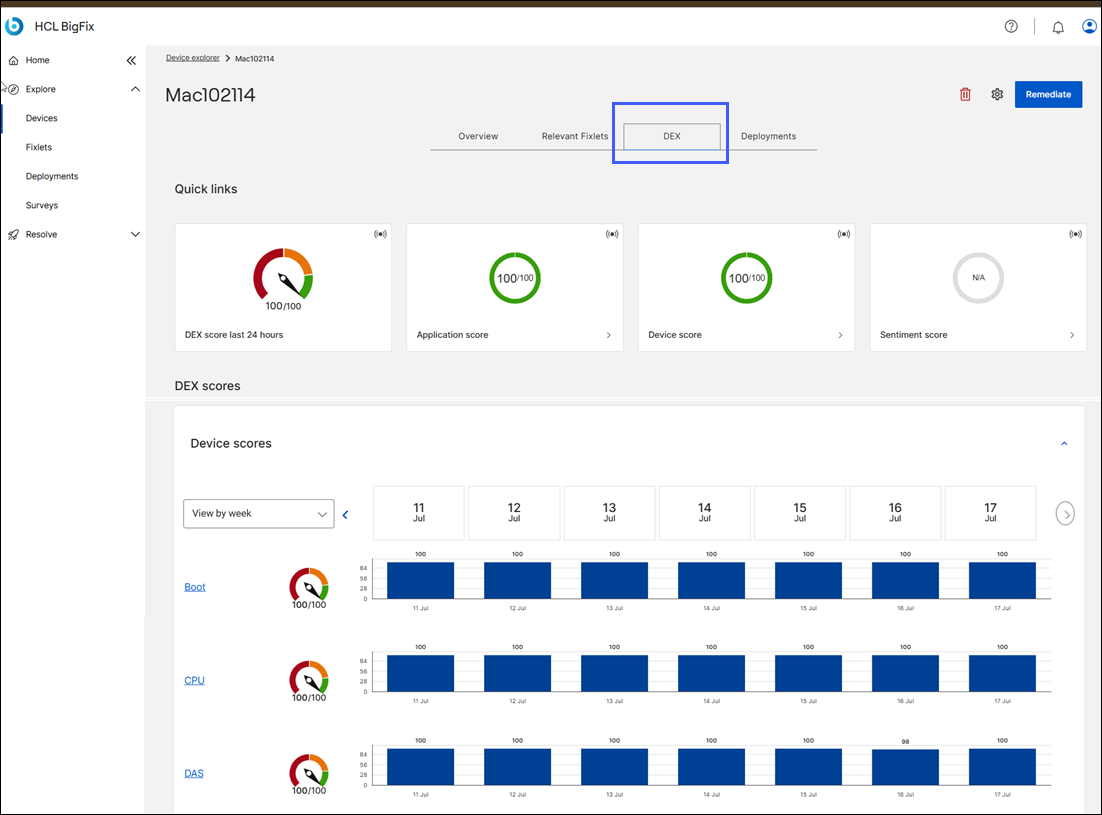
Another navigation to get the single endpoint view is through the .