
IVR v.5 on BFUI
This section explains how to use IVR in the BigFix UI: open the application, read the dashboard, work with vulnerability data, and remediate vulnerabilities. It applies to every user whose role includes IVR, not only administrators.
With IVR in the BigFix UI, you can:
- View vulnerability trends in charts on the Overview tab.
- Review vulnerabilities in the Vulnerability view and the affected devices in the Device view.
- Search, filter, and export your vulnerability data.
- Save a report of your current view and load it again later.
- Remediate vulnerabilities by deploying Fixlets to devices, starting from either the vulnerabilities or the devices.
Open IVR
In the left navigation pane, expand Resolve, and then click Integrated Vulnerability Remediation. See Resolve in the BigFix UI User’s Guide.
The Integrated Vulnerability Remediation option appears only when both of the following are true:
- Your administrator has enabled the BigFix Integrated Vulnerability Remediation site.
- Your role includes the IVR application. See Task 3: Grant IVR access to other users (optional).
If you don't see the option, contact your BigFix administrator. Administrators: see Troubleshooting.
The IVR dashboard
The IVR dashboard is the IVR-Scanner Import page. It shows an Updated time stamp for the most recent data refresh and has three tabs: Overview, Vulnerability view, and Device view.
At the top of the Vulnerability view and Device view tabs, two indicators show the status of the IVR automation:
- Last Automation Run shows when the most recent run finished.
- Next Expected Automation Run shows when the next run is expected to start. IVR refreshes scanner data every 12 hours by default.
Header controls
- Ellipsis icon (three vertical dots): opens a menu that includes Export. See Export data.
- Filter icon: opens the Filter data widget. See Filter vulnerabilities.
- Manage reports: saves or loads a report. See Save and load reports.
Overview tab
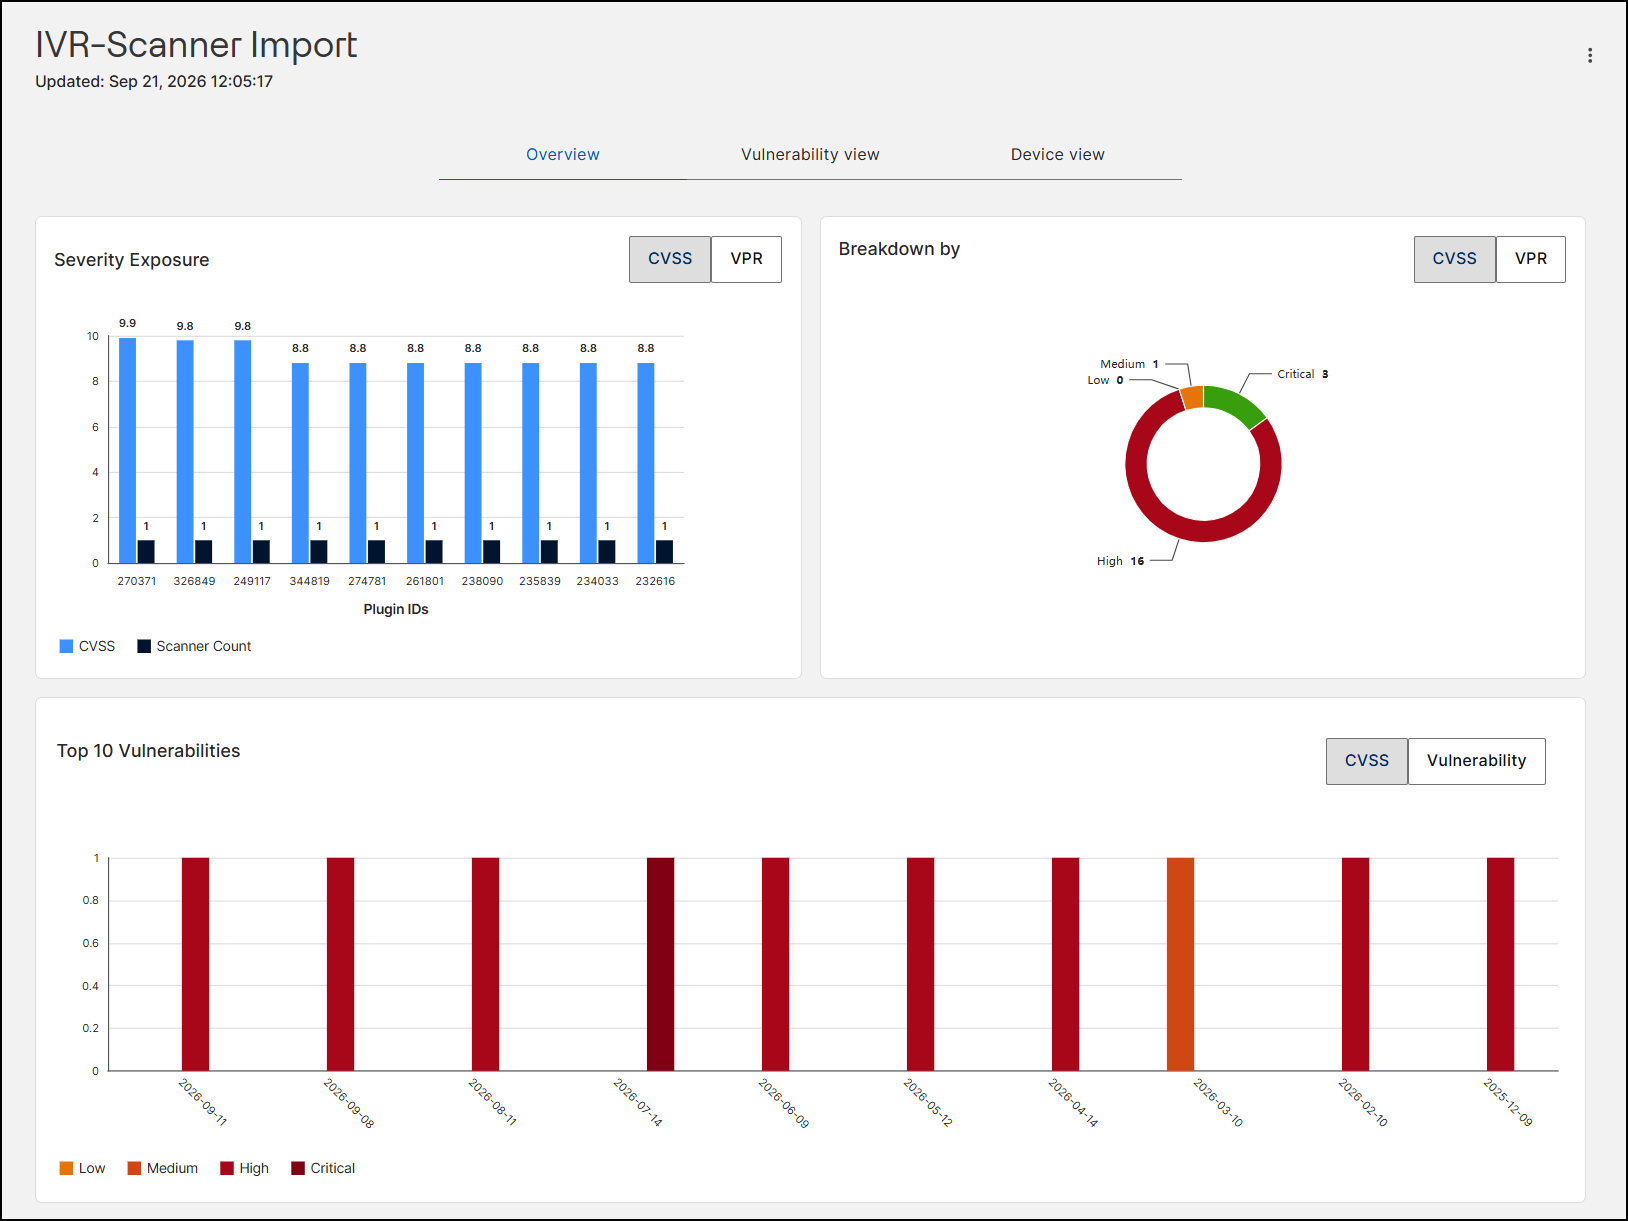
The Overview tab shows charts that help you decide which vulnerabilities to remediate first:
- Severity Exposure: a bar chart that plots, for each plugin ID, the vulnerability score and the scanner count side by side. Click CVSS or VPR to change the scoring model.
- Breakdown by: a donut chart that shows how vulnerabilities are distributed by severity (Critical, High, Medium, and Low). Click CVSS or VPR to change the scoring model.
- Top 10 Vulnerabilities: a timeline bar chart of the ten highest-ranked risks, plotted against their publication dates and color-coded by severity from Low to Critical. Click CVSS or Vulnerability to change the view.
Vulnerability view tab
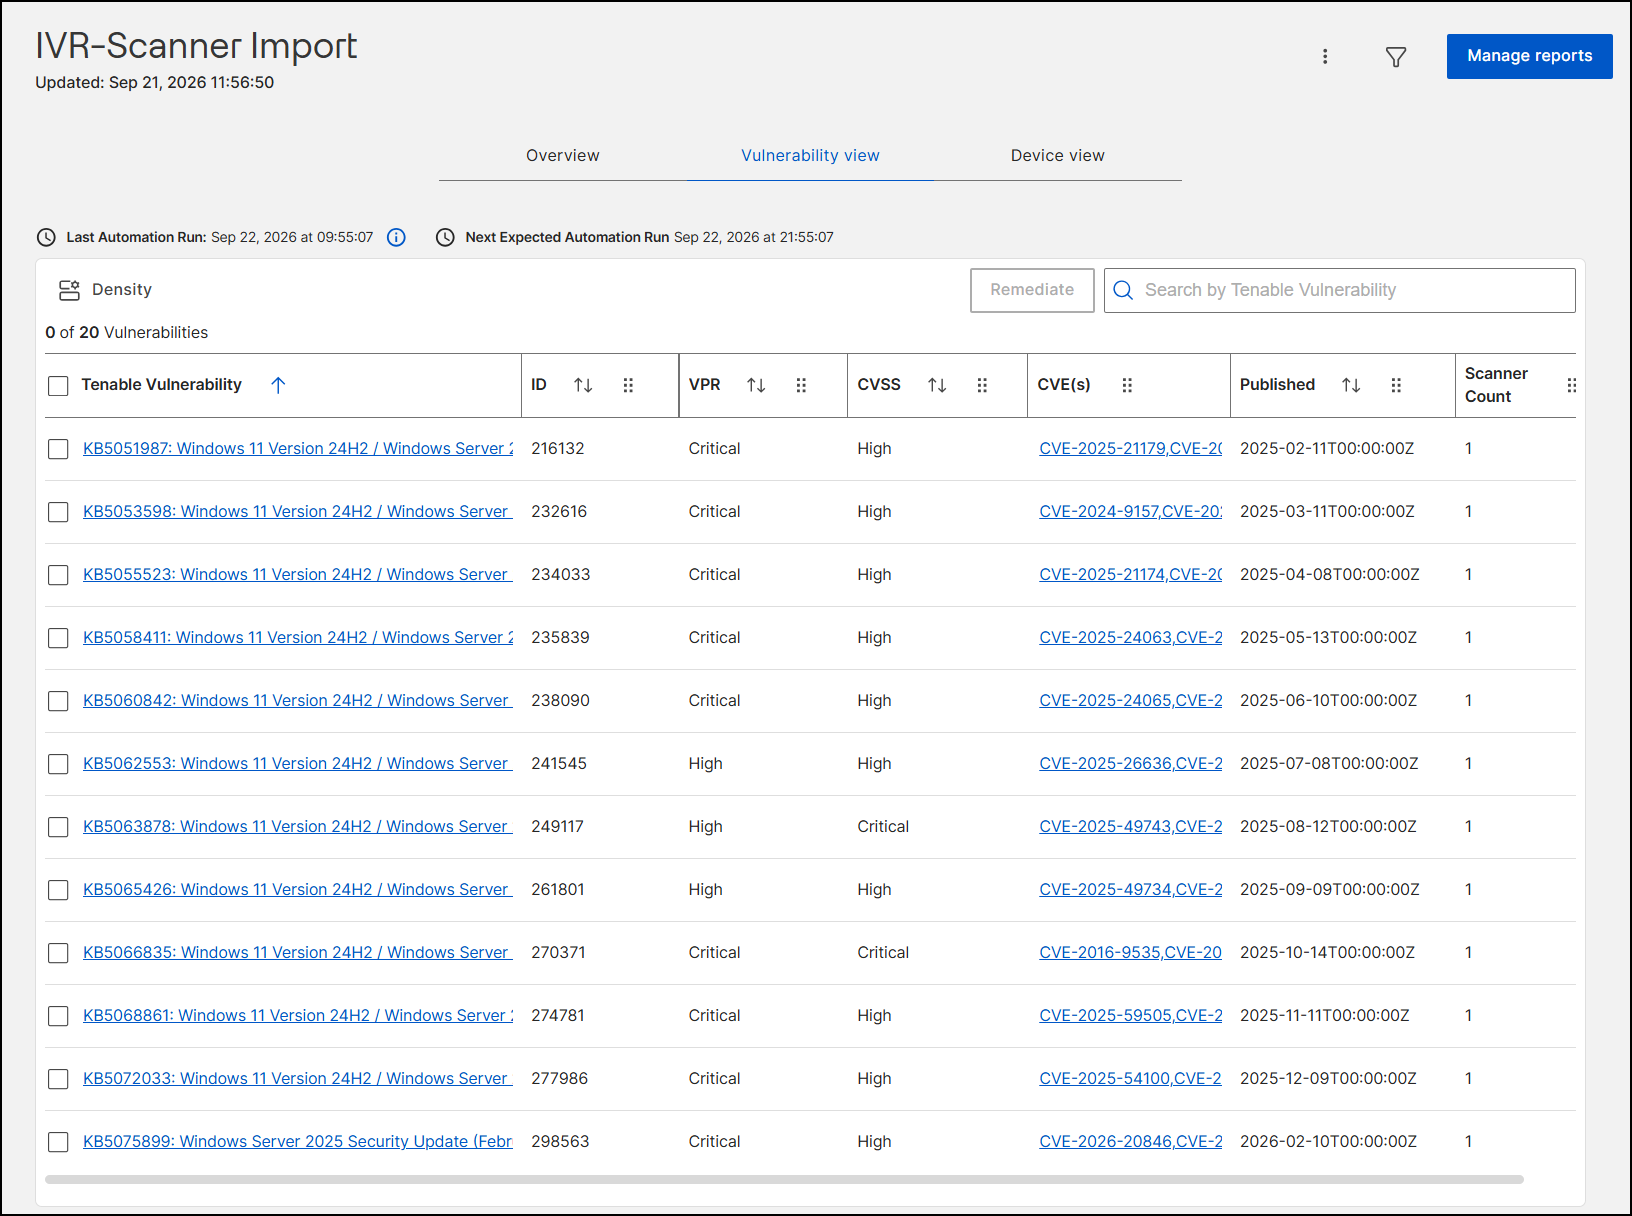
The Vulnerability view tab lists the active vulnerabilities in a grid. A counter above the grid shows how many vulnerabilities are selected (for example, "0 of 20 Vulnerabilities"). Use Density to change the row spacing, click the sort arrows in a column heading to sort the grid, and type in Search by Tenable Vulnerability to search the vulnerability names.
| Column | Description |
|---|---|
| Selection check box | Select one or more rows to act on them, for example, to remediate. The check box in the heading row selects all rows. |
| Tenable Vulnerability | The vulnerability name as identified by the scanner. Click it to open the vulnerability details page, which has the Vulnerability Information, Contents, Devices, and Deployment tabs. |
| ID | The unique numeric ID (plugin ID) of the vulnerability. |
| VPR | The Vulnerability Priority Rating, a dynamic rating (for example, Low, Medium, High, or Critical) that helps you prioritize remediation. |
| CVSS | The Common Vulnerability Scoring System severity (for example, High or Critical). |
| CVE(s) | The Common Vulnerabilities and Exposures identifiers. Each identifier is a link to its public entry. |
| Published | The date and time when the vulnerability was publicly disclosed. |
| Scanner Count | The number of devices on which the scanner detected the vulnerability. |
To fix vulnerabilities, select them and click Remediate. See Remediate vulnerabilities.
Device view
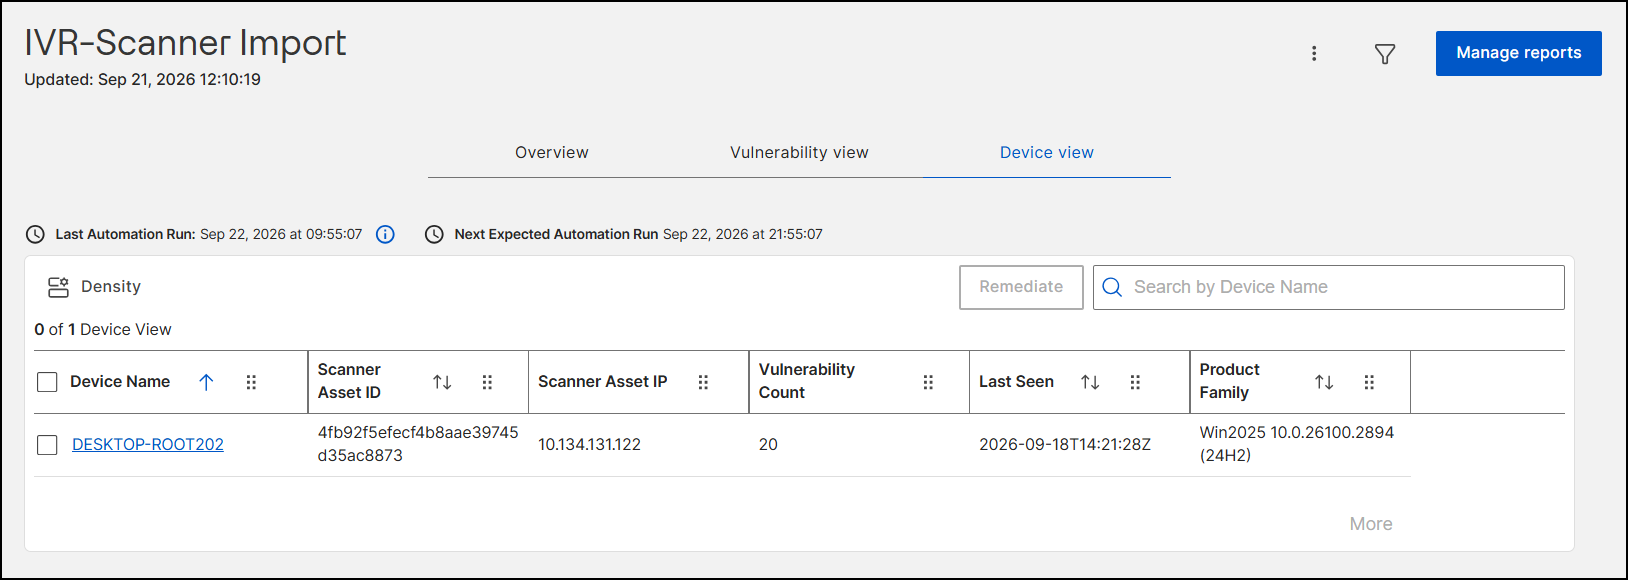
The Device view tab gives you a device-level dashboard. It lists only the devices that are relevant to IVR, not every device in Explore. Use this tab when you want to start from the devices instead of from the vulnerabilities.
Type in Search by Device Name to search the grid. The grid contains the following columns:
| Column | Description |
|---|---|
| Device Name | The name of the device. Click the name to open the device in Device Explorer. |
| Scanner Asset ID | The ID that the scanner assigned to the device. |
| Scanner Asset IP | The IP address that the scanner recorded for the device. |
| Vulnerability Count | The number of vulnerabilities found on the device. |
| Last Seen | The date and time when the scanner last saw the device. |
| Product Family | The operating system or product family of the device. |
View a device's vulnerabilities in Device Explorer
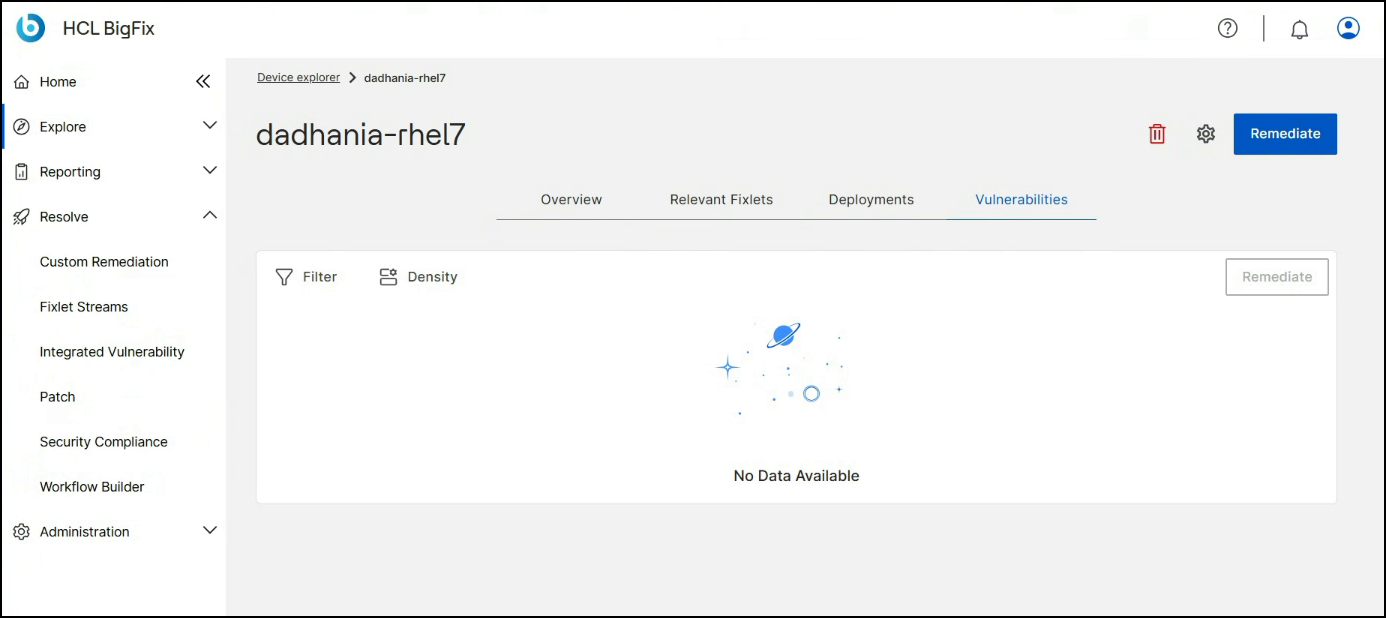
Click a device name to open it in Device Explorer. The Vulnerabilities tab lists the vulnerabilities that were found on that device. Use this path when you want to review a single device.
Work with dashboard data
Filter vulnerabilities
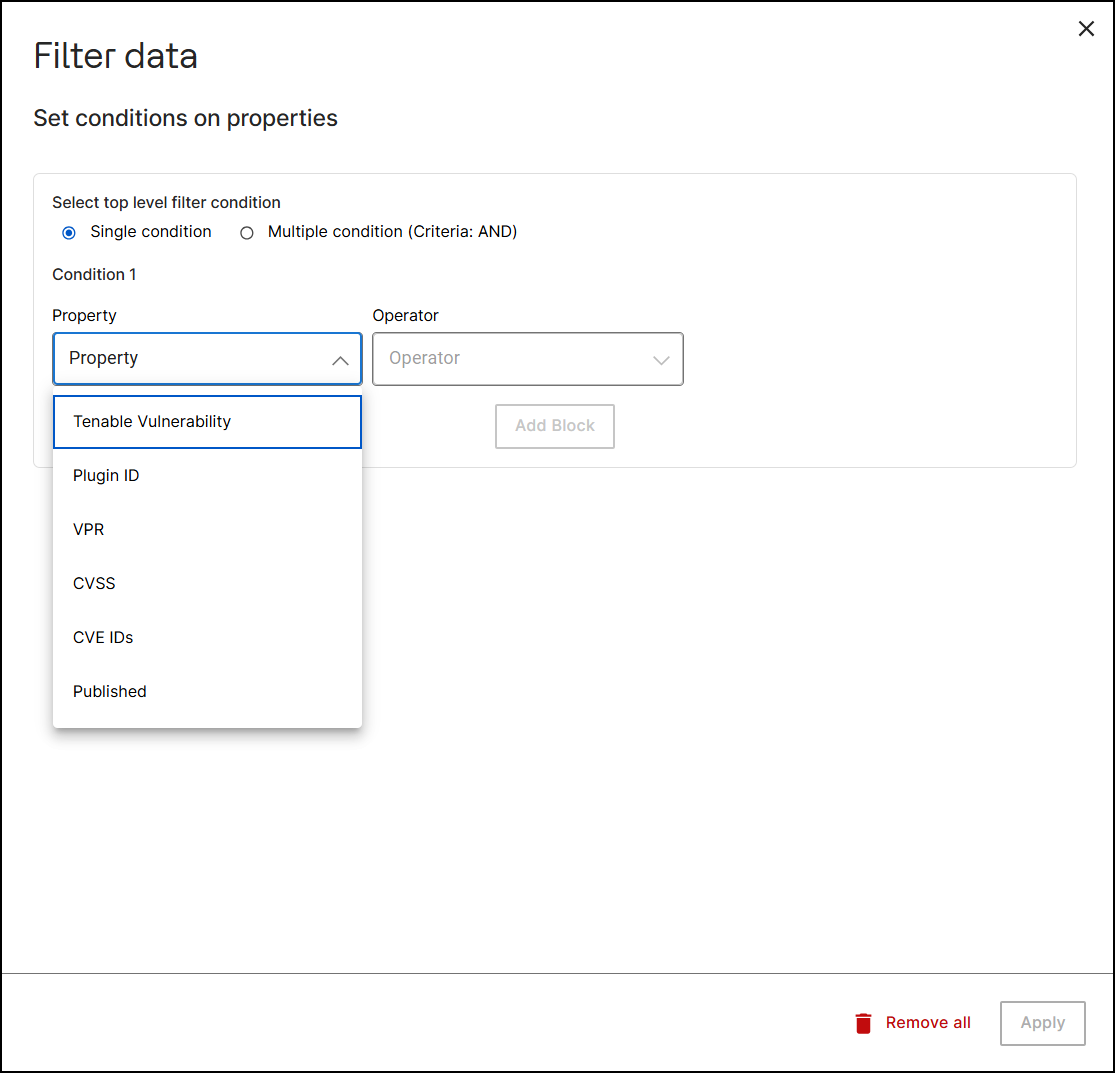
Use filters to find specific vulnerabilities in a large data set.
- On the Vulnerability view tab, click the Filter icon. The Filter data widget opens.
- Select Single condition or Multiple condition (Criteria: AND).
- Select a Property (Tenable Vulnerability, Plugin ID, VPR, CVSS, CVE IDs, or Published), an Operator, and a value.
- Click Apply.
While a filter is active, indicators appear above the grid so that you can see which filters are applied and clear them. To clear all conditions in the widget, click Remove all.
Export data
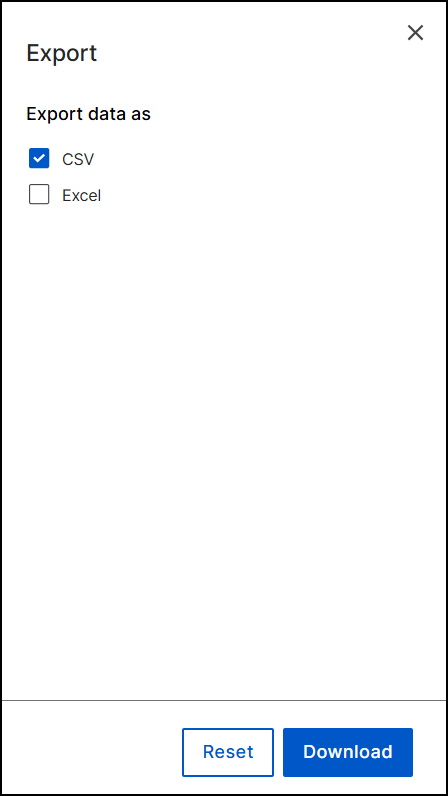
- Click the Ellipsis icon (three vertical dots) in the header controls.
- Click Export.
- In the Export panel, select CSV or Excel.
- Click Download. To clear your selection, click Reset.
Save and load reports
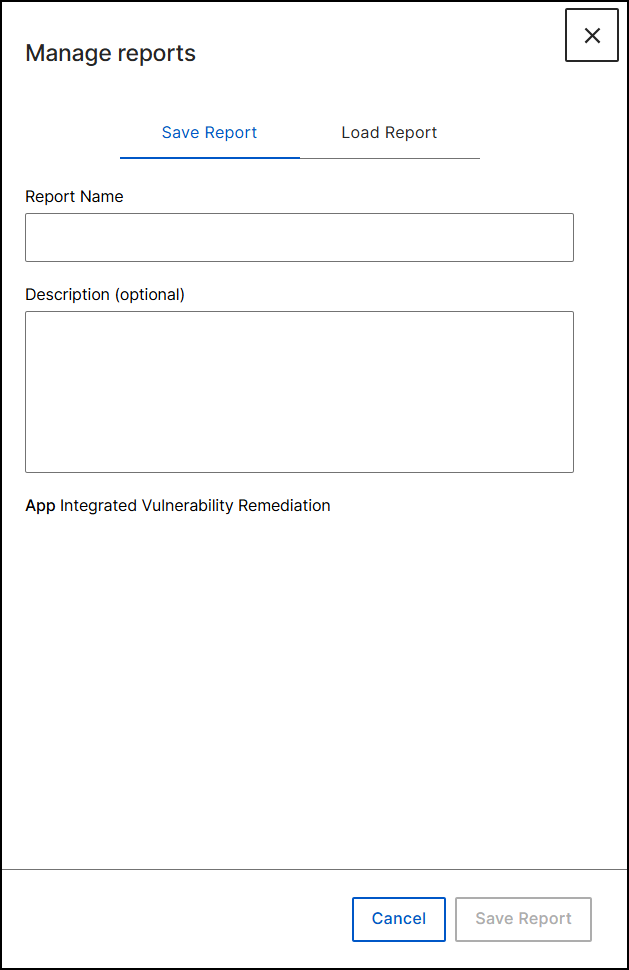
A report saves your current grid view so that you can load it again later.
- Click Manage reports in the dashboard header.
- On the Save Report tab, enter a Report Name. Optionally, enter a Description.
- Click Save Report.
To load a saved report, click Manage reports, open the Load Report tab, and then select the report.
Remediate vulnerabilities
Remediation deploys Fixlets to the devices that are affected by vulnerabilities. A wizard guides you through choosing the Fixlets, setting the actions, targeting the devices, setting the deployment behavior, and scheduling the deployment. The steps match the BigFix UI deployment wizard; see Deploying Fixlets. You can start the wizard in three ways:
| Start from | Use it when | Wizard steps |
|---|---|---|
| Vulnerability view | You want to fix specific vulnerabilities. | Fixlets, Actions, Devices, Behavior, Schedule, Summary |
| Vulnerability details page | You want to fix one vulnerability. | Same as the Vulnerability view |
| Device view | You want to fix the vulnerabilities on specific devices. | Devices, Fixlets, Actions, Behavior, Schedule, Summary |
Remediate from the Vulnerability view
- Start the wizard in one of these ways:
- On the Vulnerability view tab, select the check box for each vulnerability that you want to remediate, and then click Remediate.
- Click a vulnerability name to open its details page, and then click Remediate.
- Step 1: Fixlets. Choose the Fixlets to deploy.
Figure 8. Remediate wizard, Step 1: Fixlets 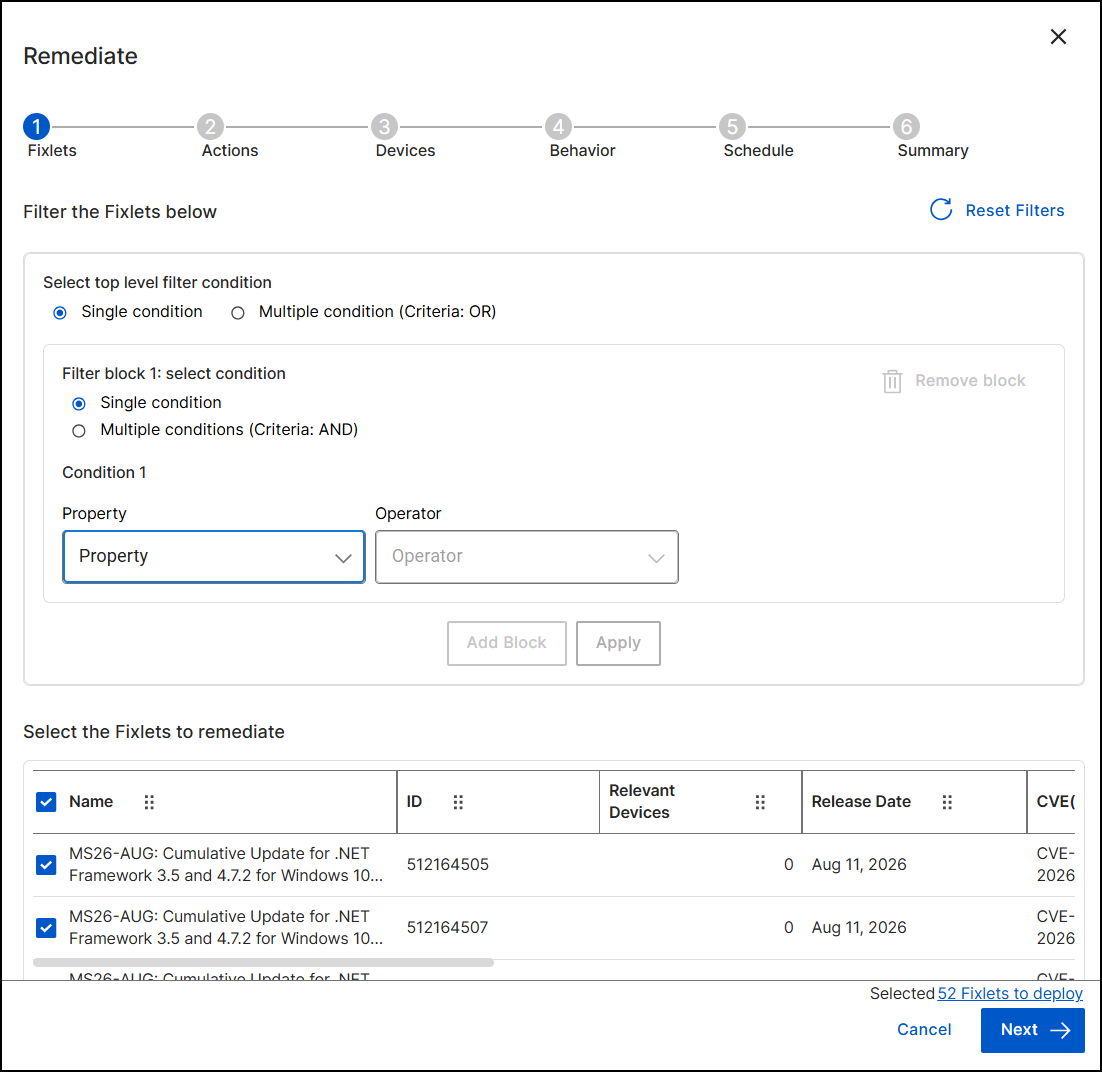
- Review the Select the Fixlets to remediate table. It shows the Name, ID, Relevant Devices, Release Date, and CVEs of each Fixlet.
- Optional: To narrow the list, use Filter the Fixlets below. Under Select top level filter condition, select Single condition or Multiple condition (Criteria: OR). Within each filter block, select Single condition or Multiple conditions (Criteria: AND), choose a Property and an Operator, and then click Apply. To add another filter block, click Add Block. Conditions inside one block are combined with AND, and separate blocks are combined with OR. To start over, click Reset Filters.
- Make sure that the check box is selected for every Fixlet that you want to deploy. The total appears at the bottom of the wizard, for example, "Selected 52 Fixlets to deploy".
- Click Next.
- Step 2: Actions. Review the action that each Fixlet runs.
Figure 9. Remediate wizard, Step 2: Actions 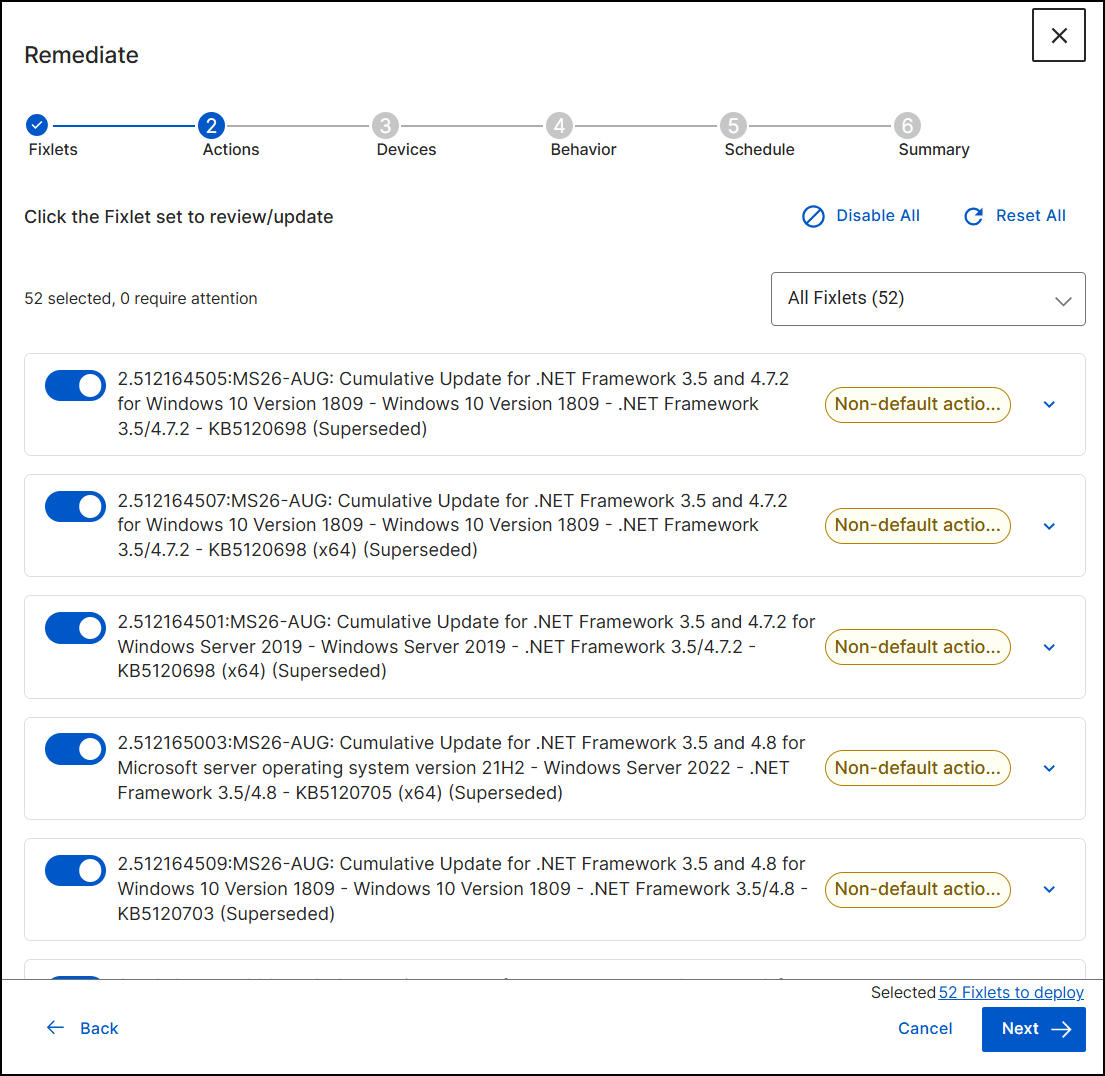
- Use the toggle next to a Fixlet to include it in or exclude it from the deployment.
- Review the Fixlets that are marked Non-default action. The counter at the top of the page (for example, "52 selected, 0 require attention") shows how many Fixlets need your attention. Fixlets that require attention aren't deployed until you resolve them. To resolve one, expand it and select the action to run, as described in the next step.
- To see the details of a Fixlet, expand it. The expanded view shows the available actions (for example, Action1 to start the deployment) and the Fixlet attributes: Category, CVE(s), Download size, Release date, Severity, Source, and Source ID.
- Optional: Click Disable All to exclude all Fixlets, or click Reset All to restore the default selection. Use the All Fixlets list to change which Fixlets are shown.
- Click Next.
- Step 3: Devices. Choose the devices that receive the remediation. The
wizard lists the devices that the selected Fixlets apply
to.
Figure 10. Remediate wizard, Step 3: Devices 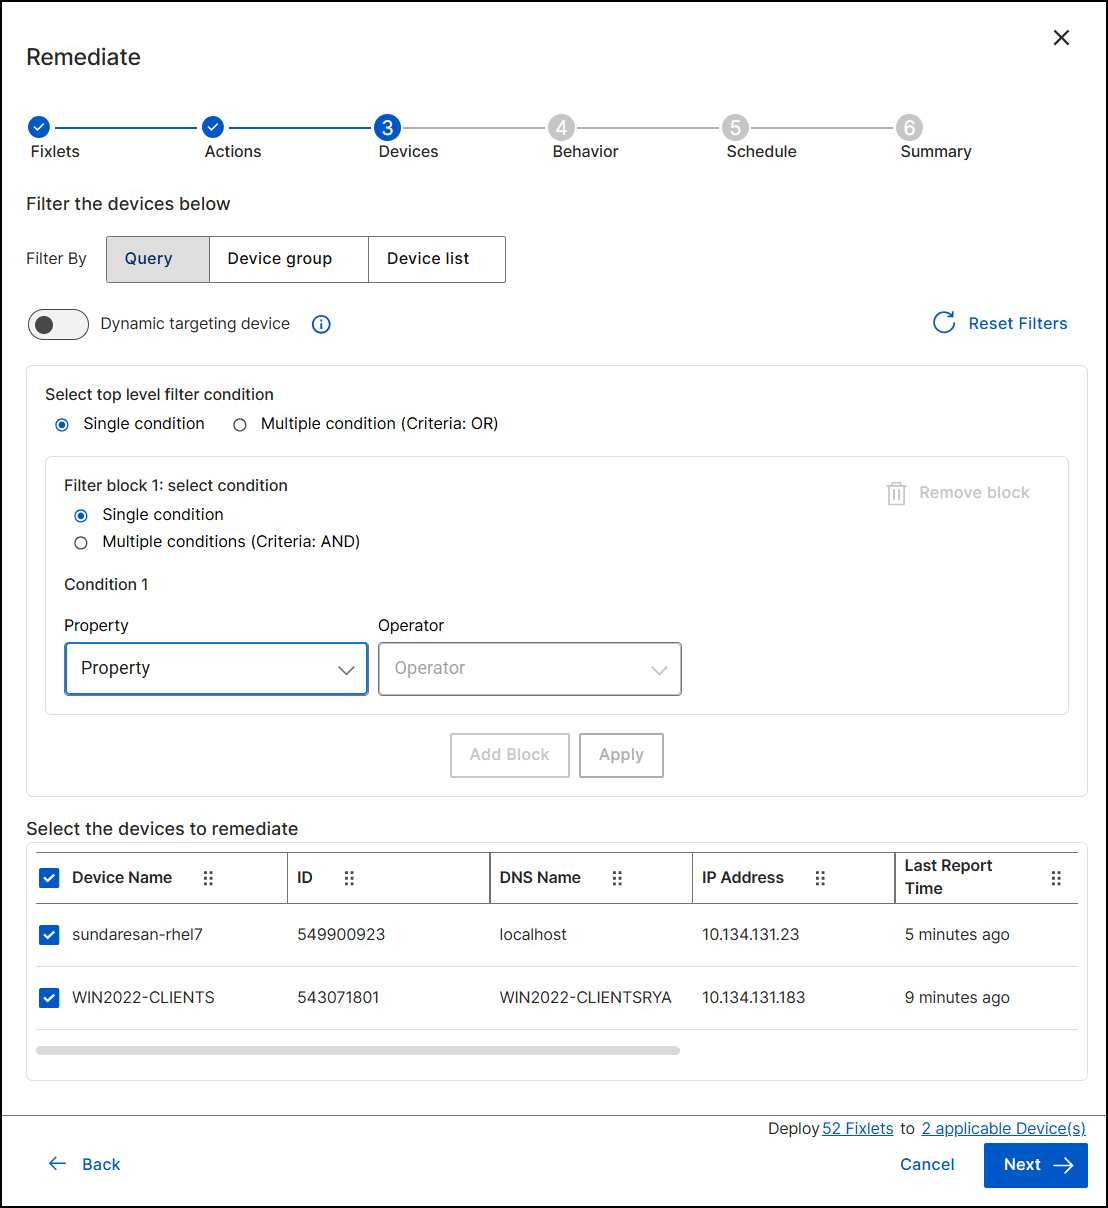
- Under Filter By, click Query, Device group, or Device list to narrow the targets. For device groups, see Device Groups. With Query, you build conditions from device properties.
- Optional: Turn on Dynamic targeting device to also include devices that meet your criteria later.
- In the Select the devices to remediate table, confirm the final list of devices. The table shows the Device Name, ID, DNS Name, IP Address, and Last Report Time. The bottom of the wizard summarizes the deployment, for example, "Deploy 52 Fixlets to 2 applicable Device(s)".
- Click Next.
- Step 4: Behavior. Set how the deployment runs. The wizard runs the
events that you turn on in the order listed, from top to bottom. Turn on the
events that you
need:
Figure 11. Remediate wizard, Step 4: Behavior 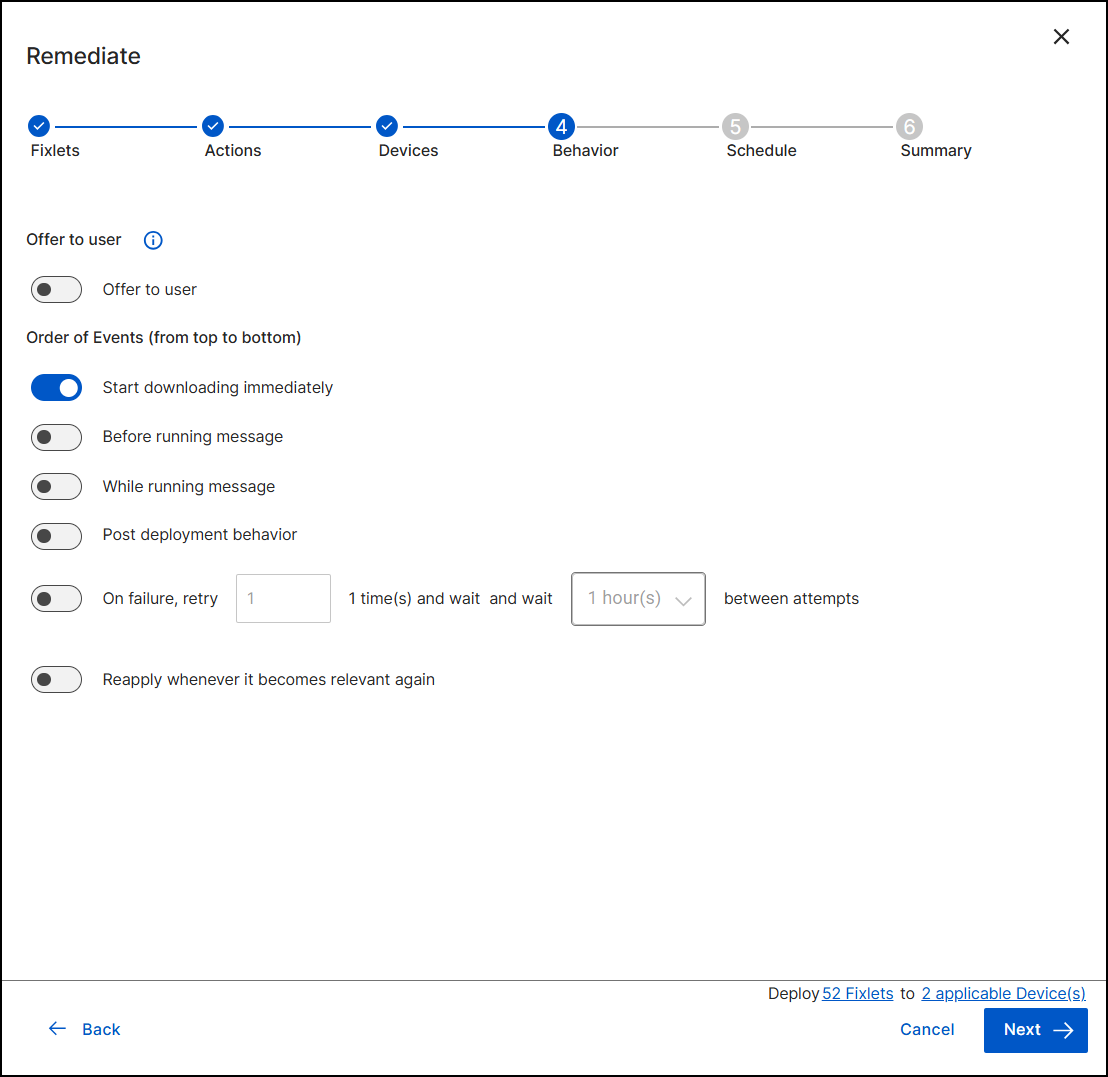
- Offer to user: offers the deployment to the users of the devices.
- Start downloading immediately: on by default. Downloads the deployment files right away, before the scheduled start.
- Before running message: displays a message on the targeted devices before the deployment runs.
- While running message: displays a message on the targeted devices while the deployment runs.
- Post deployment behavior: sets what happens after the deployment finishes. If you leave it off, the Summary shows "Do nothing after action completes".
- On failure, retry: retries a failed deployment. Enter the number of retries and the wait time between attempts.
- Reapply whenever it becomes relevant again: runs the action again if a device becomes relevant for the Fixlet again.
- Step 5: Schedule. Set when the deployment
runs.
Figure 12. Remediate wizard, Step 5: Schedule 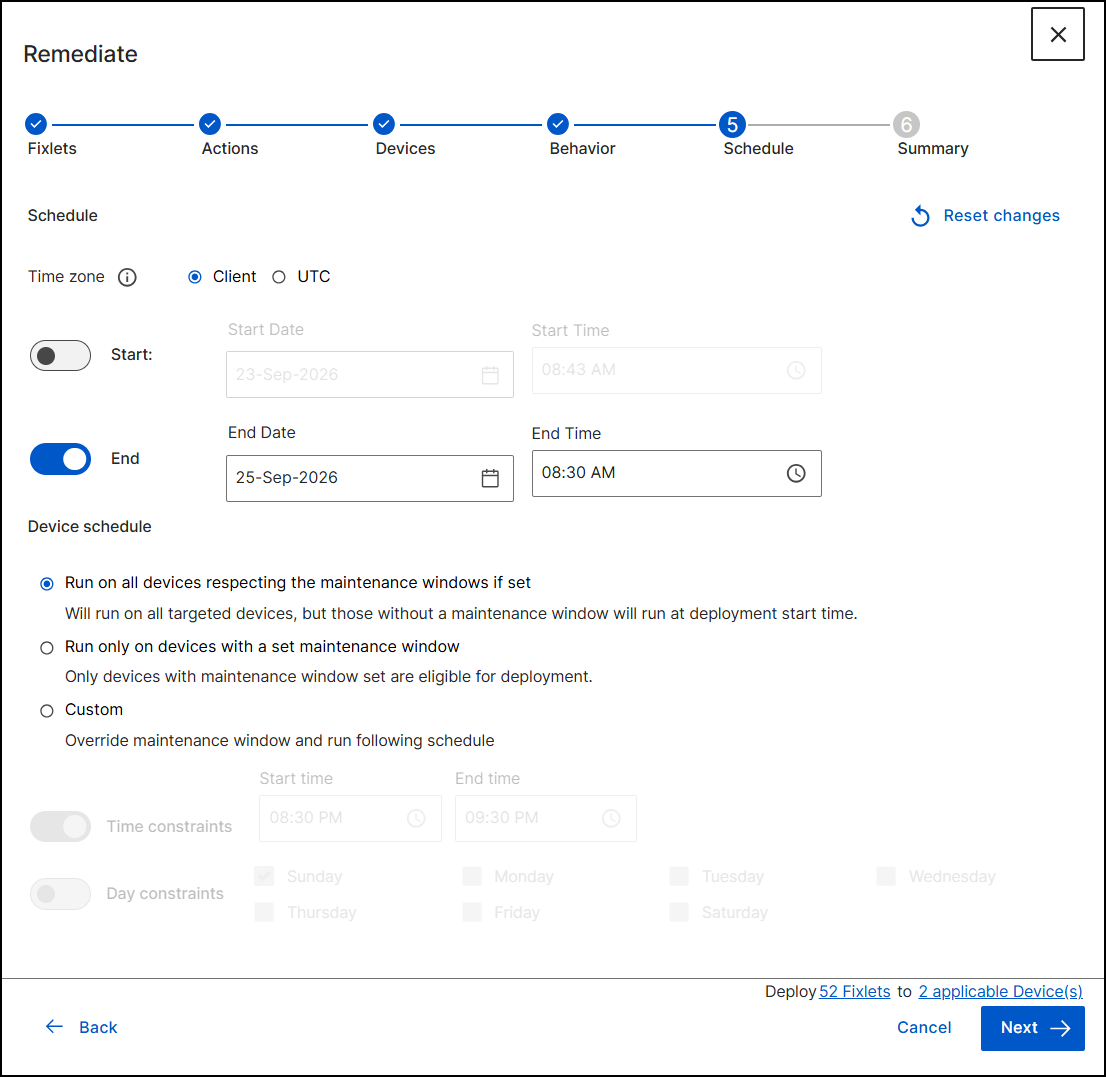
- For Time zone, select Client to use each device's local time, or UTC to use Coordinated Universal Time.
- Optional: Turn on Start and End, and then enter the date and time for each. If you leave Start off, the deployment has no specified start time.
- Under Device schedule, select one
option:
- Run on all devices respecting the maintenance windows if set: the deployment runs on all targeted devices. Devices that have no maintenance window run at the deployment start time.
- Run only on devices with a set maintenance window: only devices that have a maintenance window are eligible.
- Custom: overrides maintenance windows and follows your schedule. Turn on Time constraints to set a start and end time, and Day constraints to select the days of the week.
- Click Next.
For maintenance windows, see Managing Device Maintenance Windows.
- Step 6: Summary. Name the deployment, review your choices, and
deploy.
Figure 13. Remediate wizard, Step 6: Summary 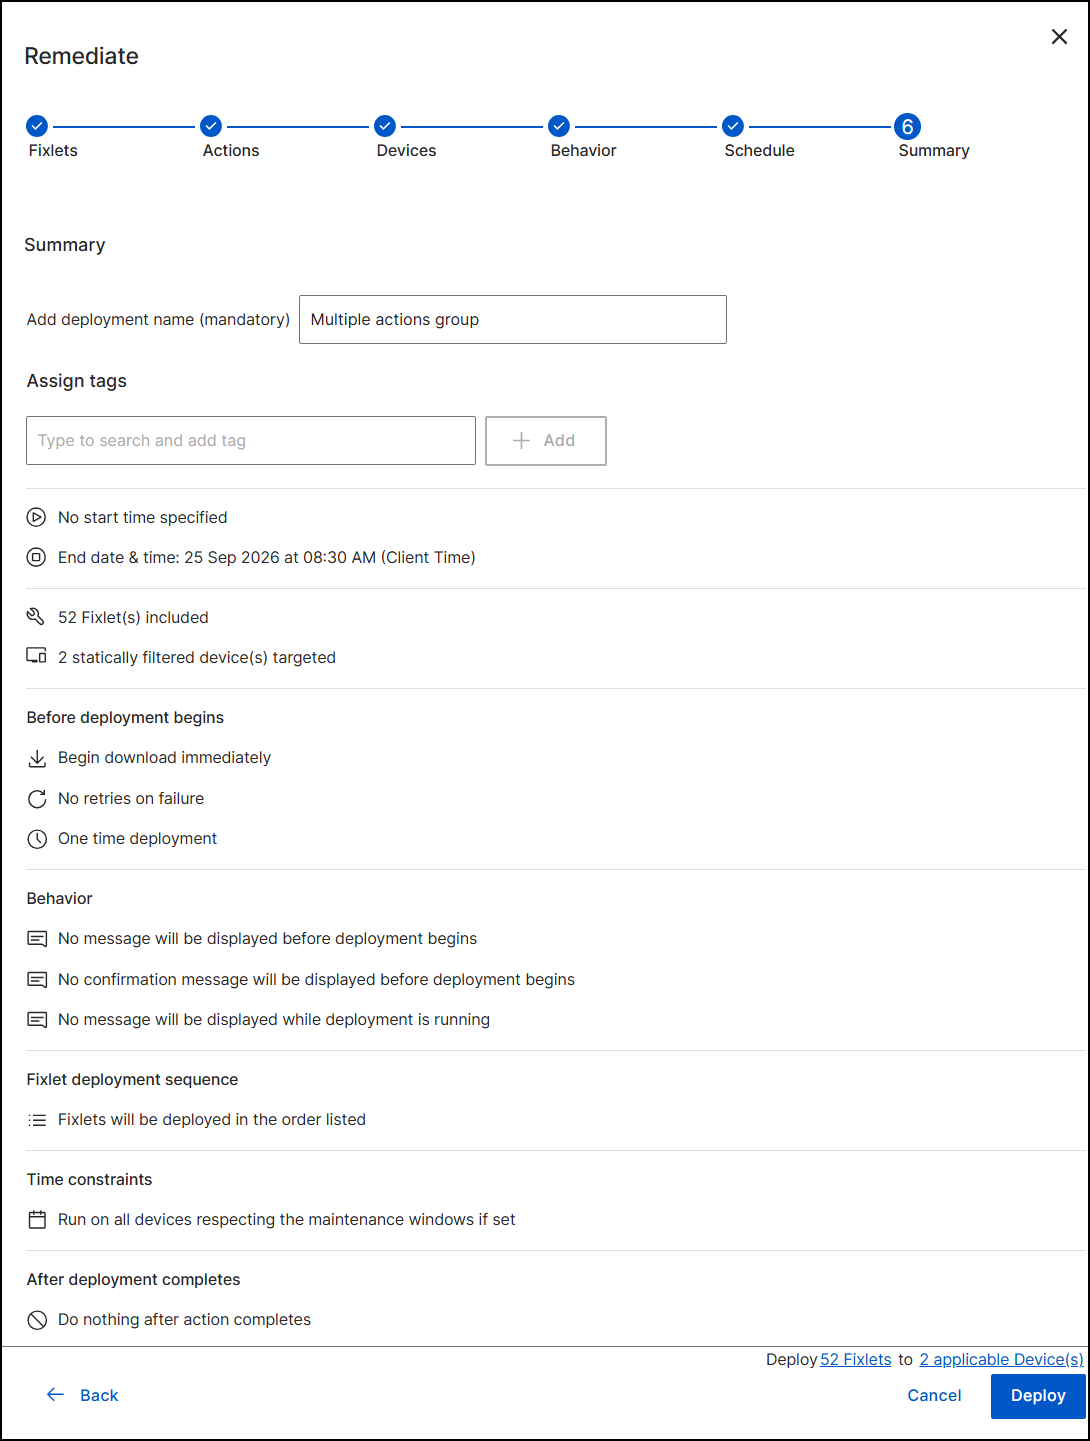
- In Add deployment name (mandatory), enter a unique name for the deployment.
- Optional: Under Assign tags, type to search for a tag, and then click Add.
- Review the summary: the schedule, the number of Fixlets and devices, the settings that apply before the deployment begins, the messages that display, the Fixlet deployment sequence, the time constraints, and what happens after the deployment completes.
- Click Deploy.
Result: IVR submits the deployment.
Remediate from the Device view
- Open the Device view tab.
- Select the check box for each device that you want to remediate, and then
click Remediate. The Remediate
wizard opens at the Devices
step.
Figure 14. Remediate wizard from the Device view, Step 1: Devices 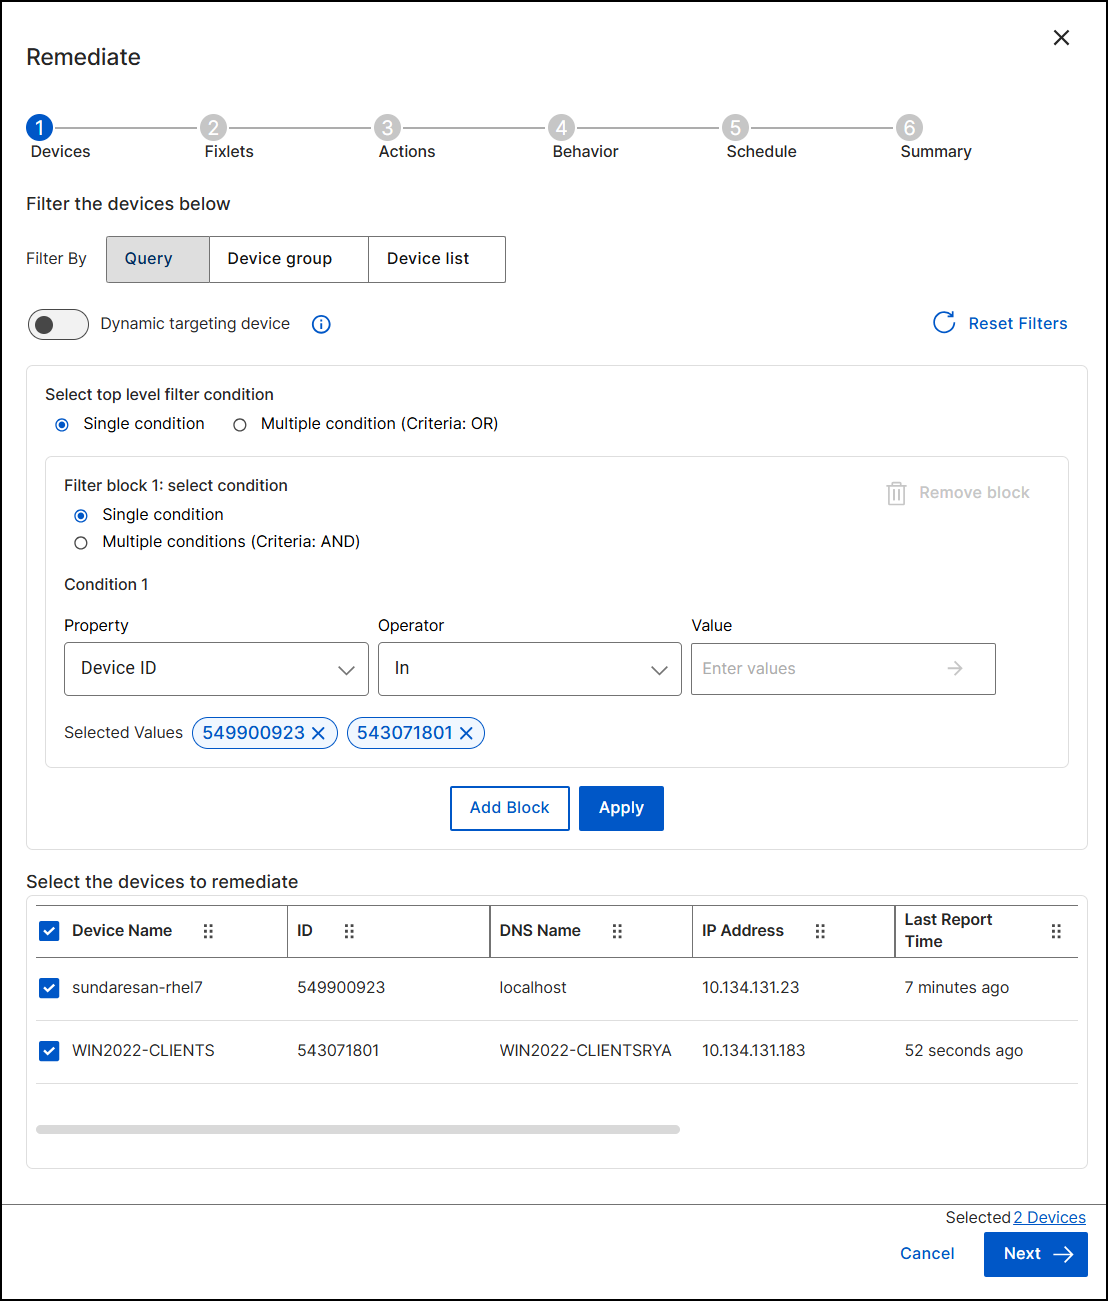
- Devices: This step looks like Step 3 of the Vulnerability view flow, with your selection already applied as a filter condition (for example, Device ID In the IDs of the devices that you selected). To change the targets, use Query, Device group, or Device list, or turn on Dynamic targeting device. Click Next.
- Fixlets: select the Fixlets to deploy to the devices, and then click Next.
- Complete the Actions, Behavior, Schedule, and Summary steps as described in Remediate from the Vulnerability view, and then click Deploy.
Monitor the deployment
To track the status of a deployment, use either of these:
- The Deployment tab of the vulnerability details page. It lists each deployment with its name, status (for example, Active, Completed, or Expired), start time, and the user who started it.
- Deployment Manager, which also shows the targeted devices and deployed Fixlets. See Deployments.