Power consumption over time
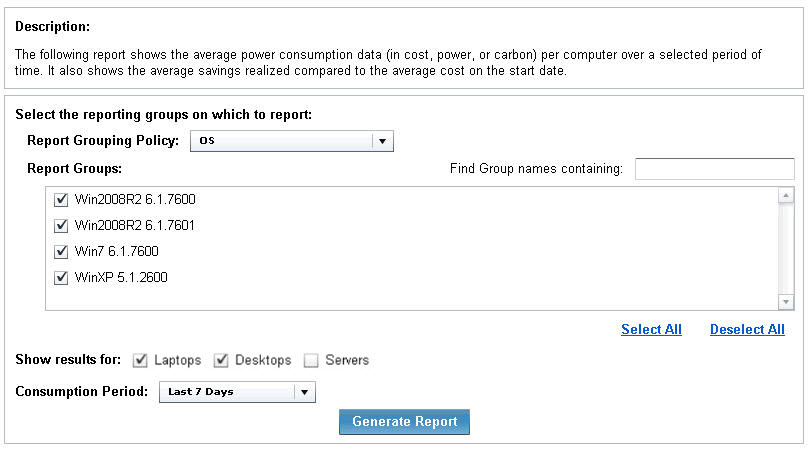
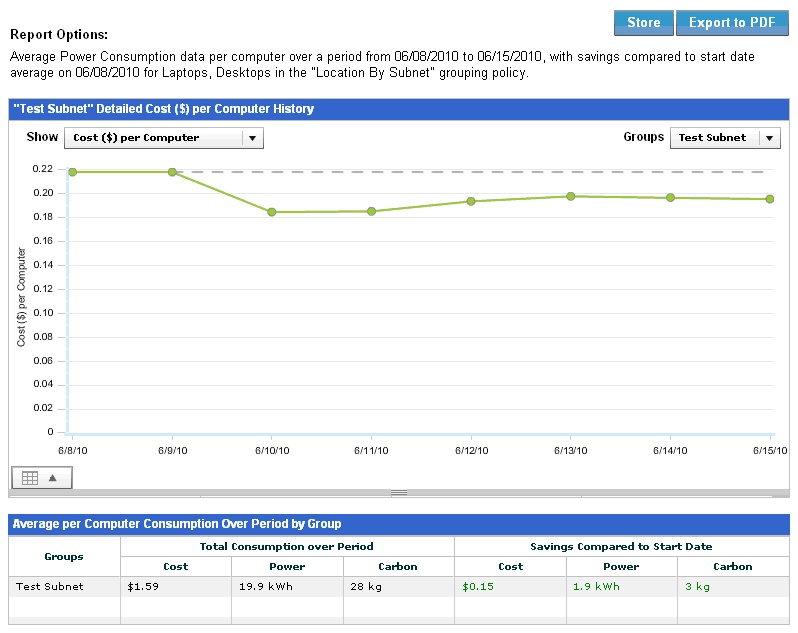
The Power consumption over time report charts the average computer power consumption over a specified time period, and displays cost or savings compared to a baseline cost based on the start date.
Use this report to review historical savings and progress of power management policies. You must have Historical Power Tracking enabled to use this report.
Note:
If you select the current date as the End Date, the report might take
significantly longer to generate because the current date has not yet been pre-calculated.