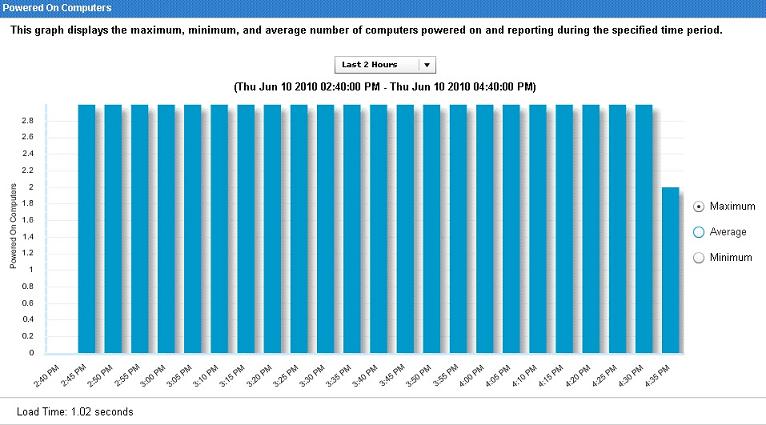
Power Consumption Summary dashboard
The Power Consumption Summary dashboard provides a comprehensive view of your deployment's power usage, including aggregate consumption, PM Efficiency Rating, average day activity state breakdown, power profile settings distribution, and trends in powered-on computer counts.
The Power Consumption Summary dashboard captures the following information:
- Aggregate Power Usage
- Average day breakdown of the activity states (Idle, Active, Standby, Powered off)
- Power Management (PM) Efficiency Rating
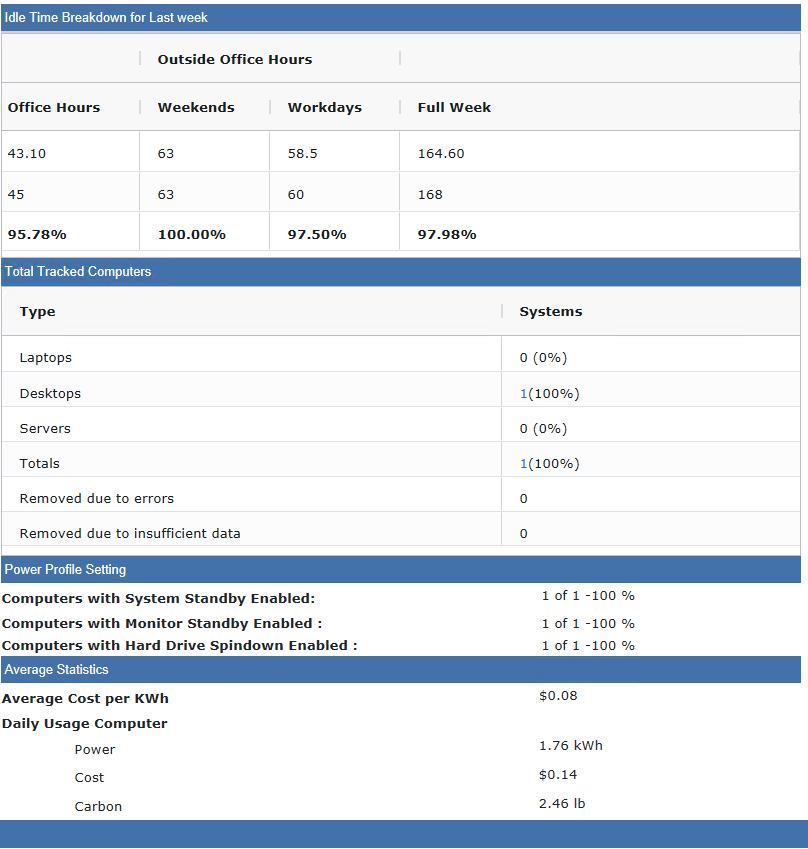
- Idle Time breakdown for last week
- Total tracked computers and computers removed from calculations
- Power profile settings
- Average Statistics
- PM Efficiency Rating
- Powered on computers
Aggregate Power Usage
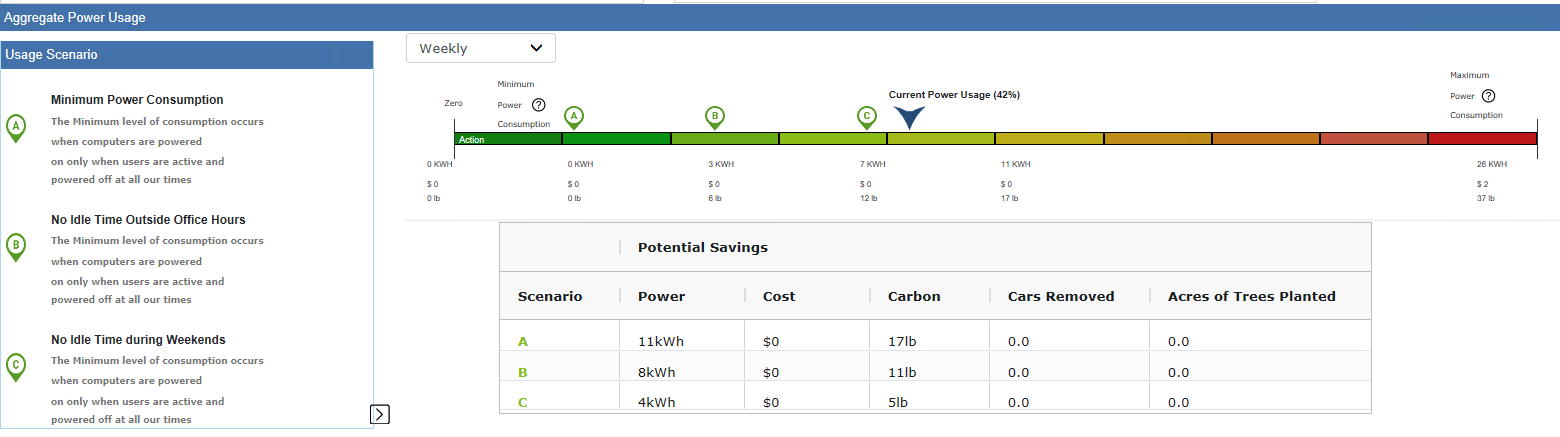
The Aggregate Power Usage section displays the overall power used by your deployment and compares it with your estimated Minimum Power Consumption. The section shows the different scenarios of your power usage, in terms of power, cost, and carbon for various computer types in your deployment.
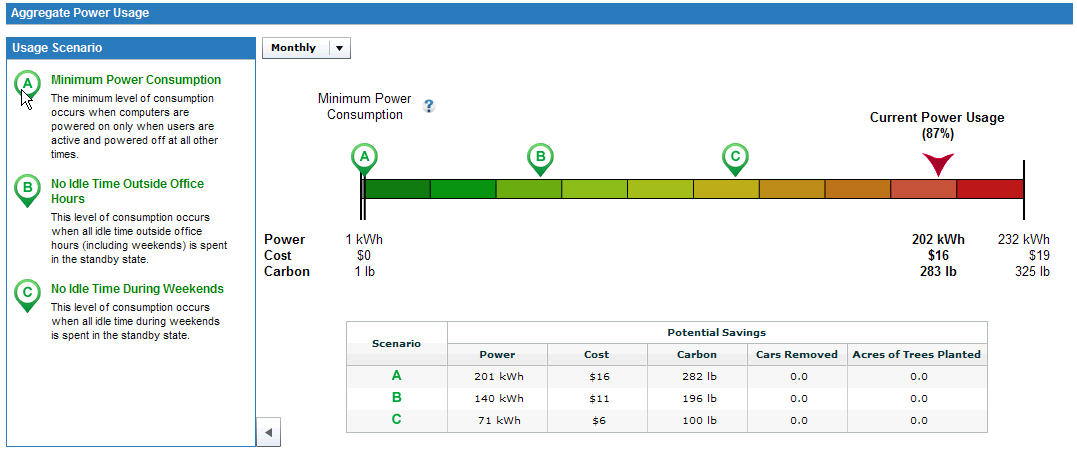
In the power spectrum, the letters A, B, and C correspond to usage scenarios that are described on the left side of the Aggregate Power Usage section.
- Minimum Power Consumption
- The amount of power used when computers are powered on only when users are active, as opposed to idle, standby, or hibernate modes, and powered off at all other times.
- No Idle Time Outside Office hours
- The amount of power used when there is no idle time outside office hours. Power usage is calculated by converting idle state to standby state.
- No Idle Time During Weekends
- Occurs when there is no idle time during weekends. Power usage is calculated by converting idle state to standby state.
Daily average breakdown of the activity states
PM Efficiency Rating
The Efficiency Rating measures the total amount of user idle time that is spent in the standby power state. The lower the rating, the more opportunity an organization has to save power. The rating is calculated as follows: standby time / (standby time + idle time).
Average Idle Time breakdown for last week
Shows the weekly idle time breakdown per computer over a selected period of time.
Total tracked computers and computers removed from calculations
This table captures the distribution of computer types such as laptops, desktops, and servers, in the deployment, and computers excluded from power calculations due to errors and insufficient data. Click the values in the System column to see details of the endpoints under a particular computer type.
Power profile settings
The Power Profile Settings displays the distribution of the following power management settings in your deployment:
- Computers with system standby enabled
- Computers with monitor standby enabled
- Computers with hard drive spindown enabled
Average Statistics
Daily power consumption of an average computer in your deployment.
Powered on computers
- Minimum
- Shows computers that were on continuously through the whole interval.
- Maximum
- Shows computers that were powered on at least once during the interval.
- Average
- Shows computers that were on more often than off during the interval.