Paths
This page explains about the use of path metrics and steps to create paths.
Path Metrics is an effective analytical tool from HCL CDP that allows you to know your campaign performance and its engagement level by knowing every action performed by users in between, before and after certain events. This supports knowing about the user actions across all data sources not limited to just App and Website and identifying the bottlenecks that deviate the users from achieving a certain event and drop off.
Path Metrics will also support the business to identify the flaws in the architecture of their Website/Application and campaign performance and optimize it with precise data analytics rather than making decisions by guesswork. With this feature, businesses can gain promising engagements with proven records from the history of user behavior.
Let's say,
As a marketer, you want to know the actions of the users and analyse where the major drop off and major conversion happens in your website/Application. Creating a perfect journey towards your end goal and analyzing the journey performance will help you to know your users better and support you in improving your campaign performance. This will also help to architect a better website or application that directs the users towards reaching the end goal without any deviations.
Let's assume you are a marketer of an
e-commerce business and you want to know at which point the majority of users get
dropped off. You can configure the journey with multiple events
likeproductVisited,added to
wishlist,Checkout etc. If there occurs a major dropoff
after the event product visited or before
Checkout, you can analyse the actions performed before after and
between each event to get detailed insights into your user behaviour with the help
of these path metrics and optimize your platform or marketing campaign for better
traction.
It also supports you to gain answers to critical business questions like,
- What are the activities performed by the user before attaining a certain event?
- When do users exit the Website/Application?
- How do users move from one step to another?
- When do users drop off before purchasing a product?
- What makes a user uninstall the application?
Before diving deep into the path let's know how to read the path by knowing its indicators.
Analyzing the Path Diagram
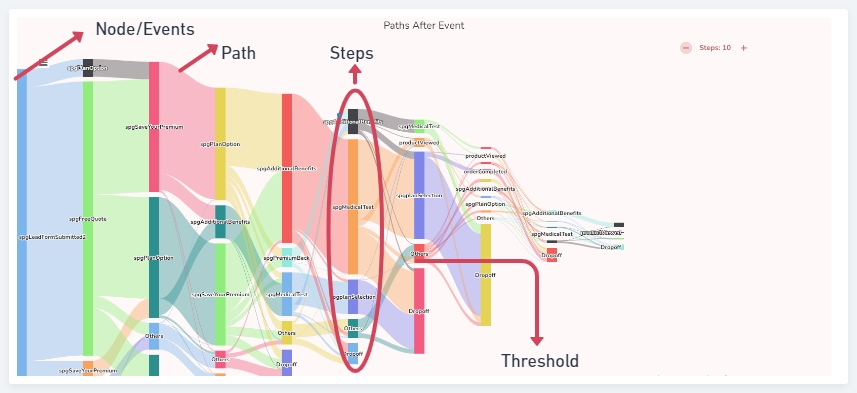
- Event: Each action configured in the path like, product visited, check out, drop off, etc.
- Steps: Number of actions performed by the user before, after or in between certain events, which is also a collection of events.
- Node: Each event is a node, hovering over each node will show the number of drop-offs and the next steps with its counts and percentage.
- Path: Path is the direction the user took from one event to another event in another set of steps. hovering over the path will show the direction of each path from one step to another.
Plot the path
To plot the path, follow the steps below:
- Navigate to Analytics > User Journey > Path.
- Select a path metrics chart from the drop-down. The paths options can be:
- Before an Event: The plot will be shown before a certain event. The steps will be calculated from the point before the particular event.
- Between Events: The plot will be shown from one event to another. The steps will be calculated between those events.
- After an Event: The plot will be shown after triggering a certain event. The steps will be calculated from the point the event is triggered
- Select Show all paths starting with if the path metrics is selected
as After an Event in previous step. These paths can be configured by
the marketer based on the website/Application.
- If you choose Between Events in the previous step, then you must select Events from Show All Paths starting with and the Events from Show All Paths ending with.
- If you choose Before an Event in the previous step, then you must select Events From Show all paths ending with to plot the charts.
Filters
Use filters to refine data and plot paths based on specific criteria such as URLs, browsers, segments, and engagements. Follow the steps below for precise data analysis and visualization.
Filter event based on URL
To plot the path for the event Product Viewed and filter it using URLs that include the term Insurance, follow the steps below:
- Click the filter icon beside the event.
- An input window will appear. Apply the filter based on URLs.
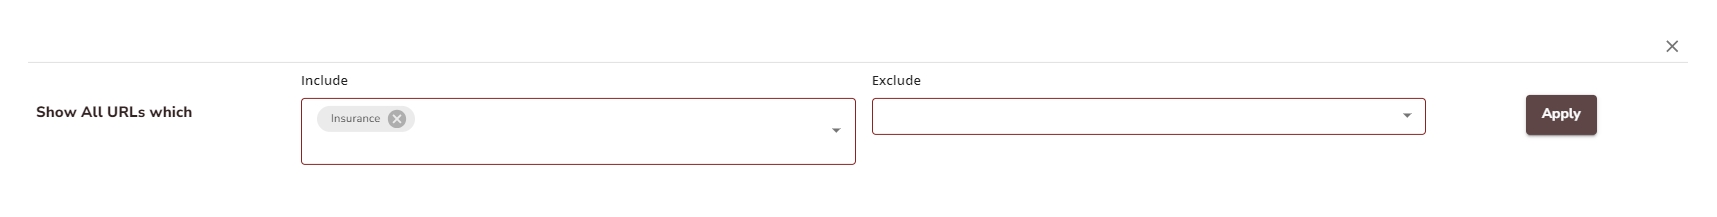
- The filtered path will be plotted based on the applied criteria.
- Additional Filtering Options: For events like Open,
Click, and Impressions, filter paths based on:
- Browser
- Segment
- Engagement
These events were tracked from HCL CDP's Add External API Engagement.
Case 2: Filtering Event based on Engagement_Open
To plot the path for the event Engagement_Open and filter it at the browser level, follow the steps below:
- Select Engagement_Open from the drop-down menu in Event 1.
- Click the filter icon, select Add Filter, and apply the
following:
- Property: Browser
- Operator: Contains
- Input: Chrome
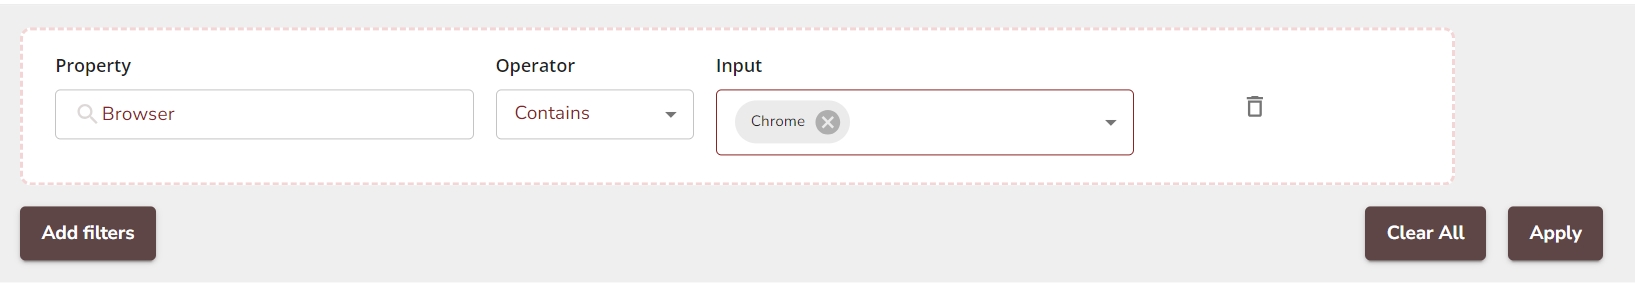
- The paths will be plotted based on the applied filters.
- Set the Time Window: From the drop-down menu, select a window period (e.g., Within the Window Of). For example: If you choose the starting event ProductVisited, set the window to 1 day and the time frame to Last 90 Days. This will show user actions within a day of the selected event in the last 90 days.
- Use the field During to specify the time frame (e.g., Last 90 Days).
- Specify the number of steps you want to analyze before a particular event. For example: Select 10 steps (up to 15 steps can be chosen) to focus on high-impact signals while minimizing noise.
- Set the Other Events Threshold: Choose a threshold to group low-traction events under Others. For example: Set the threshold to 5% (minimum: 5%, maximum: 20%).
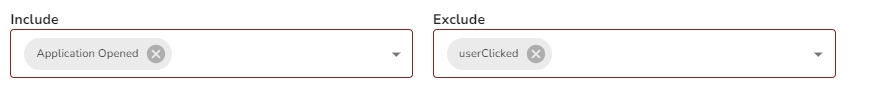
- Include and Exclude Events:
- Include Events: Add relevant events to the path.
- Exclude Events: Remove unnecessary events for better data clarity.
- After configuring the filters and settings, click Plot the Chart to visualize the path.
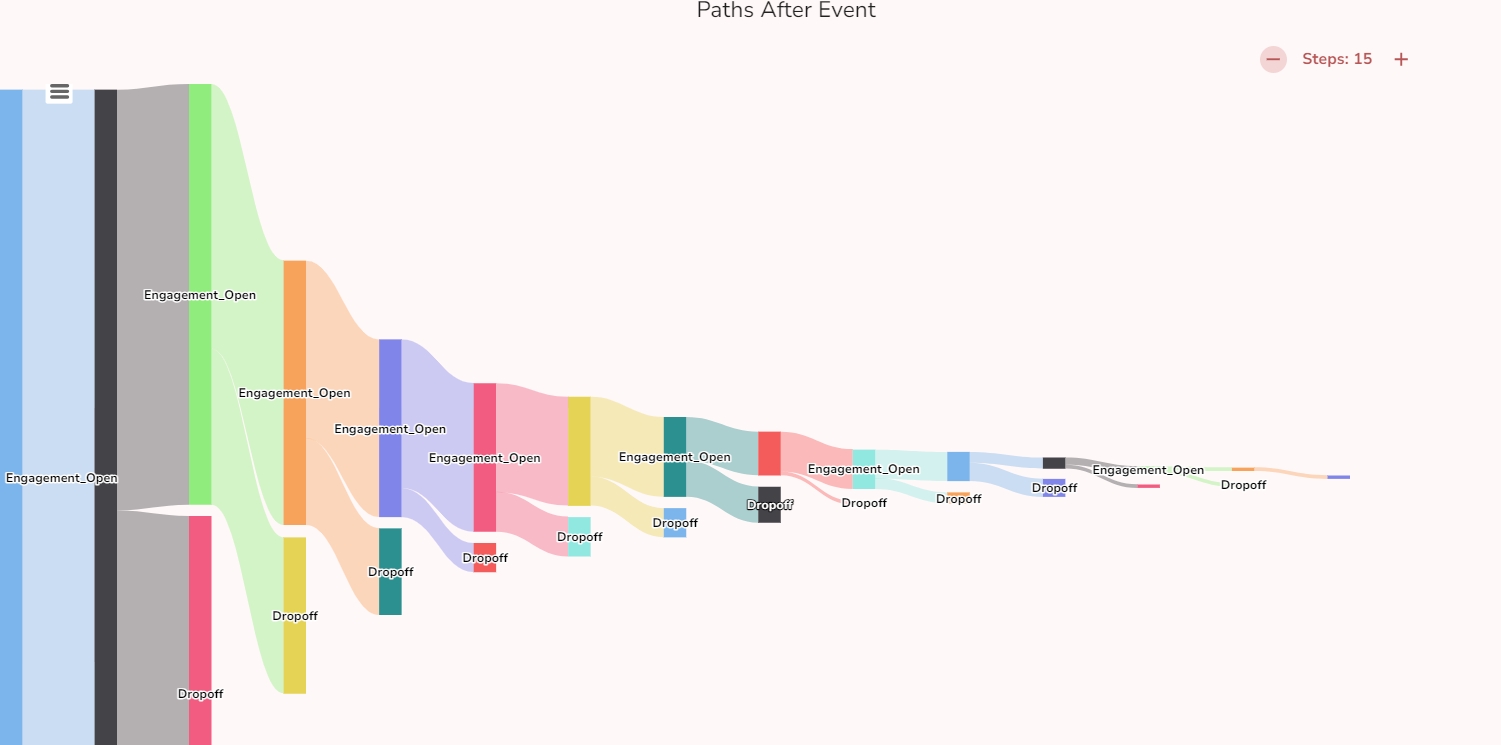
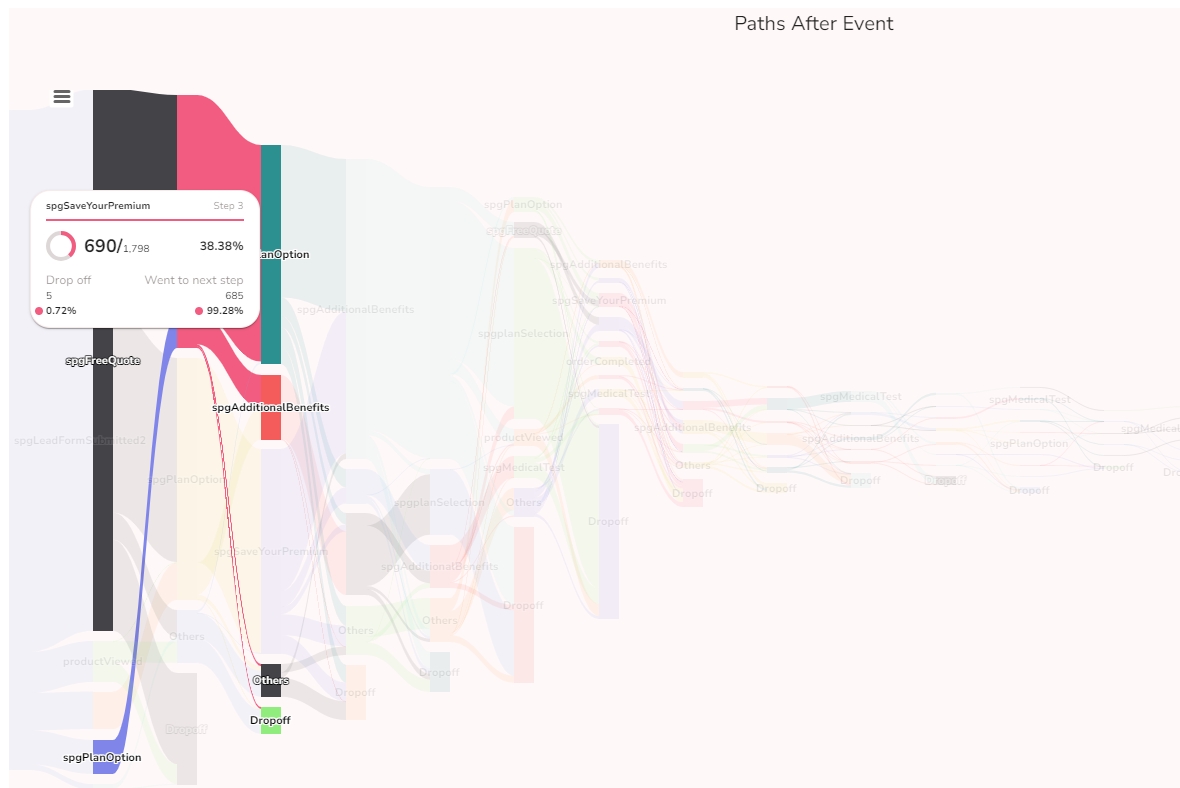
Plotting Paths After an Event
In the After Event view, a Drop-Off Node node is displayed at each step. This node represents users who exited or disengaged after completing the event(s) at that specific step. This allows gaining insights into where users drop off to identify areas for improvement and effectively re-target them.
Hovering over Nodes and Paths
- Nodes: Hover over each node to view the number of drop-offs
from that step, and the next possible paths, including their counts
and percentages.
- Paths: Hover over a path to see the next steps users
took from one node to the next, and drop-offs that occurred during
the transition.
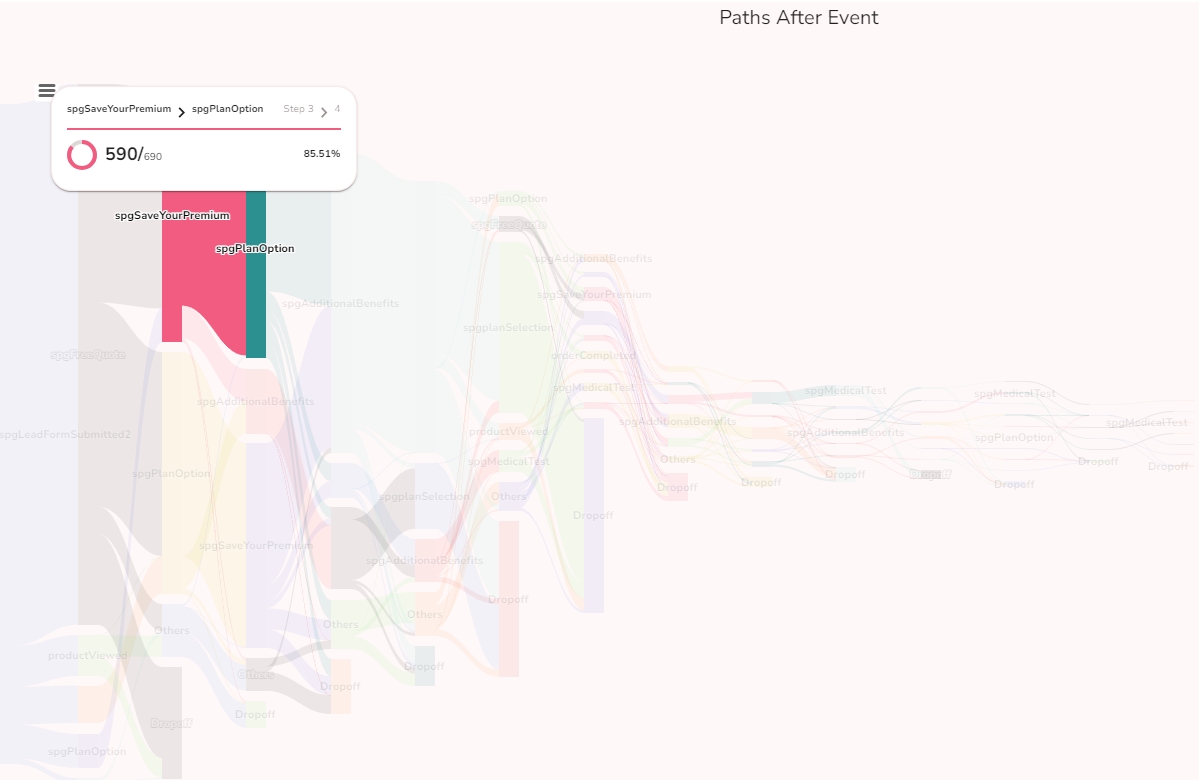
- Paths: Hover over a path to see the next steps users
took from one node to the next, and drop-offs that occurred during
the transition.
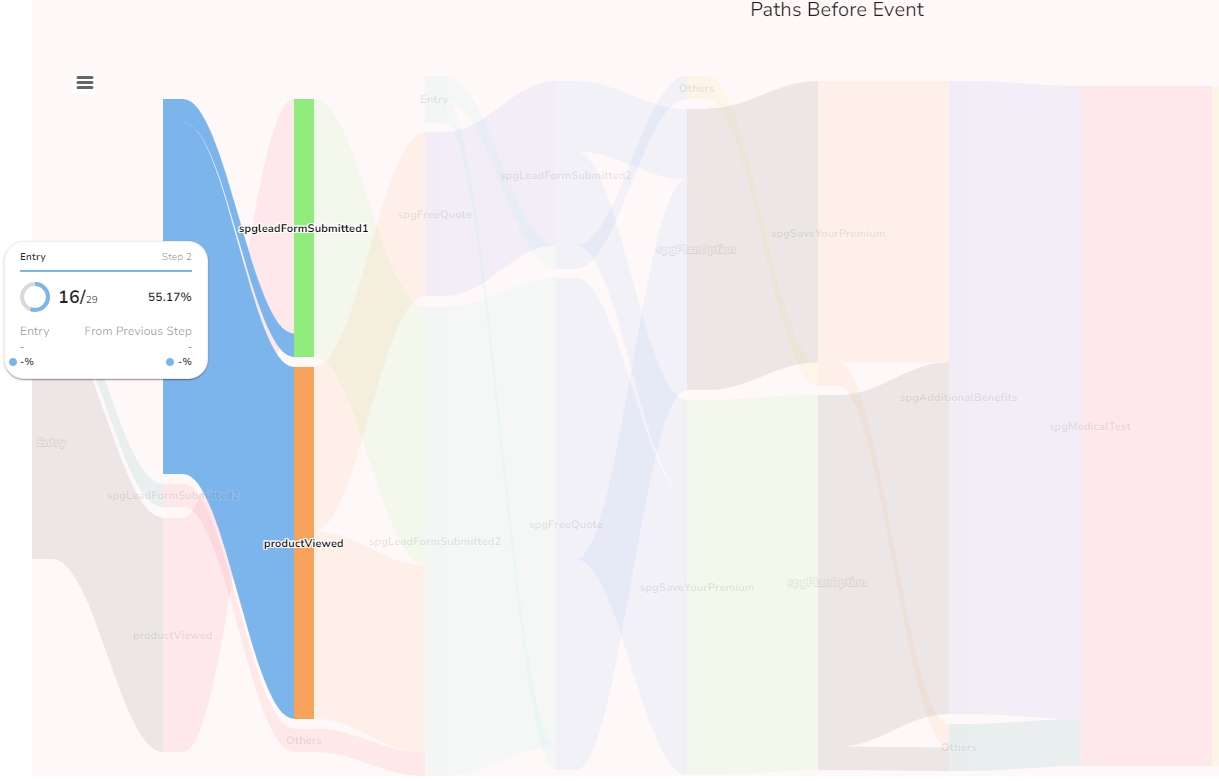
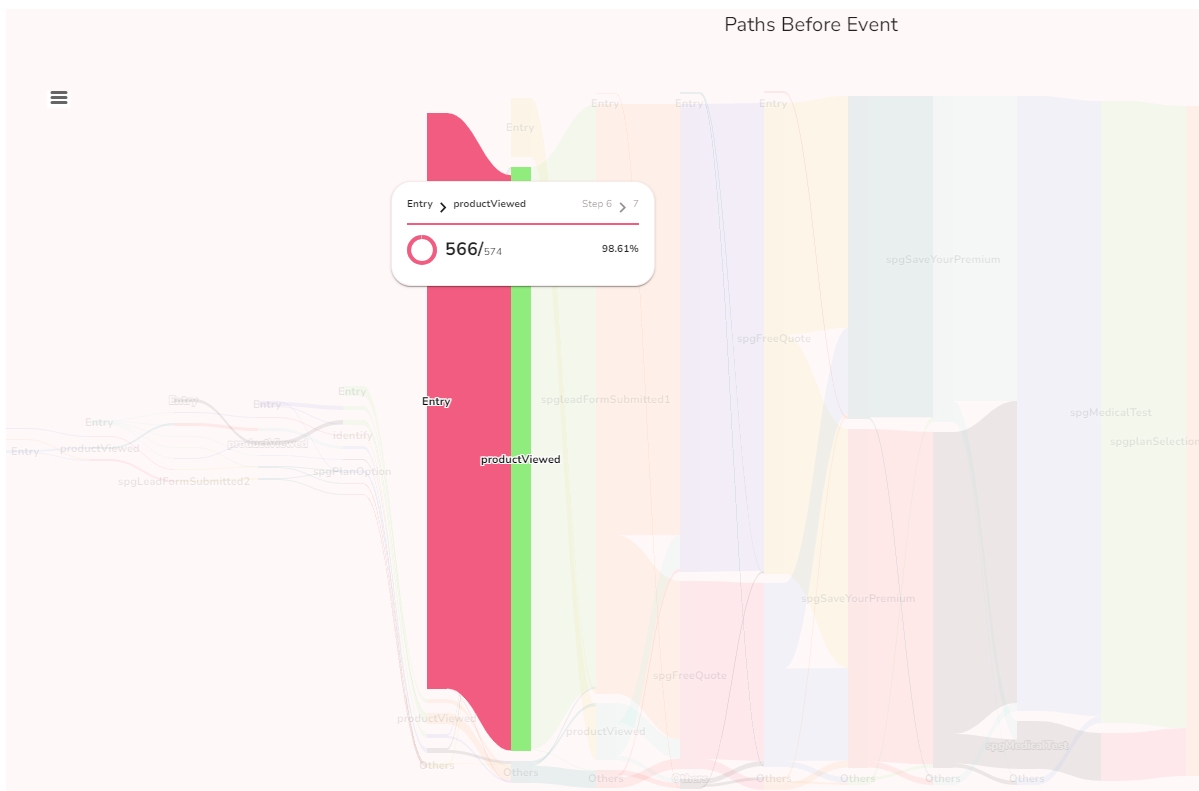
Plotting Paths Before an Event
In the Before Event view, an Entry Node is displayed at each step. Users who directly entered the step without traversing through the intended previous steps or paths. Understand the various touchpoints where users are coming from directly, offering insights into alternative or unexpected user journeys.
Hovering over Nodes and Paths
- Node: Hover over each node to view the number of direct
entries at that step and the paths from previous steps,
including their counts and percentages.
- Paths: Hover over each node to see the steps users took from
their entry points to transition between nodes, and the corresponding
counts and percentages for each transition.
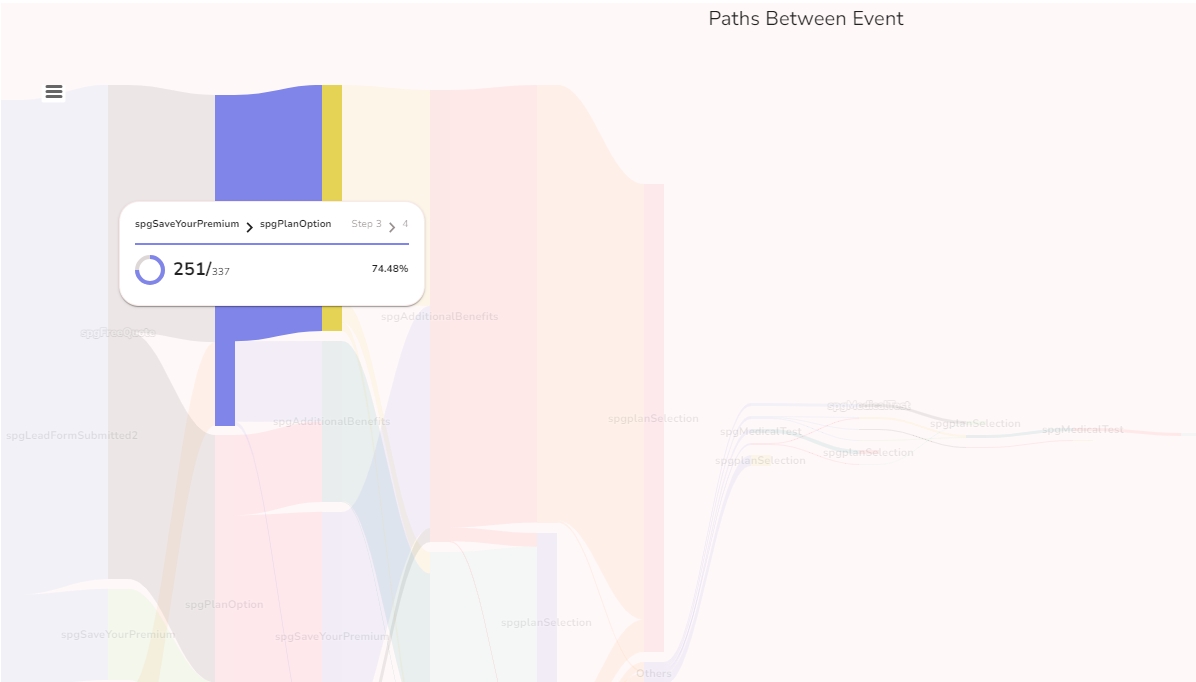
Plotting Paths Between The Events
In the Between Event view, the visualization displays the exact paths users followed between two specified events. Unlike Before or After Event views, there are no drop-off or entry nodes shown. This view focuses solely on the transitions between events.
Hovering over Nodes and Paths
- Nodes: Hovering over a node reveals the number of users who
proceeded to the next step from that node, and counts and percentages of
users transitioning forward.

- Paths: Hovering over a path reveals the steps users took to
move between nodes, and counts and percentages for each transition
(excluding drop-offs).
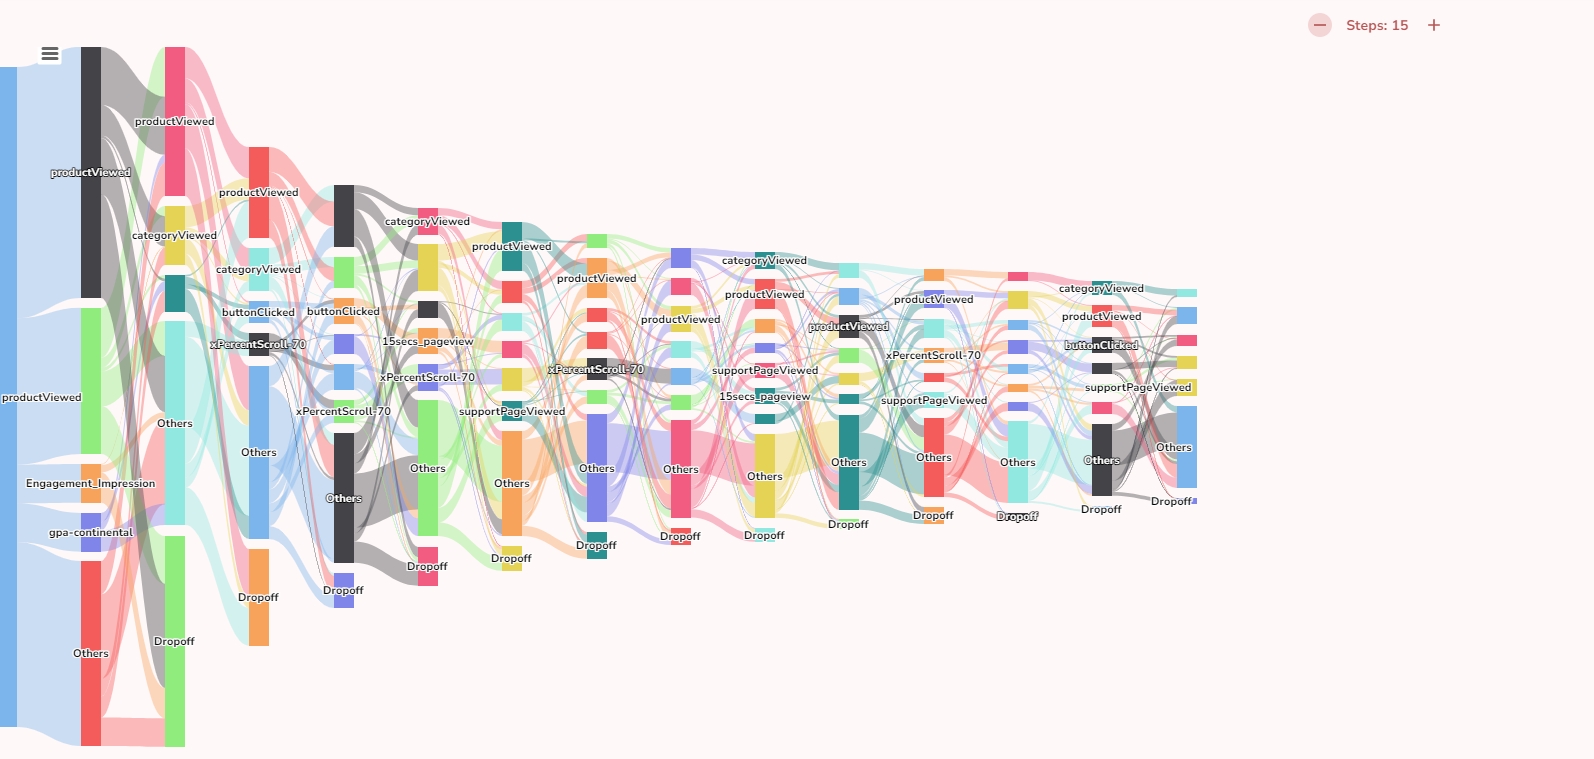
Additionally, Adding and Removing Steps in Path Charts
Customizing Steps: Use the "+" and "-" icons at the top-right corner of the chart window to add or remove steps. This allows you to adjust the view for a more focused analysis or a broader overview of each step in the path, tailored to your requirements.
Limitation for Between Events: When plotting paths Between Events, adding or removing steps directly from the chart is not supported.