Data Sanity: Understanding Differences Between Funnels, Paths, and Events
This page explains the differences in data between Funnels, paths, and events and the reasons behind them.
This section explores the variations in data among Funnels, Paths, and Events while explaining the causes of these differences. These three components are pivotal in evaluating campaign performance and understanding user journeys, but mismatches can occur due to differences in data calculation methods or scenarios. Below, we detail these components and analyze cases to clarify data mismatches.
Before delving further into data sanity, let's take a quick look at these three key components that assist in understanding your campaign's performance.
Overview of Key Components
- Funnels:
Funnels provide insights into user drop-offs between events, guiding analysis down to the final event. They can be plotted based on Unique Users or Total Occurrences.
- Paths:
Paths reveal user journeys by examining events Before, After, or Between selected touchpoints. They allow for a comprehensive view of user flow and behavior.
- Events:
Events provide a detailed breakdown of all occurrences (daily, monthly, or yearly) for specific events. Data can be segregated by Total Occurrences or Unique Occurrences.
Data Comparison Between Funnels, Events and Paths
In the upcoming demonstration, we compare the Funnel, Path, and Events simultaneously at the same time between July 1 and July 31 in order to interpret the differences in data in various cases.
Case 1: Funnel Data (Unique Users) vs. Path Data (After an Event)
When comparing Funnels (Unique Users) and Paths (After an Event), Funnels track unique users, while Paths consider total occurrences of the event, including multiple actions by the same user, and consider consecutive events within a 30-minute window, while Paths use a user-defined lookahead window (time gap between the first and last event). In this example, the Funnel Unique Users count is 22,602 and Path (After an Event) count is 35,695.

Case 2: Funnel Data (Total Occurrences) vs. Path Data (After an Event)
When comparing Funnels (Total Occurrences) and Paths (After an Event), paths calculate events based on the lookahead window, while Funnels consider consecutive events within 30 minutes. In this example, Funnel (Total Occurrences) is 40,293 and Path (After an Event) is 35,695.

Case 3: Path Data (Before an Event) vs. Path Data (After an Event)
When comparing Paths (Before an Event) and Paths (After an Event), users can enter or exit events unpredictably, causing variations. Users may access a step from multiple preceding events or proceed to various subsequent events. In this example, Path (Before an Event) is 34,437 and Path (After an Event) is 37,081.

Case 4: Path Data (Between Events) vs. Path Data (Before/After an Event)
When comparing Paths (Between Events) and Paths (Before/After an Event), paths (Between Events) focus on a direct connection between two events, while Before/After Paths account for multiple possible connections and exits. In this example, Path (Between Events) are 2,101 (specific events) and Path (Before/After an Event) are higher counts (varied events).

Case 5: Event Data (Total Occurrences) vs. Funnel Data (Total Occurrences)

Case 6: Event Data (Total Occurrences) vs. Path Data (After an Event)
When comparing Events (Total Occurrences) and Paths (After an Event), paths (After an Event) only count events occurring within the defined lookahead window, whereas Events track all occurrences regardless of timing. In this example, Events are 40,293 and Paths are 37,081.

Case 7: Event Data (Unique Occurrences) vs. Path Data (After an Event)
When comparing Events (Unique Occurrences) and Paths (After an Event), events focus on unique users, while Paths rely on total occurrences, leading to higher counts in the latter. In this example, Events (Unique Occurrences) are 22,602 and Paths are 37,081.

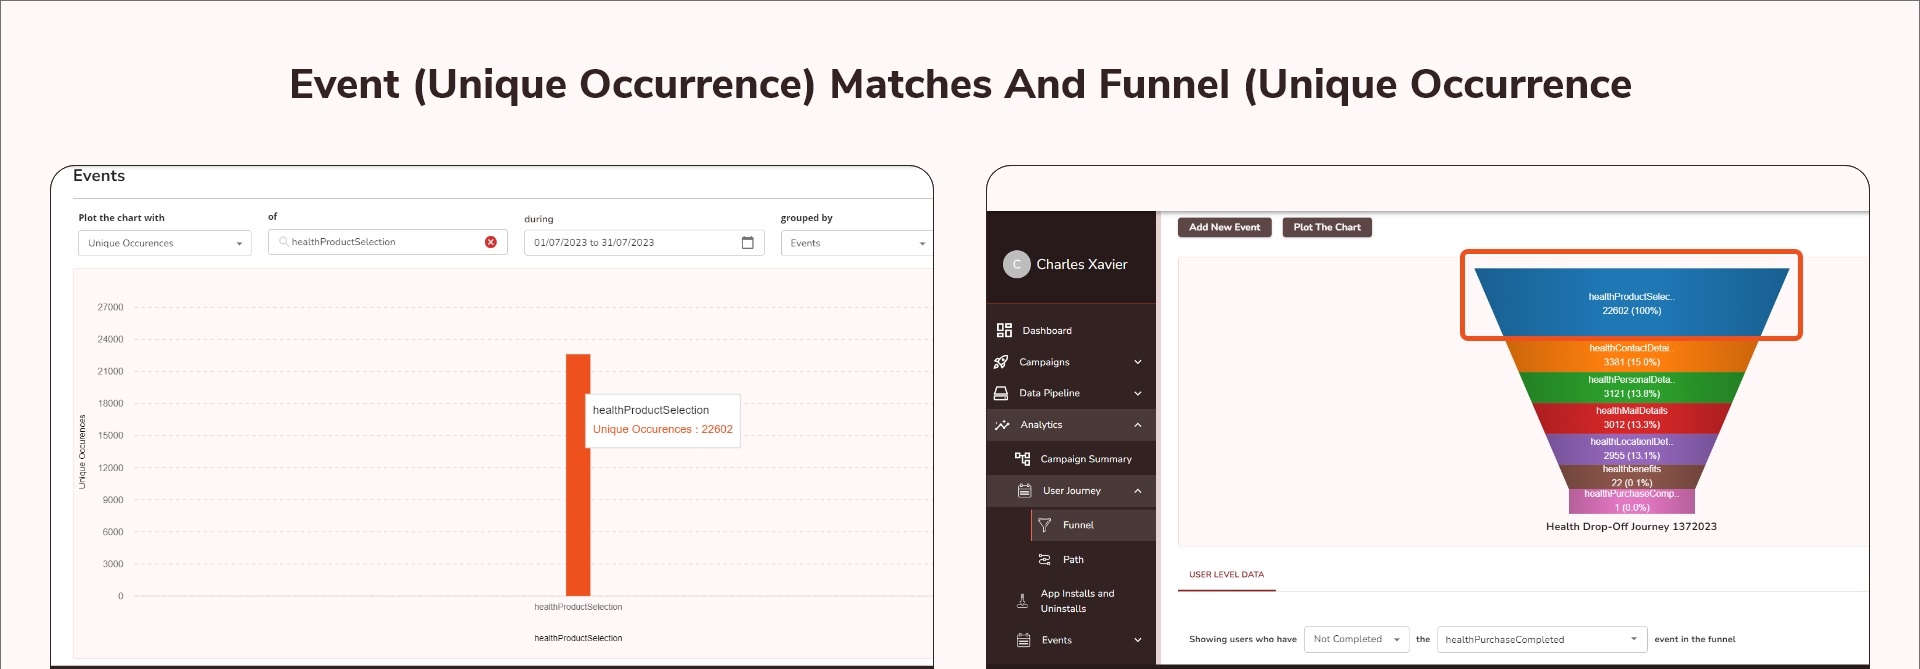
Case 8: Event Data (Unique Users) vs. Funnel Data (Unique Users)
When comparing Events (Unique Users) and Funnels (Unique Users), both measure the data based on unique users, ensuring consistency. In this example, Events (Unique Users) and Funnels (Unique Users) are 22,602.