Funnels
This page provides a comprehensive overview of funnel reporting, including its use cases, steps to create funnels, and methods to optimize user engagement. Funnel reporting is a key feature in marketing automation platforms that helps businesses analyze customer journeys, identify drop-offs, and take actionable steps to improve conversion rates.
Funnel reporting tracks the performance of marketing campaigns by visualizing user behavior across defined conversion paths on websites or mobile applications. It helps marketers prevent users from deviating from the intended path and optimize engagement and conversions.
Key Use cases
- Lead Generation: Track and analyze lead generation campaign performance to identify effective tactics that drive users through the funnel.
- Sales Conversion: Monitor sales conversion campaigns performance to determine strategies that convert leads into paying customers.
- Customer Retention and Loyalty: Evaluate retention and loyalty initiatives to ensure users remain engaged with your brand.
- ROI Tracking: Measure the return on investment (ROI) of various campaigns to prioritize resources for the most profitable ones.
Creating a Funnel
To create a funnel for tracking user journeys, follow the steps below:
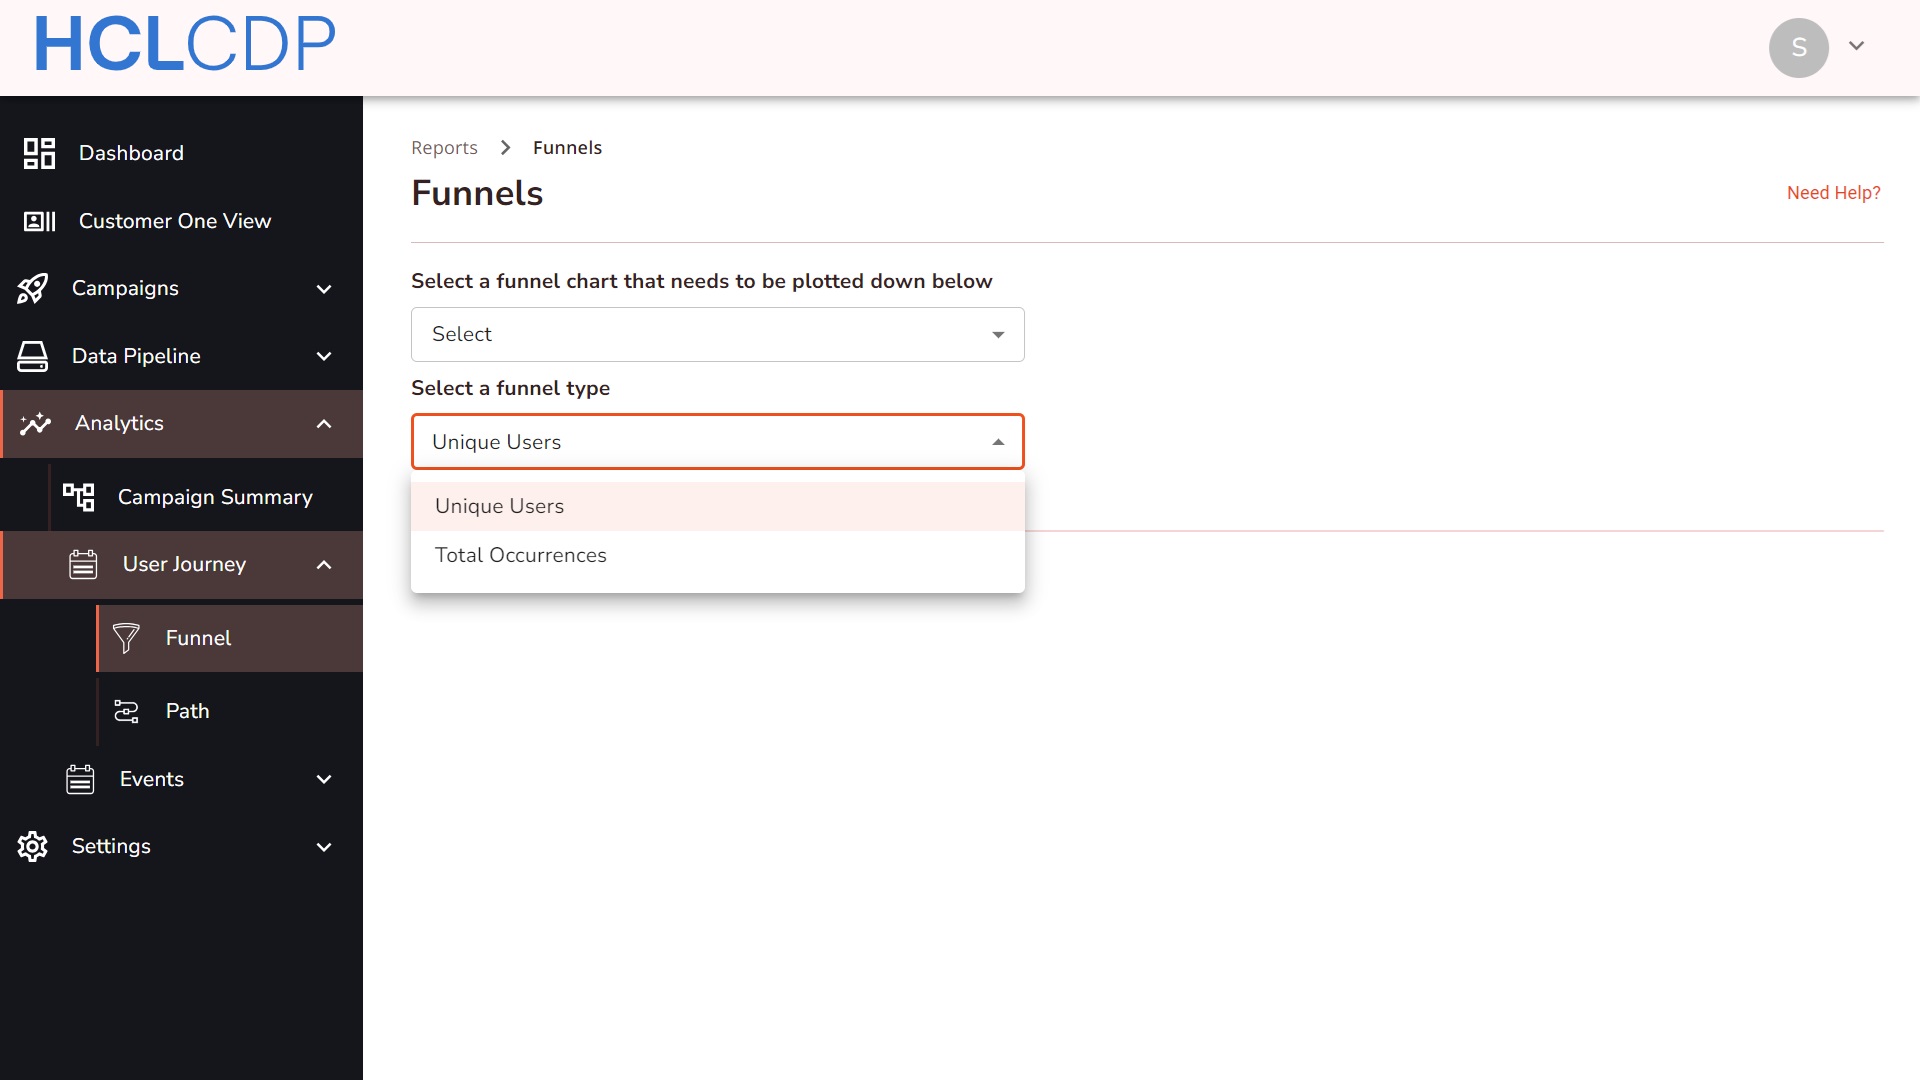
- Navigate to Analytics> User Journey > Funnel.
- In the Funnel page, from the Select a funnel chart drop-down list, select
Create A New Chart.

- In the Select a funnel type, select one of the following types.
- Unique Users: Tracks unique users who interact with your website/application during a specific time frame.
- Total Occurrences: Tracks the frequency of user events rather than unique users.
- Select Time Frame: Define the duration for the funnel using a date range.
- Add Events: Choose the sequence of events (e.g., page visits, clicks) users must perform.
- Apply Filters: Use filters to include/exclude specific URLs or properties
for granular analysis.
- For events Open, Click and Impressions, you can filter the funnel in Segment and Engagement level. These events were tracked from HCL CDP's Add External API Engagement.
- For events Track,Page visited, Page and Identify type, you can filter the events based on URL
Tip: It's mandatory to add URLs in the filters if you are selecting the eventPage Visited. Also, the eventIdentifywill not provide the option to filter the URLs.
Example Use cases for Funnel Reporting
Use Case 1: Analyze Drop-offs in a Lead Conversion Funnel
You want to maximize leads from your website. Your conversion funnel has three events:
- credit_card_page: Users visit a product page as Event 1.
- productViewed: Users click a product as Event 2.
- formSubmit: Users submit the lead form as Event 3.
Process:
- In the Funnel page, add these events to the funnel, set date range, and click Plot Funnel.
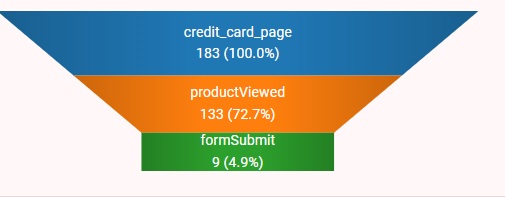
From the Funnel chart above, the maximum drop-off is between Event 1 and Event 2. This helps the marketeer get the insights that a lot of users who visit the page are not clicking the button for the lead form submission model. Now, the marketeer can take actions based on this data such as :
- Analyze the data to identify where drop-offs occur (e.g., fewer clicks or form submissions).
- Take corrective actions, such as making the product more appealing or prompting form completion with onsite notifications.
Use Case 2: Filter Funnel based on Engagement_Impression
You want to track users engaging with your campaign using specific browsers.
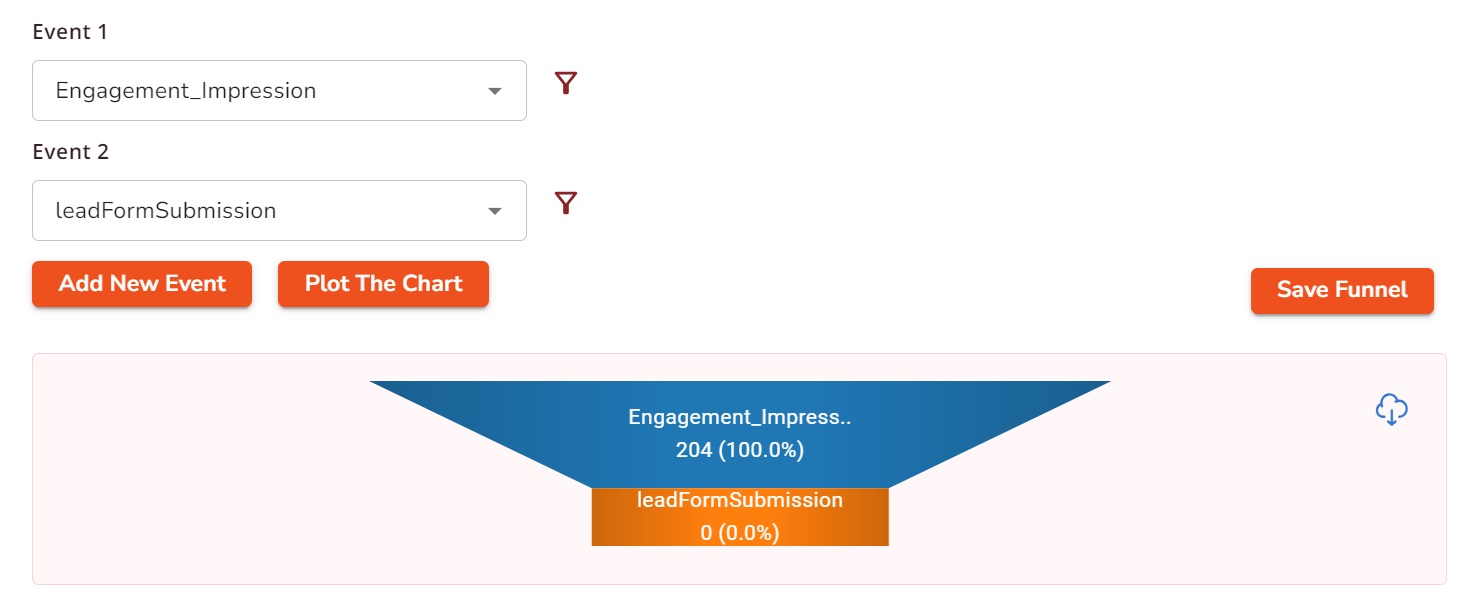
- In the Funnel page, select
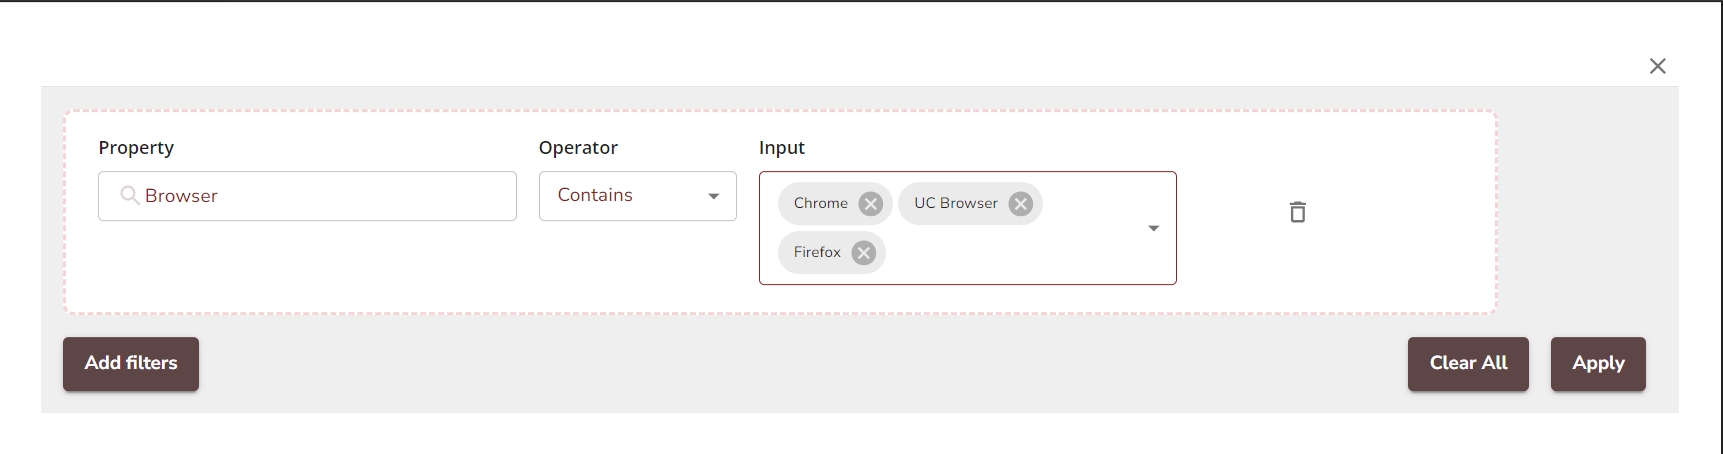
Engagement_Impressionfrom the drop-down in Event 1. - Click the Filter icon, select Add Filter and apply the filters
as follows.
- Property: Browser
- Operator: Contains
- Input: Chrome, UC Browser, Firefox
- Select
LeadFormSubmittedin Event 2, and click Plot the Chart.The funnel will be plotted as shown below,
Managing Funnels
Adding and Deleting Events
To add new events, click the Add New Event button displayed below the events. Similarly, to delete the events, click (-) icon displayed next to each event.
Saving and Updating Funnels
To save the funnel, click the save icon, name your funnel, and click Save. The saved funnel chart can be fetched under the Select new funnel chart field.
Similarly, to update the existing funnel, add the additional events as shown below.
Data Visualization and Analysis
Splitting Funnel Data
You can split the funnel data into meaningful segments:
- Date: View performance for each date.
- Week: Analyze trends weekly.
- Month: Track long-term engagement trends.

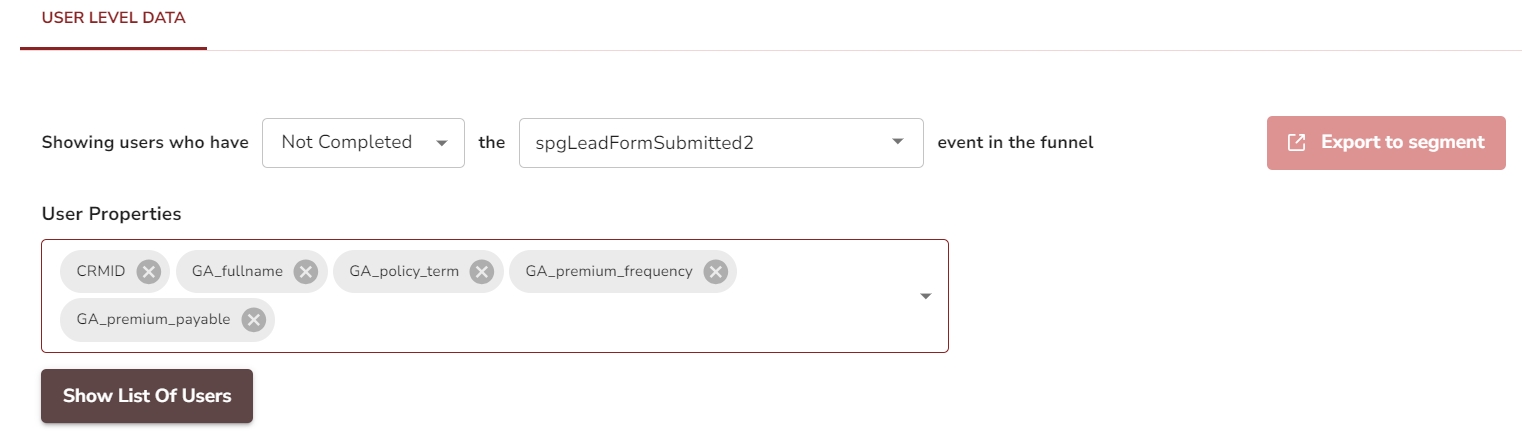
User Level Data
User-level data provides detailed insights into individual users who have not entered a specific funnel or have exited the platform without achieving the desired goal. This data helps marketers identify these users, analyze their behavior, and export their details into segments for targeted retargeting campaigns.
Identifying Funnel Dropouts
As a marketer, identify users who completed every step in the funnel except the
final step, thereby not achieving the intended goal. Suppose the final step in
the funnel is the proceedToBuy event. You can leverage
user-level data to pinpoint individuals who failed to complete this specific
event.
To use the funnel, follow the steps below:
- Select "Not Completed": In the designated field, choose the option Not Completed.
- Specify the Event: Identify the critical event
(
proceedToBuy) as the target to track non-completions. - Fetch Data: The system retrieves details of users who did not
complete the
proceedToBuyevent, allowing you to export this data for further segmentation.
User Properties
User properties are attributes that provide detailed information about users, supporting marketers in gaining a deeper understanding of their audience. These properties are instrumental in designing and executing targeted actions based on user behavior and characteristics.
Examples of User Properties:
- Demographics: Age, gender, location.
- Behavioral Data: Frequency of platform visits, time spent on specific pages.
- Interaction Metrics: Steps completed in a funnel, abandoned steps.
- Purchase History: Items added to the cart, past purchases, or abandoned carts.
By using these properties, marketers can tailor campaigns, create personalized messaging, and implement precise retargeting strategies to re-engage users effectively.
Exporting Data and Creating Segments
- To export data, click Export to Segment after fetching user
data.
- Create Segment: Name your segment, set priority, define its type, and click Submit.
- As a result, a pop-up will display Request received successfully.
We will send you further updates through (xxx@ymail.com).
- Monitor Status: Check the segment creation status under
Campaigns > Segments.
