Campaign Summary
This page explains how Campaign Summary Reports help analyze segment performance and engagement success.
Key Features and Benefits
- Analyze Data Points: Review metrics like CTR, conversions, and opens for your segments and engagements.
- Break Down Data: Split segments and engagements by various dimensions.
- Visualize and Compare: Use graphs to compare metrics and identify trends.
HCL CDP Reporting: Insights Across Channels
HCL CDP Reporting provides actionable insights by offering data on:
- The number of users who received communications.
- Communications that bounced.
- Trends for specific metrics over time.
- Top-performing campaigns.
- Best-performing channels.
You can create precise, customizable reports to better understand campaign performance and engagement.
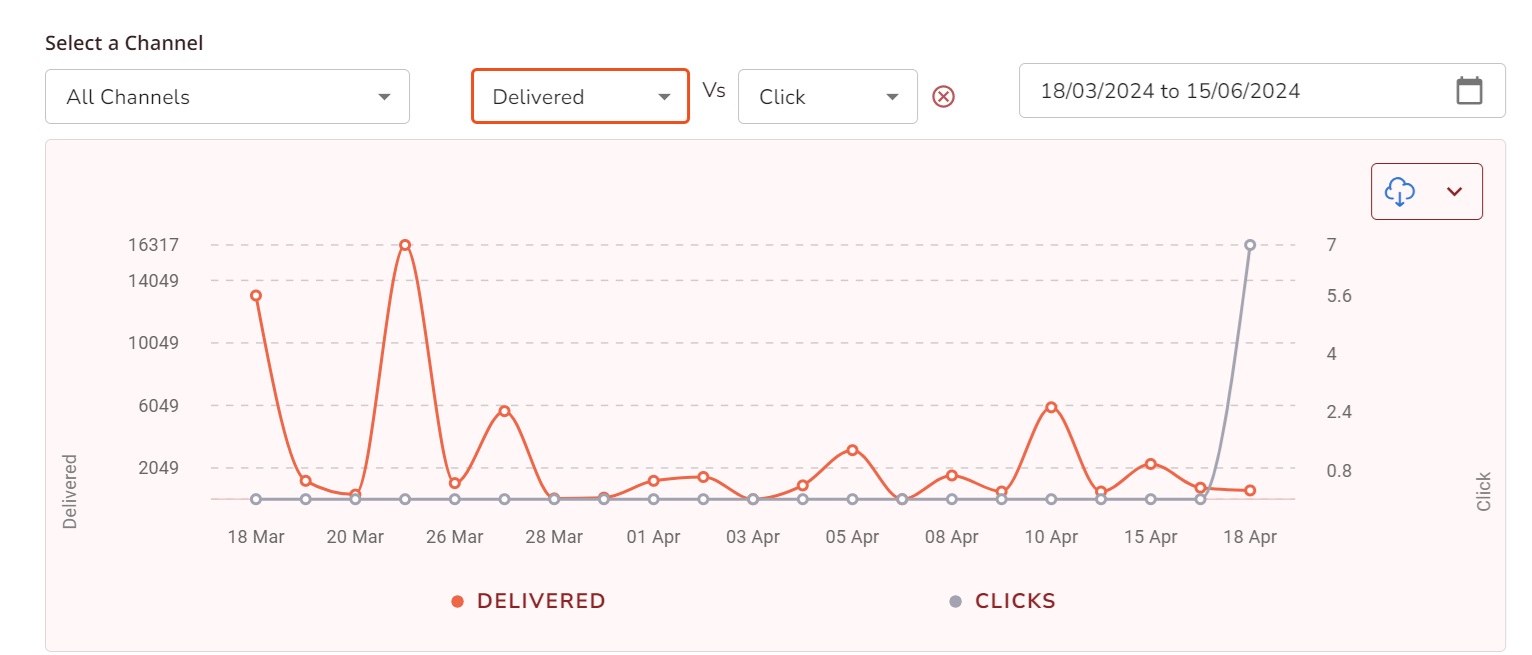
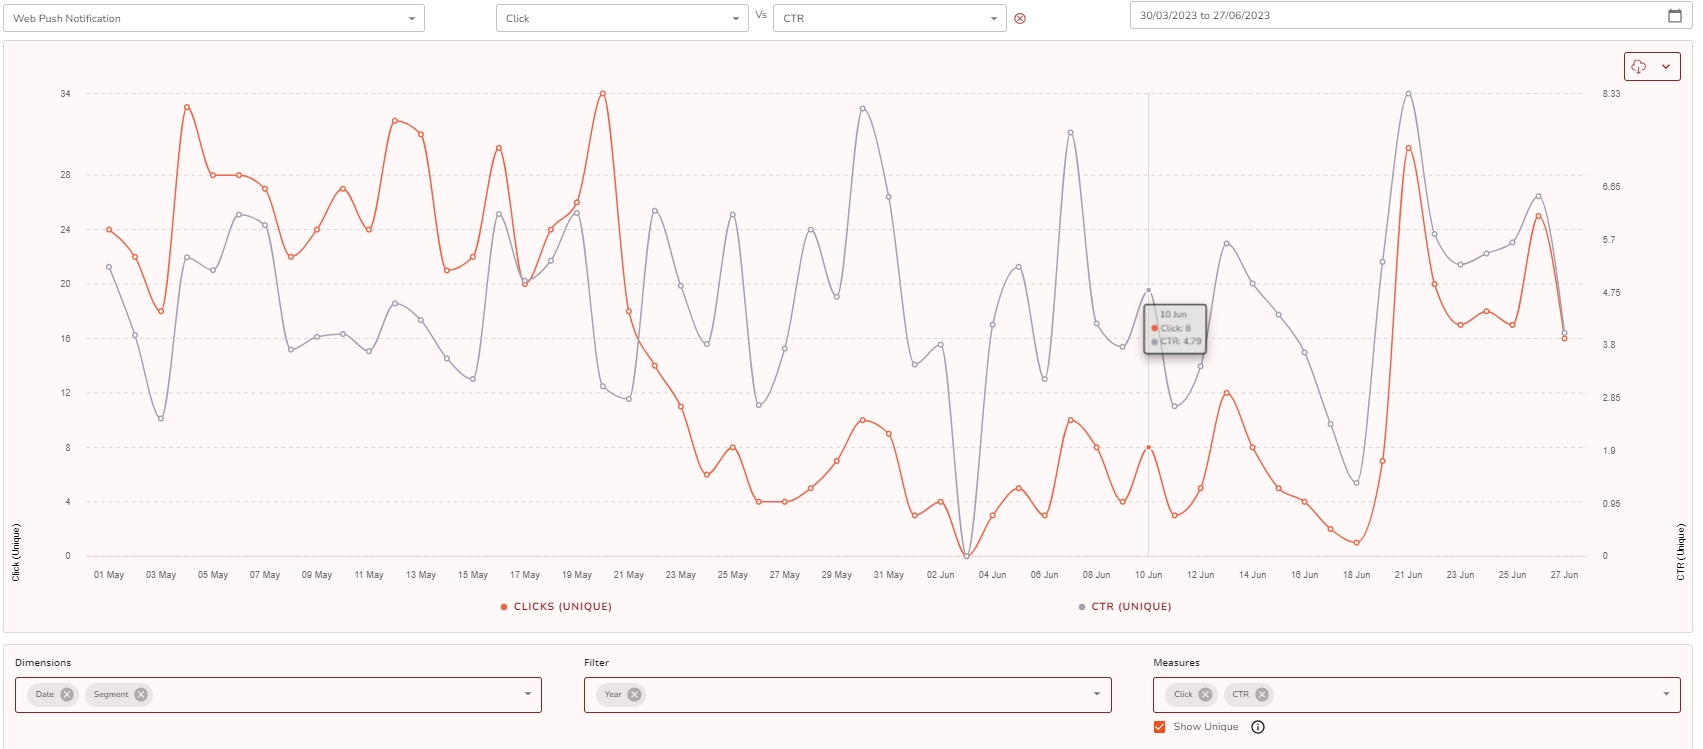
To fetch the report for the App Push Notification channel by comparing the CTR (click-through rate) and Clicks between the period 23 Dec to 29 Dec.
- Navigate to Analytics > Campaign Summary.
- Select Channels: Use this field to select the specific channel(s) for which you want to retrieve details. For more information about the channels, click here. For this example, select App Push Notification as the channel to fetch the details of campaign performance.
- Comparison: The comparison field allows comparing the stats of any two measures. For this example, select CTR and Clicks.
- Time Range: Time range supports in fetching the details between specific durations. Select the time range as 23 Dec to 29 Dec
- Graph: shows the graphical representation of the required stats.
The below fields allow customizing the data for precise reports based on your preferences.
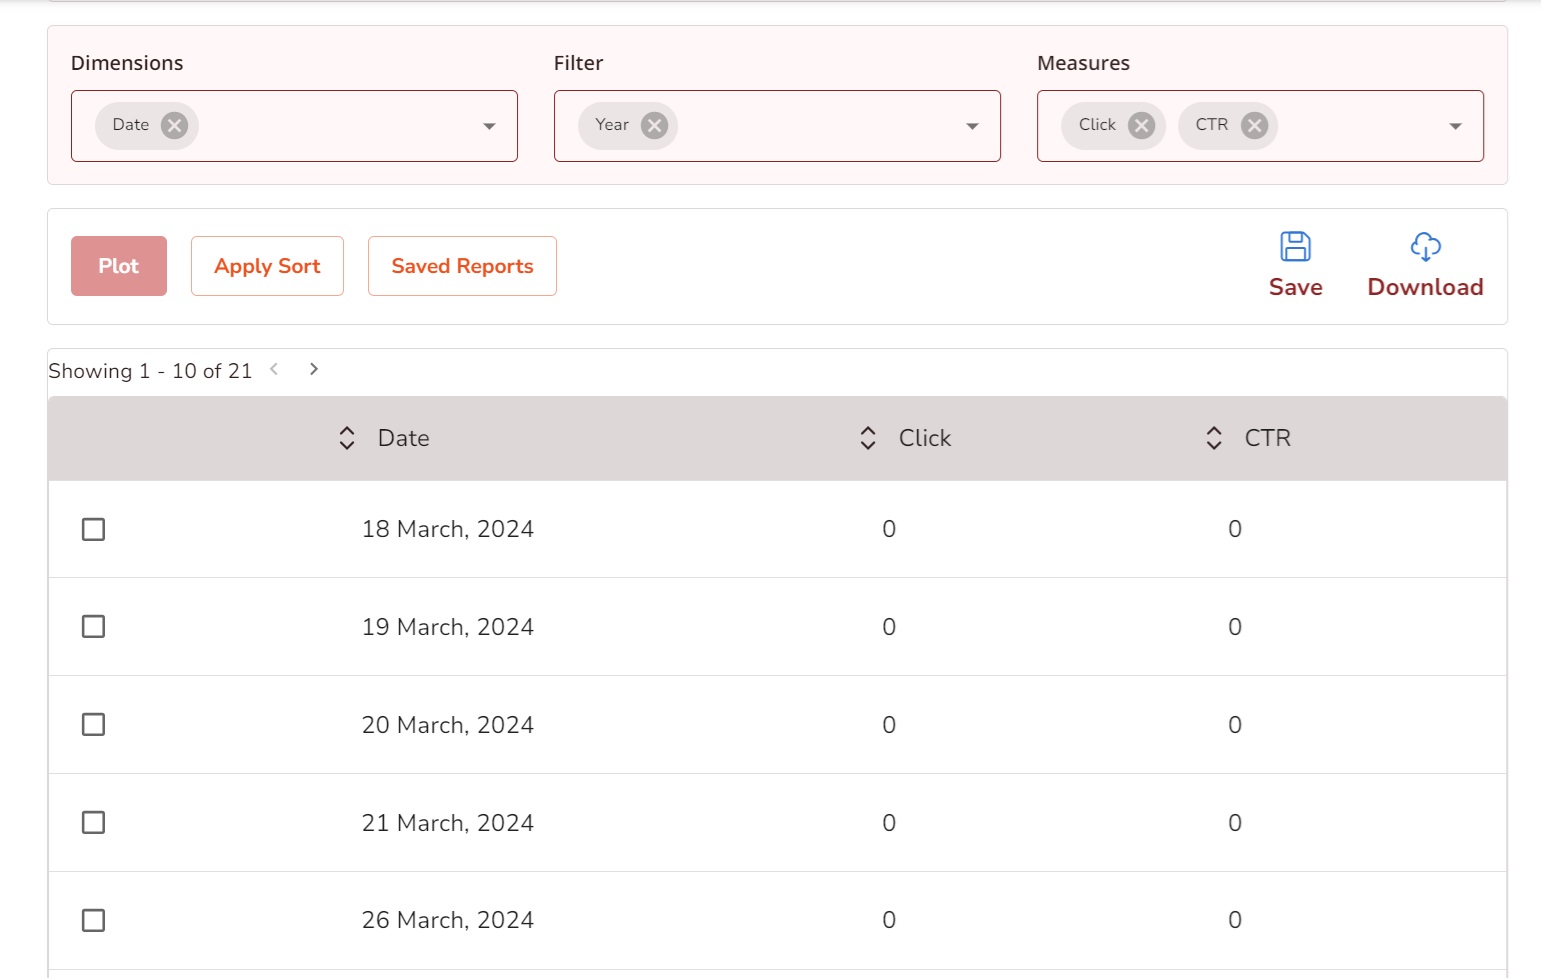
Further, if you want to generate more personalized reports for the App Push Notification channel based on the Segments, OS, and Devices for the particular region Singapore, with the measures CTR and Clicks, Dimensions, Filters and Measures are used.
Dimension: The dimension allows you to segregate the report based on different parameters.
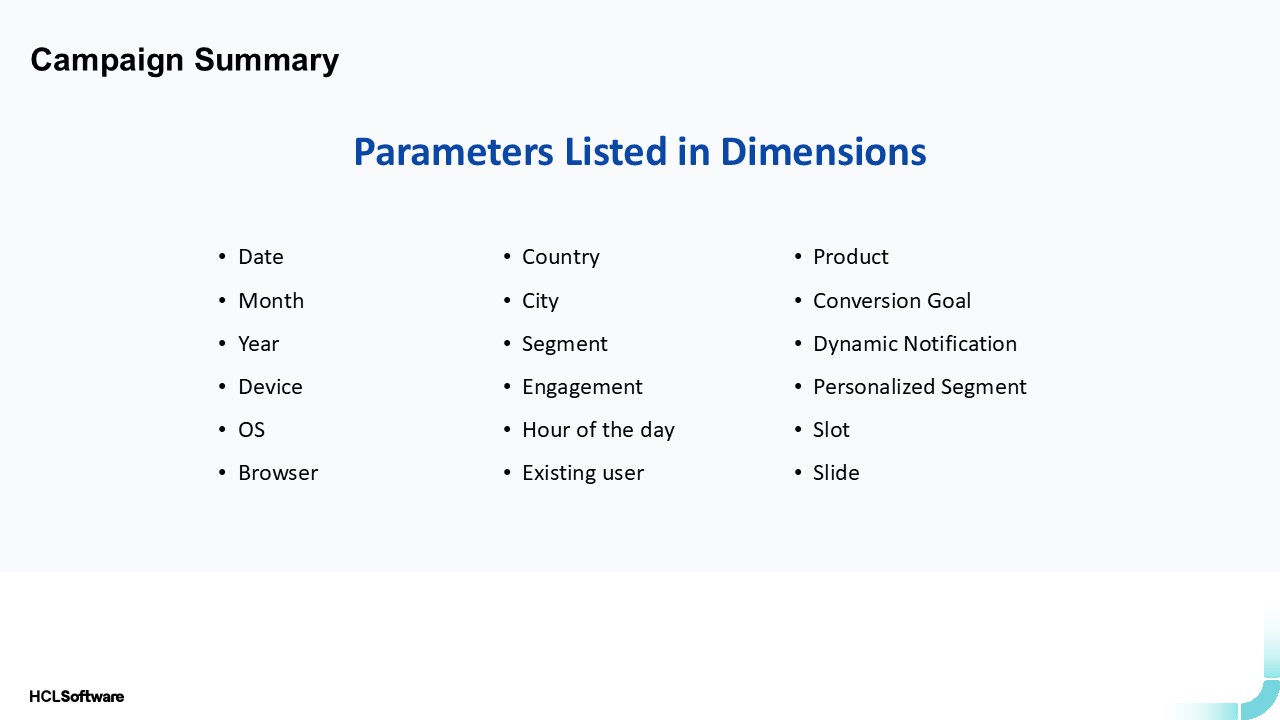
- Date: Select a specific date to generate reports for that day.
- Month: Generate reports for a selected month.
- Year: Generate reports for a specific year.
- Device: View data on actions performed through a specific device, such as mobile, PC, etc.
- OS: View data on actions performed using a particular operating system, such as Android, Windows, or Mac.
- Browser: View data on actions performed through a specific browser, such as Chrome, Safari, or Firefox.
- City: Generate reports for a specific city.
- Country: Generate reports for selected countries.
- Segment: Analyze data based on the chosen segments.
- Engagement: Analyze data for the selected engagements, supporting multiple engagements within a campaign.
- Hour of the Day: Generate reports for a specific hour of the day.
- Existing User: View actions performed by existing users within the campaign.
- Product: View data related to the selected product.
- Conversion Goal: Retrieve data on the conversion goal of your engagement.
In this example, we have selected the dimensions as Segment, OS, and Device
Filters: Filters allow you to segregate more personalized data for the selected dimensions based on your preferences. For the example, we have selected the city and personalized it to filter the data for the location as "Singapore".
Measures: Use measures to retrieve data for specific events based on the selected dimensions and filters. These measures are displayed in the table alongside the dimensions and filters.
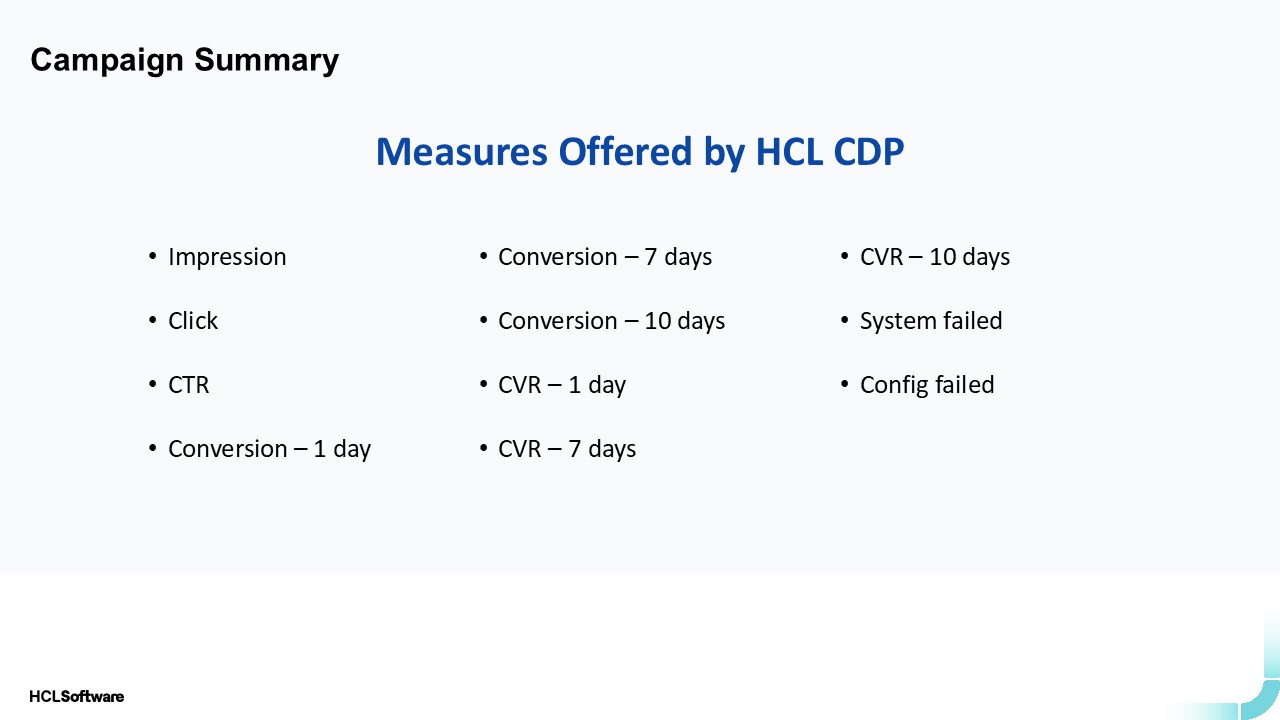
Some common measures are:
- Impression - Indicates how often users appear in the campaign.
- Click - Reflects the frequency of clicks performed in the campaign.
- CTR (Click-Through Rate) - Represents the ratio of clicks to appearances. CTR is calculated as the number of clicks divided by the number of times the engagements are shown.
- Conversion - Displays the total number of conversions achieved in the campaign.
- CVR (Conversion Rate): Represents the rate of conversions for the campaign, such as app installs or subscriptions resulting from the campaign.
- System Failed: Shows the count of system failures that occurred.
- Config Failed: Displays instances of configuration failures, e.g., when an email or notification is sent to an unsupported platform like Android instead of Windows.
- Sent: Shows the number of engagements sent to users.
- Open: Displays the number of engagements opened by users.
For this example, "Clicks and CTR" is selected as the measures to fetch the report.
Unique Metrics: By default, Campaign Summary reports include data for all users, which may include duplicates if the same user is reached multiple times during the selected period. To view metrics for unique users only, enable the ������ Show Unique option under Measures.
This feature is available only when a specific channel is selected. Supported dimensions include Segment, Engagement, Date, Month, Year, and Vendor. If any other dimension is selected, the Show Unique checkbox will not appear. In Unique Metrics, all measures are displayed except Failed.
Save & Download: click Save to save the data and enter the folder name and Report name in the popup and click Save. Your data will be saved which can be accessed from the Saved reports. The Download option supports downloading reports accordingly for further actions.
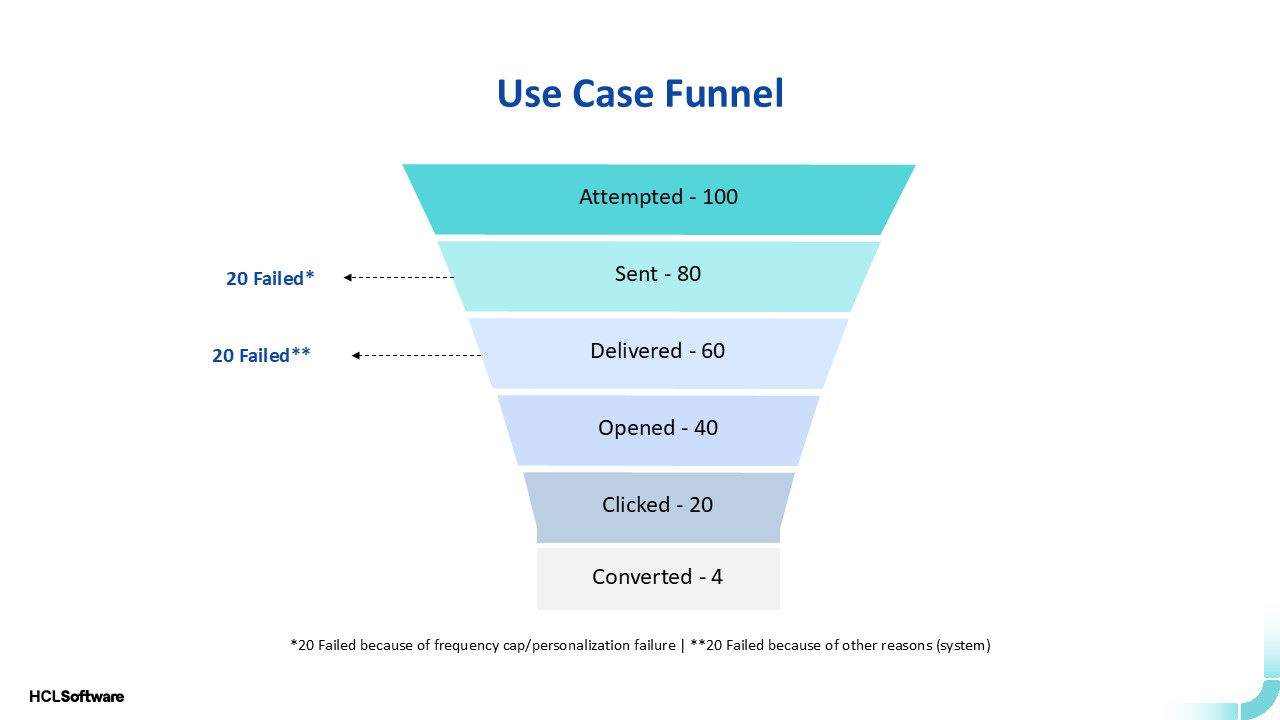
Let���s consider an email campaign to understand the flow of user communication and outcomes. As a marketer, you might want insights into how many users were targeted, how many actually received the communication, and what happened to the rest.
Here���s an example:
- From the Email channel, 100 emails were attempted. Of these, 80 were successfully sent, while 20 failed.
- Analyzing the 80 sent emails further, 60 were successfully delivered, and 20 failed.
- Out of the 60 delivered emails, 40 were clicked, with 20 emails opened and 20 failing to result in any action.
- Among the 20 opened emails, 4 successfully converted into leads.
This flow adheres to the following equation:
Delivered + Failed = Attempted
The process can be visualized through the funnel below, illustrating each stage of engagement and the outcomes at every step.
Failed Reasons and Descriptions
- Frequency Caps
- Daily: Reached the daily frequency cap limit.
- Weekly: Reached the weekly frequency cap limit.
- Monthly: Reached the monthly frequency cap limit.
- Lifetime: Reached the lifetime frequency cap limit.
- Personalization Failures: Occurs when macro replacement fails during communication.
- Others: Includes all other reasons for undelivered communication not covered by the above categories.
Channel Metrics
This section outlines the metrics and potential reasons for communication failures across different channels, including Email, SMS, WhatsApp, App Push Notifications, and Web Push Notifications. Each channel has unique metrics and failure reasons that provide insights into campaign performance and user engagement.
- Attempted: Total audience targeted for the email campaign (e.g., 100).
- Sent: Emails for which requests were successfully made to the vendor (e.g., 80).
- Delivered: Emails successfully delivered to user inboxes, based on ESP confirmation (e.g., 60).
- Opened: Emails opened by users. Data is captured via webhook events or an open tracker (e.g., 20).
- Failed Reasons:
- Frequency Caps: Exceeded daily, weekly, monthly, or lifetime limits.
- Personalization Failure: Issues in replacing macros with user-specific data.
- Hard Bounce: Permanent delivery failures due to invalid email addresses or blocking.
- Soft Bounce: Temporary delivery failures.
- Insufficient Credits: Insufficient ESP quota or client credits.
- Vendor Failure: Failures on the vendor���s or network���s end.
- Dropped: Emails dropped due to user unsubscriptions or blacklist status.
- Attempted: Total audience targeted for the SMS campaign.
- Sent: SMS successfully queued by the marketer for vendor delivery.
- Delivered: SMS delivered to users��� inboxes, as confirmed by SSP.
- Clicked: SMS clicked by users, tracked via webhook or click tracker. Unique click counts are also calculated.
- Failed Reasons:
- Frequency Caps: Exceeded limits for sending SMS.
- Personalization Failure: Issues in macro replacement.
- Hard Bounce: Permanent failures due to invalid numbers or blocks.
- Soft Bounce: Temporary delivery failures.
- Insufficient Credits: SSP quota or credit limit exceeded.
- Dropped: SMS dropped for reasons such as blacklisted contacts.
- Pending: Pending delivery from the vendor���s end (e.g., Tubelight).
- Invalid Sender ID: Sender ID is invalid.
- Duplicate Message Drop: Duplicate messages sent to the same number (e.g., Netcore).
- Blacklist: Number is blacklisted (e.g., Netcore).
- Vendor/Operator Failure: Failures due to vendor or network issues.
- DND List: SMS blocked as the number is on the DND list (e.g., Netcore).
- DLT Error: Non-whitelisted SMS template (e.g., Infobip).
- Attempted: Total audience targeted for the WhatsApp campaign.
- Sent: WhatsApp messages successfully queued by the marketer.
- Delivered: Messages delivered to users��� inboxes, based on WSP confirmation.
- Opened: Messages opened or read by users.
- Subscribed: Number of users who opted in for WhatsApp communication.
- Unsubscribed: Number of users who opted out, making them unreachable for future campaigns.
- Failed Reasons:
- Frequency Caps: Exceeded messaging limits.
- Personalization Failure: Issues in macro replacement.
- Invalid WhatsApp Number: Messages sent to unregistered numbers.
- Insufficient Credits/Rate Limit: Credit or quota limit exceeded.
- Not Opted-in: Recipient has not opted in.
- International Number Not Supported: Vendor does not support international numbers.
- Template Mismatch: Mismatch or non-existence of the message template.
- Queued: Message requests queued by the vendor.
- Vendor Failure: Failures on the vendor or network end.
- Attempted: Total audience targeted for app push notifications.
- Sent: Notifications successfully queued by the marketer for delivery.
- Delivered: Notifications delivered to end users. Events such as clicks or dismissals without delivery are also reported here.
- Clicked: Notifications clicked by users (unique counts calculated).
- Dismissed: Notifications dismissed by users (unique counts calculated).
- Failed Reasons:
- Frequency Caps: Exceeded notification limits.
- Personalization Failure: Issues in macro replacement.
- Unsubscribed: Users who unsubscribed are marked as unreachable for future notifications.
- FCM Failure: Notifications sent but not delivered by FCM.
- Not Delivered: Notifications marked as delivered by FCM, but no response from the SDK.
- Attempted: Total audience targeted for web push notifications.
- Sent: Notifications successfully queued by the marketer.
- Delivered: Notifications delivered to end users. Events like clicks or dismissals without delivery are included here.
- Clicked: Notifications clicked by users (unique counts calculated).
- Dismissed: Notifications dismissed by users (unique counts calculated).
- Failed Reasons:
- Frequency Caps: Exceeded notification limits.
- Personalization Failure: Issues in macro replacement.
- Unsubscribed: Users who unsubscribed are marked as unreachable.
- FCM Failure: Notifications sent but not delivered by FCM.
- Not Delivered: Notifications marked as delivered by FCM but no response from the SDK.