
Analysis detail page
The analysis detail page shows the definition of a single analysis: its details, the device scope that determines which devices report on it, and the properties that it evaluates.
To open the detail page, on the Analyses tab, select an analysis name. The page title shows the analysis name, the time of the last update, and a status chip that indicates the activation state, for example Not Activated. A breadcrumb at the top of the page returns you to the Analyses list.
The actions are in the upper-right corner of the page:
- Delete - Removes the analysis from the deployment. Select the delete icon, and then confirm the deletion in the Delete analysis dialog. See Editing and deleting an analysis.
- View results - Opens the results of the analysis in the device list, where you can review the values that the devices report for each property. The icon is enabled only when the analysis is activated. If the analysis was activated locally, the results are visible only to the operator who activated it.
- Activate - Activates the analysis so that devices in the scope start to report property values. The button changes to Deactivate when the analysis is activated.
- Edit analysis - Opens the analysis in the Edit analysis wizard, where you can change the details, the device scope, and the properties. See Editing and deleting an analysis.
The following example shows an analysis that is hosted on an external site. The delete icon and Edit analysis are dimmed.
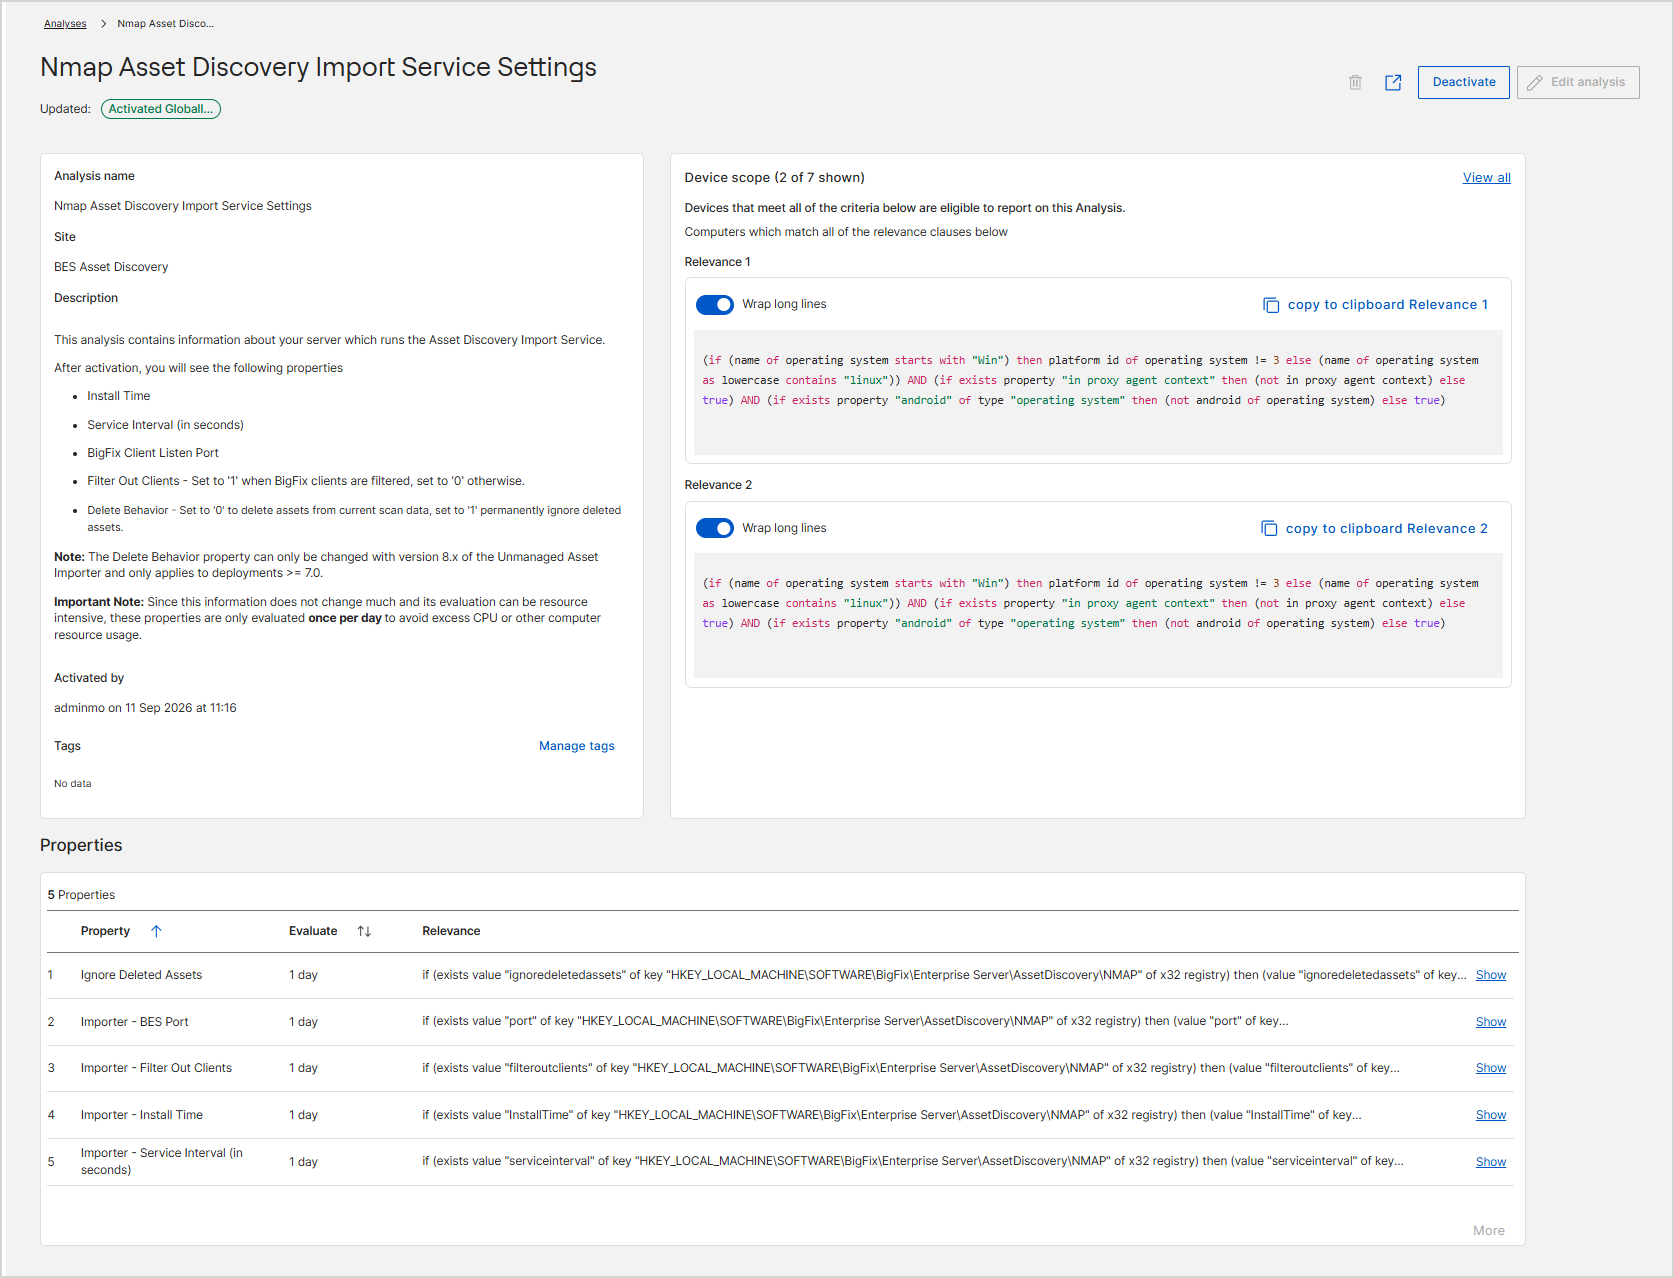
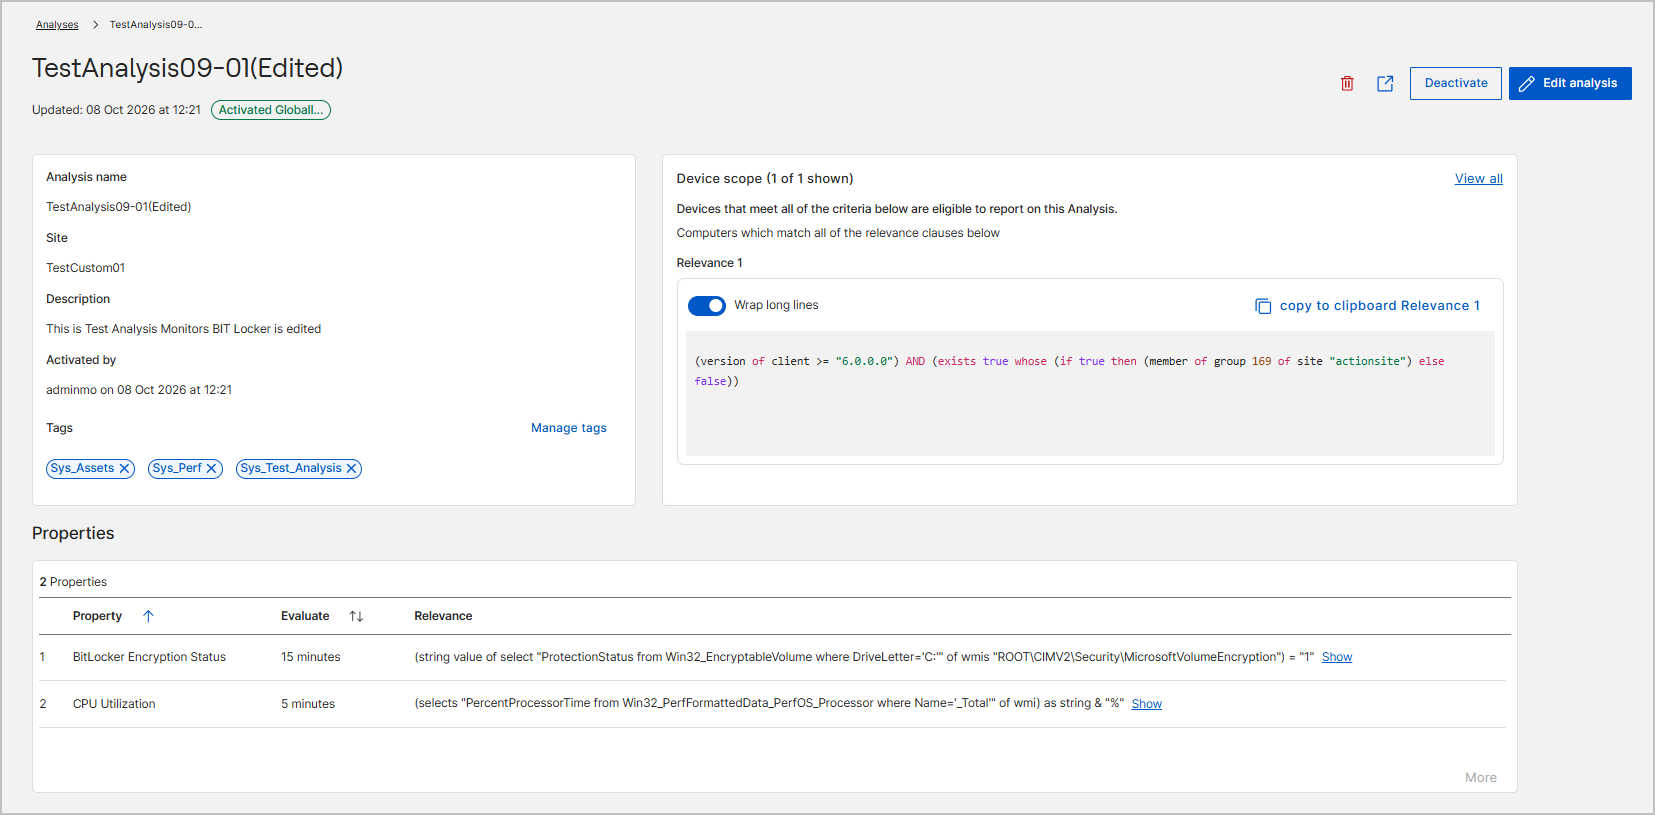
The next example shows an analysis that is hosted on the custom site TestCustom01. The delete icon and Edit analysis are enabled.
Analysis details
The details card shows the following information:
| Field | Description |
|---|---|
| Analysis name | The name of the analysis. |
| Site | The site that hosts the analysis. |
| Description | The description of the analysis, if one was entered. |
| Activated by | The operator who activated the analysis, and the date and time of the activation. This field is empty until the analysis is activated. |
| Tags | The tags that are assigned to the analysis. Each tag appears as a chip, for example Sys_Assets. Select the close icon on a chip to remove that tag. Select Manage tags to open the Manage tags drawer and add tags. After you assign or remove tags, the drawer closes and the details card refreshes automatically. If no tag is assigned, the field shows No data. For more information, see Managing Tags. |
Device scope
The Device scope panel shows the criteria that determine which devices are eligible to report on the analysis. Devices that meet the criteria report their property values.
Each relevance clause is displayed in a code block. In each block, you can turn on Wrap long lines to wrap the expression, select Copy code to copy it, or select Show More to expand a long expression. When the analysis has more clauses than the panel shows, the panel heading indicates how many are shown, for example Device scope (2 of 4 shown). Select View all to open the Scope (devices) panel, where you can view and edit the full scope definition.
Activation
To activate the analysis, select Activate at the top of the detail page. You can deactivate an activated analysis from the same page. A confirmation message appears when the analysis is activated or deactivated, and the status chip under the page title is updated. Devices report property values only while the analysis is activated, and the View results icon is enabled only when the analysis is activated.
View results
Select the View results icon in the upper-right corner of the page to open the analysis results in the device list. The results show the value that each device in the scope reports for every property in the analysis. From there, you can filter the list, choose the columns to display, and export the data. For more information, see Exporting and sharing analysis results.
The icon is dimmed until the analysis is activated. If an operator activated the analysis locally, only that operator can view its results.
Properties
The Properties section lists the properties in the analysis, along with the total count. Select More to view additional properties. The following table describes the columns:
| Column | Description |
|---|---|
| Property | The property name. |
| Evaluate | How often devices evaluate the property, for example 15 minutes or 7 days. |
| Relevance | The relevance expression that produces the property value. Select Show to view the full expression. |