Devices
The Device Explorer lets you view, monitor, and act on all the devices connected to your BigFix environment. Use the Overview page for a high-level, chart-based summary, and the List view page to work with device inventory in a customizable table.
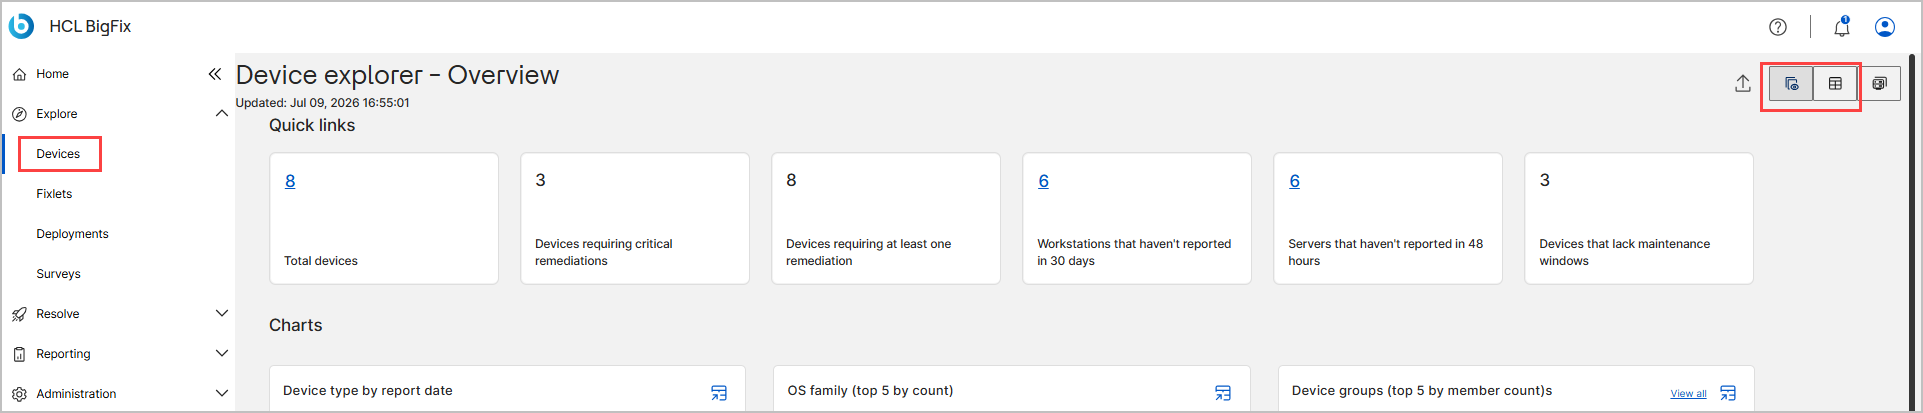
To open the Device Explorer, expand Explore in the side navigation and select Devices. Use the view icons in the top-right corner to switch between the Overview (charts) page and the List view page. Both pages show an Updated timestamp that indicates when the data was last refreshed.
Before you begin
Access to this application is controlled by the role that your administrator assigns to you. If your role does not grant the application, it does not appear in the side navigation, and the actions described in this topic are unavailable or dimmed.
- Your role must grant access to this application. Device Explorer is a default application, so every role has at least view access to it. See Managing Roles.
- Your role also defines the device scope, so you see only the devices that your role can manage. See Managing Roles.
- Your operator permissions determine which actions you can complete. For a description of each permission, see Permissions reference.
Device Explorer – Overview page
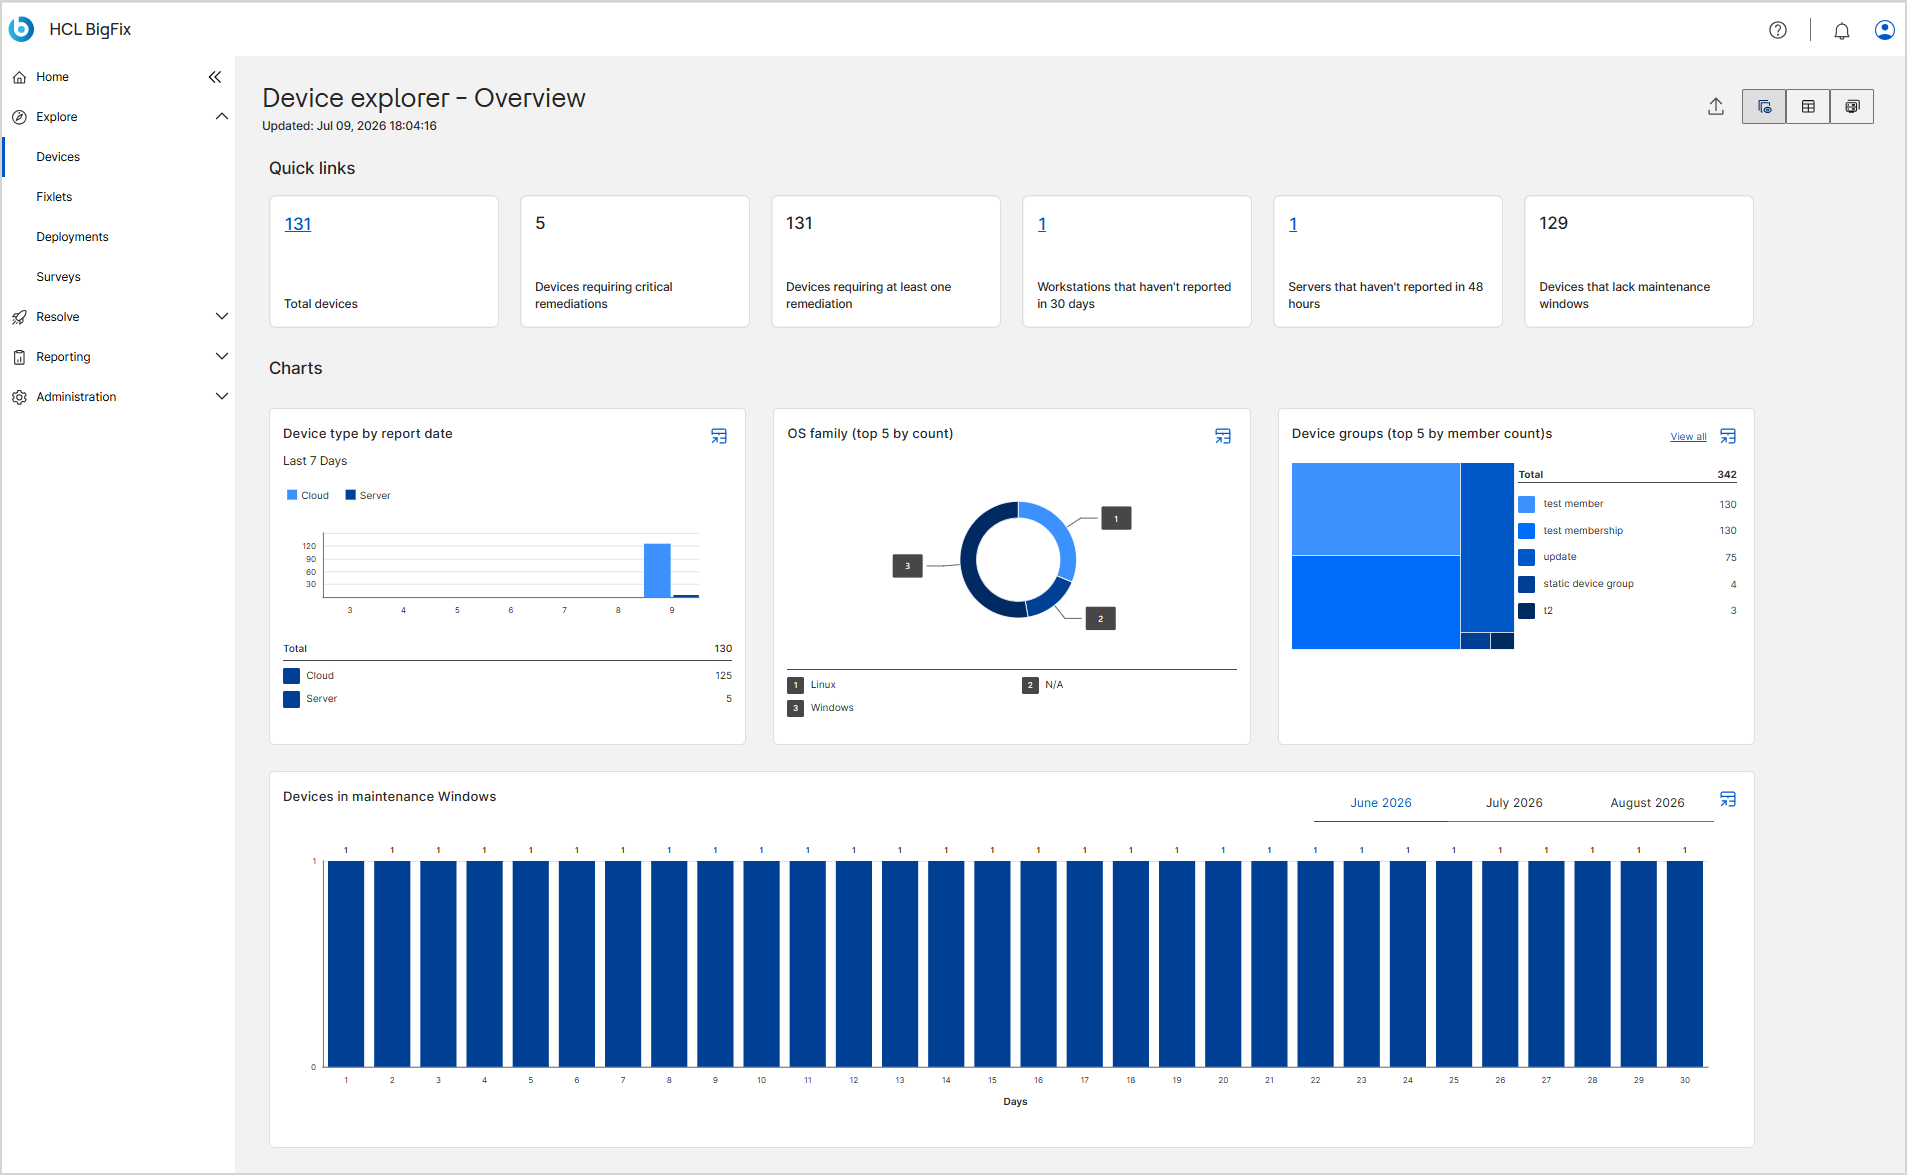
The Overview page provides a high-level summary of your device environment through quick links and interactive charts. Use it to monitor device health, reporting status, remediation needs, and group distribution before you drill down into individual device data.
The top-right corner includes an Export (share) icon that exports the current page data and a Device groups icon that opens the Device Groups page. For more information, see Device Groups.
Quick links
The Quick links section at the top of the page provides fast access to commonly monitored device conditions. Each tile shows a count.
| Quick link | Description |
|---|---|
| Total devices | The total number of devices that BigFix currently manages. |
| Devices requiring critical remediations | The number of devices that are missing security-critical patches or updates and require immediate attention. |
| Devices requiring at least one remediation | The number of devices that require any remediation, both critical and non-critical. |
| Workstations that haven't reported in 30 days | Workstation devices that haven't reported to BigFix in the last 30 days. |
| Servers that haven't reported in 48 hours | Server devices that haven't reported to BigFix in the last 48 hours. |
| Devices that lack maintenance windows | Devices that don't have an associated maintenance window. |
Charts
The Charts section presents high-level metrics as interactive chart widgets.
| Chart | Description |
|---|---|
| Device type by report date | Shows device counts grouped by device type based on their most recent report date, over a selected period such as the last 7 days. |
| OS family (top 5 by count) | Displays the top five operating system families in your environment, ranked by the number of devices. |
| Device groups (top 5 by member count) | Shows the five device groups with the most member devices, with the group name and member count. Select View all to open the Device Groups page. |
| Devices in maintenance Windows | Shows the number of devices in active maintenance windows. Select a month tab to view the distribution across the days of that month. |
Each chart has a See data in data table format with download options icon in its top-right corner. Select it to view the chart's data as a table that you can copy or export. for more information, see Viewing chart data in a table.
Device Explorer – List view page
The List view page is the central workspace for managing and monitoring the endpoints in your environment. Use it to view inventory data in a customizable table, build charts from device properties, and run administrative actions on one or more devices. The page is organized into a view and utility bar, a collapsible Charts section, a command bar, and the device list table.
View and utility bar
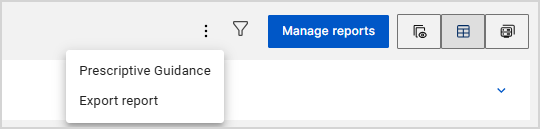
The view and utility bar in the top-right corner manages the overall display and reporting features.
| Control | Description |
|---|---|
| More options (three vertical dots) | Opens a menu with Prescriptive Guidance, which provides
actionable recommendations based on best practices, and Export
report, which downloads the tabular report for offline analysis.
For more information, see Prescriptive Guidance and Exporting Data. |
| Filter (funnel icon) | Displays a subset of devices based on criteria that you define. You can also save a filter, mark it as a favourite, and apply it again later. For more information, see Global filter. |
| Manage reports | Saves, loads, and organizes custom reports that you generate in the BigFix UI. For more information, see Manage Reports. |
| Device groups (icon) | Opens the Device Groups page, where you view and manage static and dynamic device groups. For more information, see Device Groups. |
| View icons | Switch between the Overview (charts) page and the List view page. |
Filter
The Filter icon (funnel) in the view and utility bar opens the global filter for the page. The global filter narrows the device list table to the devices that match the conditions you define, and it also drives the chart interactions described in Filtering devices from a chart.
You can save the filters that you build, so that you can reuse them without defining the same conditions again. From the Filter panel, you can save a filter under a name of your choice, list your saved filters, mark the ones you use most as favourites, apply a saved filter to the current view, and delete the filters that you no longer need. Saved filters are private to your account, and the filters that you save here apply to devices only.
For the steps to build, save, apply, and manage your filters, see Global filter.
Charts
The collapsible Charts section creates and displays custom visualizations from device inventory data. A badge next to the title, such as 0 charts set or 1 chart set, shows how many charts are defined. For the steps to create a chart and to edit, delete, or export the charts you build, see Configuring and managing device charts.
Charts are interactive and work together with the Global Filter and the device list table. For the steps to filter the device list table from a chart, see Filtering devices from a chart.
Command bar
The command bar, directly above the table, is the primary area for adjusting the table and acting on devices.

| Control | Description |
|---|---|
| Column | Opens the Manage columns drawer, where you choose which device properties appear as columns in the table. For the steps, see Manage columns. |
| Density | Adjusts the row spacing of the table. |
| View selected only | When turned on, limits the table to the devices that you selected. A counter, such as 1 of 8 Devices, shows how many devices are selected. |
| Select action | Runs a command on the selected devices. Select at least one device checkbox to enable the commands. See Select action commands. |
| Remediate | Deploys a fix or configuration task to the selected devices. This button stays dimmed until you select at least one device that requires remediation. |
| Search | Filters the list as you type a keyword, such as a computer name or ID. |
Select action
The Select action dropdown provides the following commands for the selected devices.

| Command | Description |
|---|---|
| Set maintenance window | Defines a period for updates or maintenance on the selected devices. For more information, see Managing Device Maintenance Windows. |
| Update client settings | Modifies configuration settings for the BigFix client on the selected devices. For more information, see Update Client Settings. |
| Unset maintenance window | Removes an existing maintenance schedule from the selected devices. For more information, see Managing Device Maintenance Windows. |
| Remove device(s) | Removes the selected devices from the inventory. Delete devices. |
| Add to static group | Adds the selected devices to an existing static device group, or to a new static group that you name. For more information, see Managing Static Group Membership. |
Device list table
The device list table displays details about the discovered devices in your environment. Select a device's Computer Name to open its Device Details page.
Each column header includes a sort icon: select it once to sort ascending, again to sort descending, and again to clear the sort. The table can include the following columns.
| Column | Description |
|---|---|
| Number | The order in which BigFix added the device. |
| Computer Name | The BigFix computer name assigned to the device. Select it to open the Device Details page. |
| Active Directory Path | The Active Directory path of the device. |
| Agent Type | The type of BigFix agent installed on the device. |
| Agent Version | The version of the BigFix agent installed on the device. |
| BES Relay Selection Method | How the device selected its relay: Automatic (selected by BigFix) or Manual (manually configured). |
| BES Relay Service Installed | Whether a BES Relay service is installed on the device, such as BES Root Server or Not Installed. |
| BES Root Server | The BigFix root server that the device reports to. |
| BIOS | The BIOS version or date reported by the device. |
| Client Administrators | The administrators defined for the BigFix client on the device. |
| Client Settings | The client settings applied to the device. |
| Computer Group | The device groups that the device belongs to. |
| Computer Type | The hardware type of the device, such as physical or virtual. |
| CPU | The processor type and speed reported by the device. |
| Device Type | The type of device, such as Server or Workstation. |
| Distance to BES Relay | The distance between the device and its assigned relay. |
| DNS Name | The fully qualified DNS name of the device. |
| Free Space on System Drive | The available disk space on the system drive of the device. |
| IDP Computer Groups | The computer groups reported by the identity provider. |
| IDP User Department | The department of the device user, as reported by the identity provider. |
| IDP User Display Name | The display name of the device user, as reported by the identity provider. |
| IDP User Groups | The groups that the device user belongs to, as reported by the identity provider. |
| IDP User Location | The location of the device user, as reported by the identity provider. |
| IDP User Principal Name | The principal name of the device user, as reported by the identity provider. |
| IDP User Site | The site of the device user, as reported by the identity provider. |
| InMaintenanceWindows | Whether the device is currently associated with a maintenance window, such as yes, no, or not set. |
| IP Address | The IP address reported by the device at its last check-in. |
| IPv6 Address | The IPv6 address reported by the device at its last check-in. |
| Last Report Time | When the device last reported to BigFix. |
| LastMaintenanceWindow | The most recent maintenance window that applied to the device. |
| License Type | The license type that covers the device. |
| Lock Expiration | When the lock on the device expires. |
| Locked | Whether the device is locked and excluded from deployments. |
| MAC Address | The MAC address of the device network interface. |
| MaintenanceWindowException | Any exception defined for the maintenance window of the device. |
| MaintenanceWindowProjections | The projected maintenance windows for the device. |
| NextMaintenanceWindow | The next maintenance window scheduled for the device. |
| OS | The operating system reported by the device. |
| OS Family | The operating system family, such as Windows or Linux. |
| OS Name | The specific operating system installed on the device. |
| OS Version | The operating system version number. |
| RAM | The amount of memory installed on the device. |
| Relay | The relay server currently assigned to the device. |
| Relay Name of Client | The relay name as reported by the client. |
| Relevant Fixlet Count | The number of Fixlets that are currently relevant to the device. |
| Remediated Fixlet Count | The number of Fixlets that have been successfully applied to the device. |
| Subnet Address | The subnet address of the device. |
| Subscribed Sites | The sites that the device subscribes to. |
| Total Size of System Drive | The total capacity of the system drive of the device. |
| User Name | The user that is logged in to the device. |
Manage columns
Select Column in the command bar of the List view page to open the Manage columns drawer. The drawer lists only Reserved, Derived, Custom, Active Analysis, and External properties. For each property, it shows the Category, the Analysis it comes from, and the Sitename.
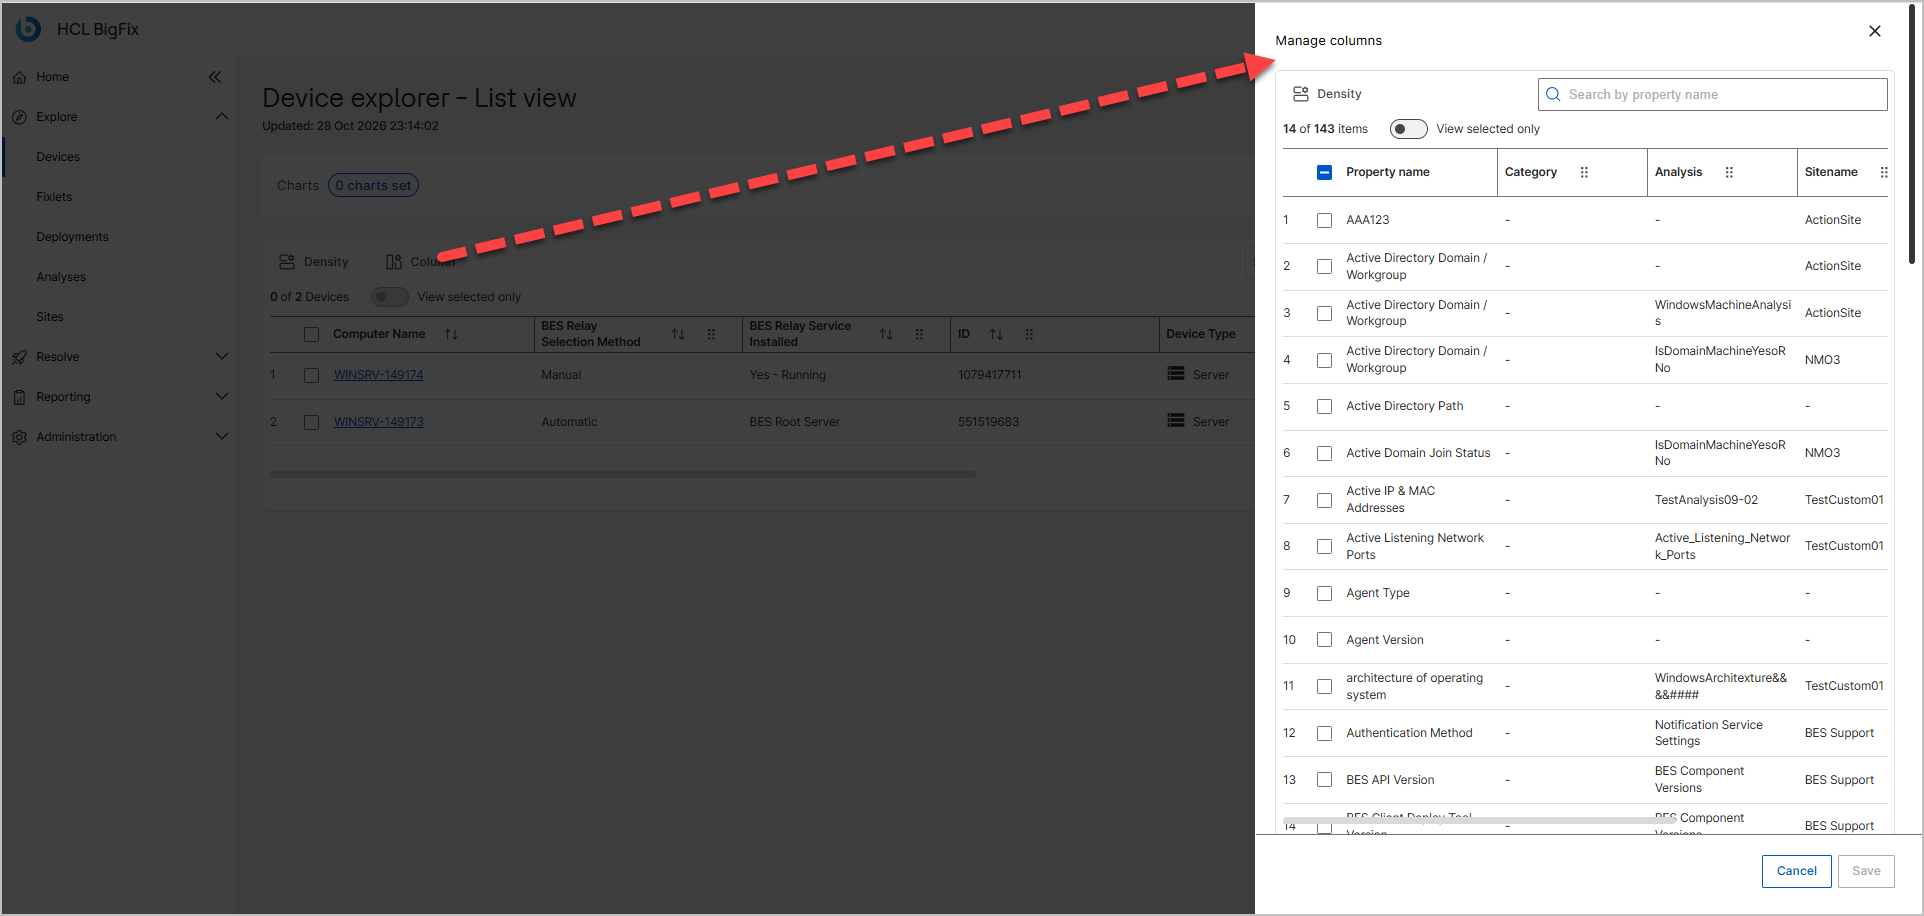
- Above the table, select Column. The Manage columns drawer opens.
- Optional: In Search by property name, enter a property name to narrow the list.
- Optional: Turn on View selected only to list just the properties that you already selected.
- Select the checkbox next to each property that you want to display as a column, and
clear the checkbox for each property that you want to hide. The counter above the list,
such as 14 of 143 items, shows how many properties are selected.
Note:You can display a maximum of 63 columns.
- Select Save. The table updates to show the columns that you
selected.
To close the drawer without applying your changes, select Cancel or the Close (X) icon.