 License Optimizer for
desktop applications
License Optimizer for
desktop applications
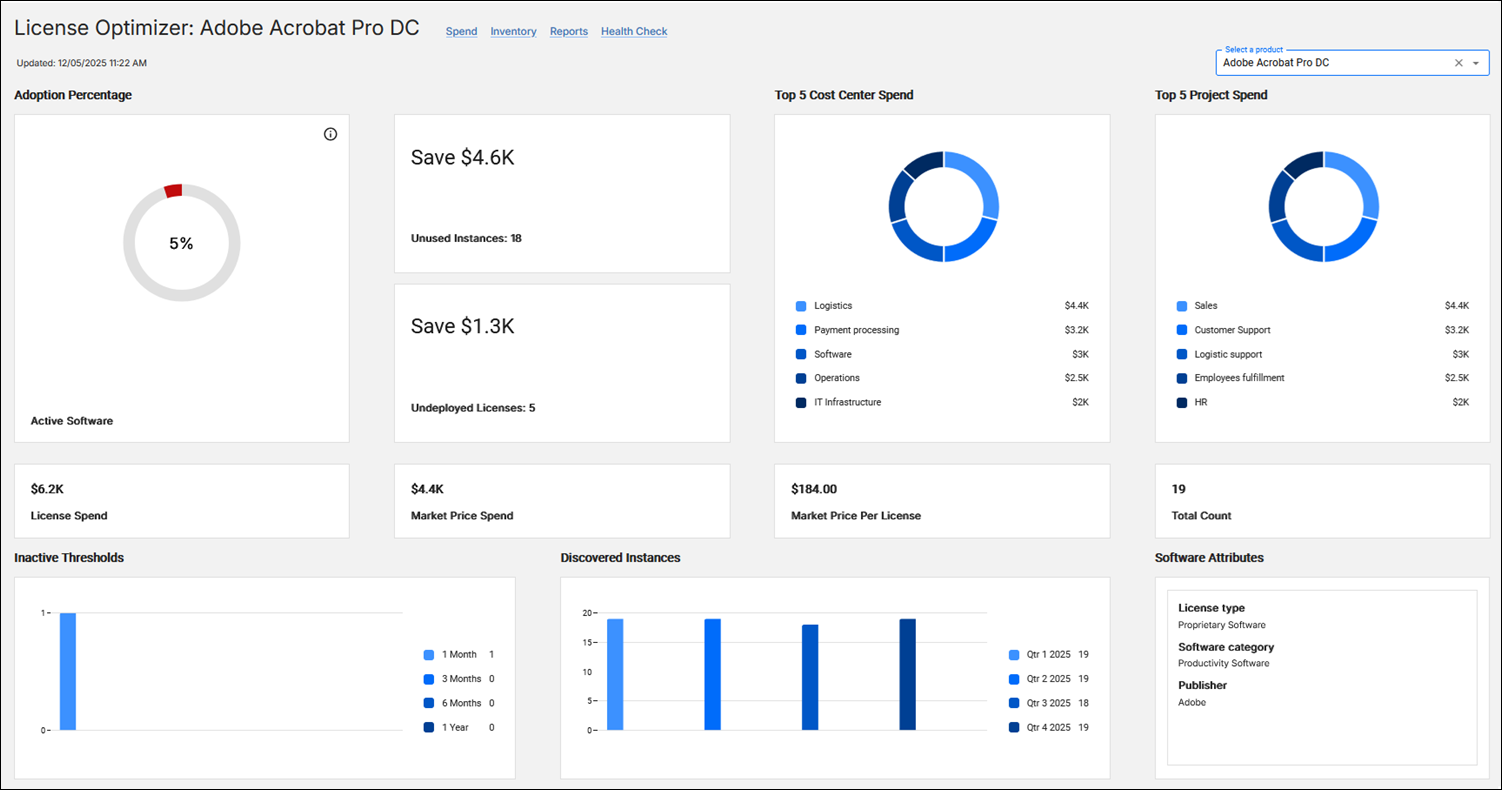
The License Optimizer dashboard in BigFix Inventory delivers AI-powered pricing insights and essential tools to optimize licenses and reduce costs for a set of desktop applications. It enables you to track and analyze statistics of unused software and undeployed licenses to manage budget allocation effectively. The dashboard displays key financial metrics, such as comparison of contract spend to market price, potential savings, cost breakdowns, helping organizations make informed decisions about software allocation and license purchases.
Required permission:  (View Contracts or Edit Contracts) and View Endpoints
(View Contracts or Edit Contracts) and View EndpointsNote: The
data that is displayed is calculated based on the computer group assigned to the
current BigFix Inventory user, active expenses and metric quantities in contracts
and install seats count (number of unique computers) for the selected
product.
License Optimizer widgets
- Adoption Percentage
- The Adoption Percentage widget shows the percentage of install seats which have instances last used within last 30 days. The widget has one of the following colors: red - for low adoption (<50%), yellow - medium adoption (5-80%), and green - high adoption (>80%).
- Save xxx / Unused Instances
- Save xxx / Unused Instances widget shows the estimated savings from unused instances, based on unit cost from license contracts and the number of licenses which are deployed but not used in the last 30 days.‘ELA license’ is displayed in case there is an ELA license contract. If there are no unused instances, ‘No potential savings’ is shown.Unused Instances is the number of install seats minus the number of seats with the product last used in the last 30 days. Clicking on the widgets redirects to Software Classification with filter by not suppressed and current instances, by the selected product and with Last Used empty or more than 30 days ago.
- Save xxx / Undeployed Licenses
- The Save xxx / Undeployed Licenses widget shows the estimated savings from undeployed instances, based on unit cost from license contracts and the number of licenses which are purchased but not deployed (discovered).If there is an ELA license contract then ‘ELA license’ is displayed. In case there are no undeployed instances ‘No potential savings’ is shown. Undeployed Instances is the number of purchased licenses (metric quantity) in license contracts minus install seats count.
- Top 5 Cost Center Spend
- Top 5 Cost Center Spend widget shows the top five spends broken down as per the cost centers set in the active purchases. Clicking on each breakdown redirects to the Purchases in Contracts report for active purchases in contracts with the selected product. All contract types are taken into account.
- Top 5 Project Spend
- Top 5 Project Spend widget shows the top five spends broken down as per the project set in the active purchases. Clicking on each breakdown redirects to the Purchases in Contracts report for active purchases in contracts with the selected product. All contract types are taken into account.
- License Spend
- License Spend widget shows the sum of active purchases in contacts of type’ License’. In case there is at least one underlicensed contract of type ‘License’ then an additional warning is displayed. Clicking on the widgets redirects to All Contracts report with a filter by the contract type and by the selected product.
- Market Price per License
- Market Price per License widget shows the Estimation of the spend in dollars for singular license of respective product assuming market price for mid-size company discounts and baseline software tiers. The values are powered by AI and are calculated assuming a purchase of 5000 licenses, per year with annual subscription (or perpetual license if annual is unavailable) and including a standard product edition.
- Market Price Spend
- Market Price Spend widget shows the AI-powered insight estimating total license spend in dollars for respective product assuming market price for mid-size company and baseline software tiers. Calculated for non ELA License Contracts when license quantity is greater than 0. When license quantity is 0 it is based on installations count. In case of an ELA license contract, ‘ELA license’ is displayed.
- Total Count
- Total Count widget shows the number of install seats with the product. Clicking on the widget redirects to the Software Summaries report with a filter by present, not suppressed instances and by the selected product.
- Inactive Thresholds
- Inactive Thresholds widget shows the number of install seats with the product last used before a time period, for four periods: 1 month, 3 months, 6 months, 1 year. Clicking on a given time period redirects to the Software Summaries report with a filter by present, not suppressed instances, having last used before this period and by the selected product.
- Discovered Instances
- Discovered Instances widget shows the number of install seats that were present at the end of past three quarters and which are discovered now as the current quarter. Clicking on a past quarter redirects to the Software Summaries report with a filter by not suppressed instances, having Discovery Start and Discovery End matching the quarter’s end timestamp, and by the selected product. Clicking on the current quarter redirects to the Software Summaries report with a filter by present, not suppressed instances and by the selected product.
- Software Attributes
- Software Attributes widget shows information about the product’s license type, software category and publisher. Software category information is retrieved from the software components of the currently bundled software instances, if it is available. Otherwise, it is retrieved from the software catalog relations.