AppScan 360° Setup Assistant
Overview
Data Collection & Privacy
-
The setup assistance tool collects operational and diagnostic data to validate environment readiness and troubleshoot deployment issues. This includes system configuration, tool versions, Kubernetes cluster status, network checks, and registry interactions.
-
Certain data points such as database host/user, network rules, cluster identifiers, and registry endpoints are considered sensitive as they may expose internal infrastructure details.
-
While credentials (e.g., passwords) are not logged, users should review and handle generated logs (e.g.,
prerequisite_check.log) securely and restrict access appropriately.
How to Download and Run Setup Assistant
-
Download: Access the utility from theHCL GitHub Repository.
- Note: Because this repository uses Git LFS, please follow the specific download instructions in this guide: Downloading Large Files from Setup_Assistant Repository Using Git LFS .
- Placement: Once downloaded, place the setup assistant on the system where you intend to install AppScan 360°.
-
Permissions: Ensure the script is executable by running:
chmod +x runcheck.sh -
Execution: Start the utility with:
./runcheck.sh
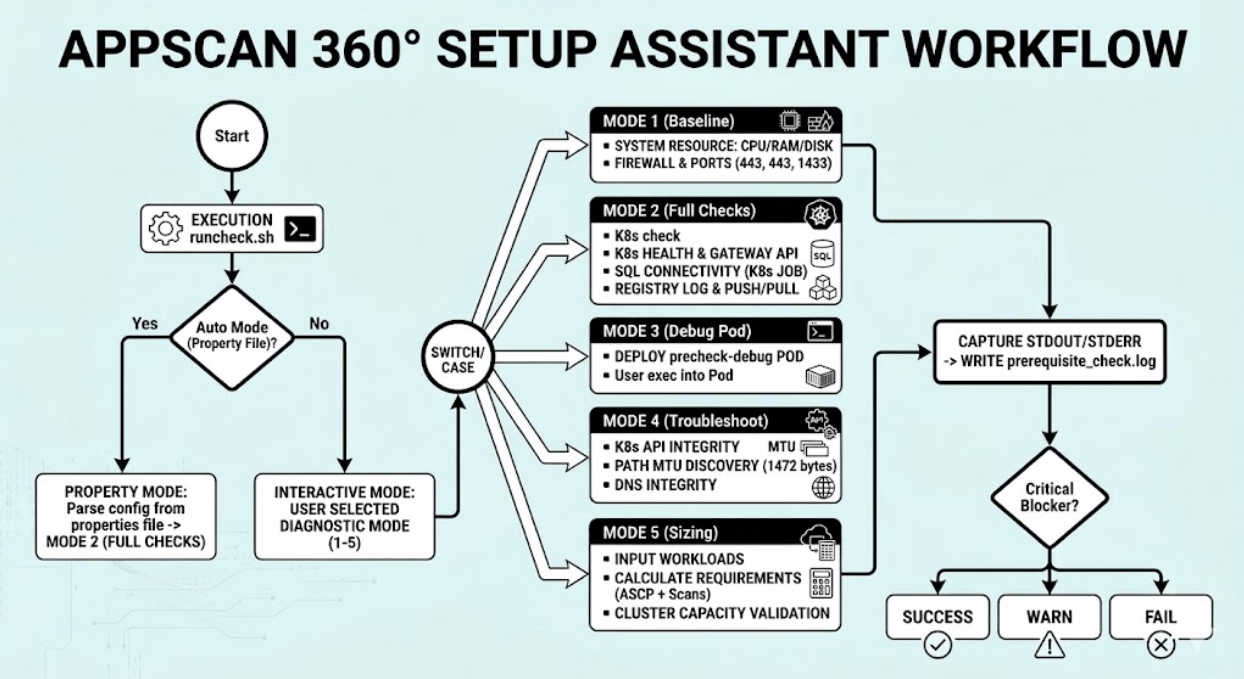
Operational Modes
- Interactive Mode: Upon execution, the utility prompts you with 5 specific diagnostic options. Select the mode that corresponds to the level of validation required.
- Property-Driven Mode (Automated): To run checks against specific
environment variables without manual prompts, place a
singular-singular.clusterKit.propertiesfile in the same folder as the utility. The Assistant will automatically extract configuration data and validate the environment accordingly,
Mode Explanations
Mode 1. System Resource Validation (Baseline checks)
This module evaluates the host machine's physical and OS-level capacity.
-
CPU Information: Collects core counts, architecture, and threads per core to ensure processing power meets minimum requirements.
-
Memory (RAM): Calculates total available memory and current utilization percentage.
-
Disk Space: Monitors the root (/) partition to ensure sufficient storage is available for logs and binaries.
-
Security Controls: Detects active SELinux or AppArmor configurations that may require specific policy adjustments for containerized workloads.
-
Local Firewalls: Audits
iptables,firewalld, andUFWto ensure no local rules are blocking required application ports. -
DNS Resolution: Identifies internal and external name servers to confirm that the environment can resolve service hostnames.
Mode 2: Network, Connectivity & K8s Health (Full Checks)
Kubernetes Cluster Health
Before deploying application components, the tool validates the target cluster's state.
-
API Reachability: Confirms the kubectl client can communicate effectively with the cluster control plane.
-
Cert-Manager: Verifies the presence and status of
cert-managerpods, which are essential for automated SSL/TLS certificate management.Storage Infrastructure: Checks for the existence of the specified StorageClass or Persistent Volumes (PV) required for data persistence.
-
Gateway API: Validates the presence of a GatewayClass, ensuring the cluster is ready for traffic management.
External Integration Tests
The validator performs "real-world" connectivity tests to external dependencies.
-
Container Registry: Performs a full lifecycle test—logging in, loading, pushing, and pulling a test image—to ensure the cluster can retrieve application images.
-
SQL Database Connectivity: Spawns a temporary Kubernetes job to attempt a live connection to the SQL Server. This confirms that network policies and database credentials (IP, User ID, and Password) are correctly configured.
Mode 3: Debug Pod Utility
The Debug Pod is an interactive tool used when pre-checks pass but runtime issues persist. It allows administrators to "step inside" the cluster environment.
Functional Workflow
-
Namespace Targeting: You can specify a custom namespace or fall back to
default. -
Deployment: Launches a pod named
precheck-debugthat remains active for 3600 seconds (1 hour). -
Interactive Access: Once the pod is "Ready," the tool provides a direct
kubectl execcommand to open a bash shell inside the cluster.
Mode 4: Kubernetes Troubleshooter
This module performs deep-dive connectivity and API integrity checks to diagnose communication issues between the host and the cluster.
API Reachability Checks
-
Binary & Context: Verifies
kubectlis installed and a valid cluster context is active. -
Healthz & Services: Tests the
/healthzraw endpoint and the internalkubernetesservice to ensure the control plane is responding. -
Resource Access: Confirms the ability to list pods across all namespaces.
Advanced Network (MTU) Validation
-
Interface Detection: Automatically identifies the default network interface.
-
MTU Detection: Verifies if the Maximum Transmission Unit (MTU) is set to 1500 or higher to prevent packet fragmentation.
-
Path MTU Discovery: Sends a 1472-byte packet with the "Do Not Fragment" bit set to test the end-to-end network path.
Mode 5: Configuration Sizing Check
The Sizing module ensures that your Kubernetes cluster has sufficient hardware resources (CPU and Memory) to support the specific workload based on your installation type and scanning concurrency needs.
Installation Types
-
AIO (All-In-One): Validates requirements against a single, dedicated node.
-
FF (Full Fledged): Sums the capacity of all nodes in the cluster to validate against total cluster resources.
Resource Calculation Logic
The tool calculates a Baseline (ASCP) and adds requirements for each concurrent scan type:
-
ASCP Baseline: Reserved 10 vCores and 25 GB RAM.
-
Scan Requirements:
-
SAST/SCA: Requires 16GB Min (28GB Rec) and 2 vCores Min (4 Rec) per concurrent scan.
-
DAST: Requires 3GB Min (4GB Rec) and 2 vCores Min (3 Rec) per concurrent scan.
-
Results Interpretation
-
PASS: Cluster meets the Recommended resource thresholds.
-
WARN: Cluster meets the Minimum requirement but falls below recommended levels.
-
FAIL: Cluster does not meet the Minimum requirements to run the requested number of concurrent scans.
prerequisite_check.log for deep-dive analysis