Execution of a DAG
To execute a Dag,
- Go to Reports à Netbot Troubleshooting à Execute DAG.
- Search for the DAG to be executed and click on Execute button for the node to be
executed.
Figure 1. Execution of a DAG 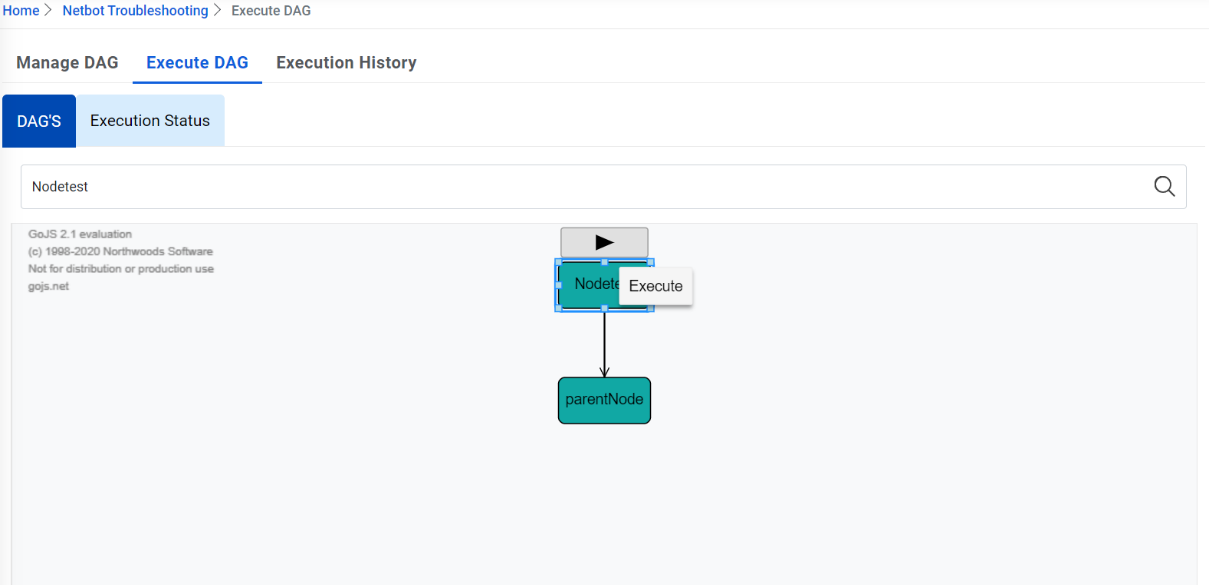
- If the parameters were mentioned during the node creation, then it will ask the parameter
value on execute button click. Provide those parameter values. There are two ways to pass
the parameters:
- Either pass the value of those parameters manually
- Define the parameters in the CSV and upload it.
- The benefit of this is that multiple values can be passed for a parameter. For that,
download the template and define the value of parameters as below:
Figure 2. Parameters Passed Manually 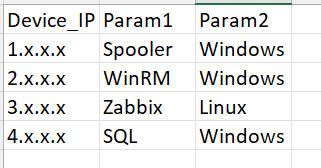
Figure 3. Parameters Passed Manually(Cont.) 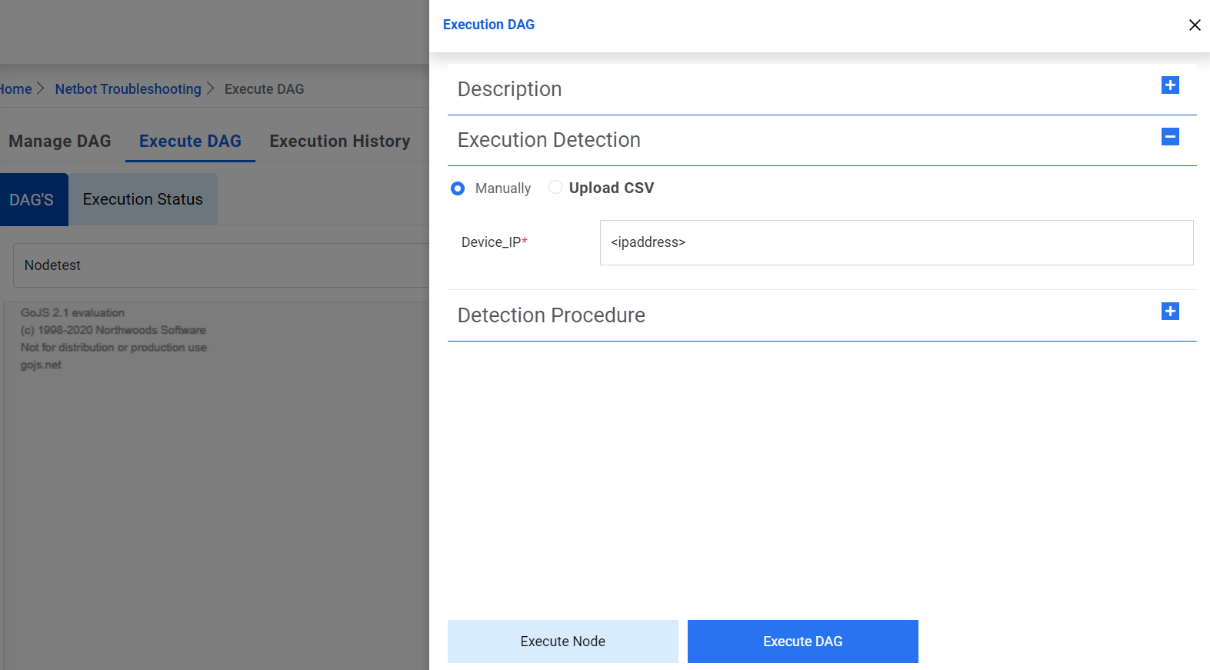
Figure 4. Parameters Passed Using Upload CSV Option 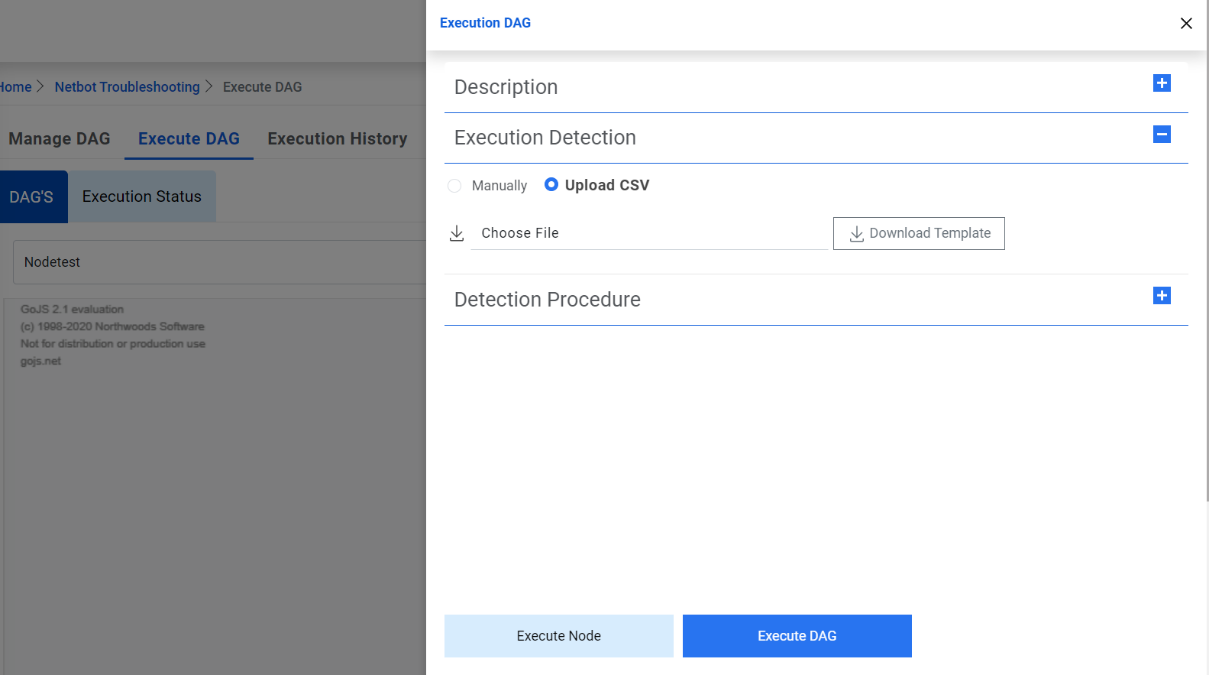
- Now if you want to only execute the selected Node then, click on ‘Execute Node’. But if you want to execute the selected node and all its child nodes then click on ‘Execute DAG’.
- The moment execution is initiated, the user will be prompted “Execution Initiated” and is
redirected to the Execution Status tab.
Figure 5. Execution of a DAG (Cont.) 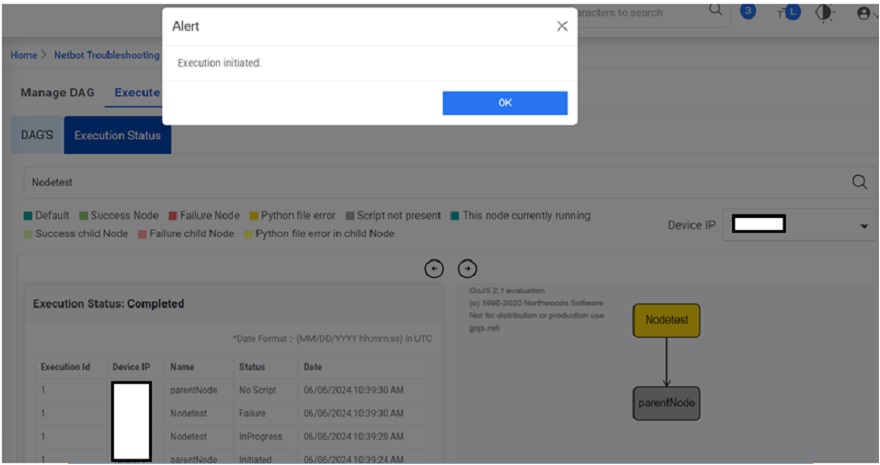
- Entered Device IP should populate in the Device IP dropdown list and Dag/Node (diagram)
should appear in right panel and related execution status should appear in left panel.Note:If multiple parameters were passed using upload CSV option, all the Device_IPs should appear in Device IP dropdown list with very first device IP in uploaded csv will appear in the Device IP dropdown list. User can select the different Device IP from Device IP dropdown list and see the status.
- Over the period, there should be additional status log and node color should turn as per
final execution of Node as screenshot below.Note:There is color code defined to represent different status that appears on after execution:
- If node contains script, then actual color (green/red/yellow) will be displayed.
- If the node contains information and doesn't have any child, then it will be grey.
- If node contains information and has child, then color will be light version of child node (red/green/yellow) having script.
Figure 6. DAG/Node Execution Status 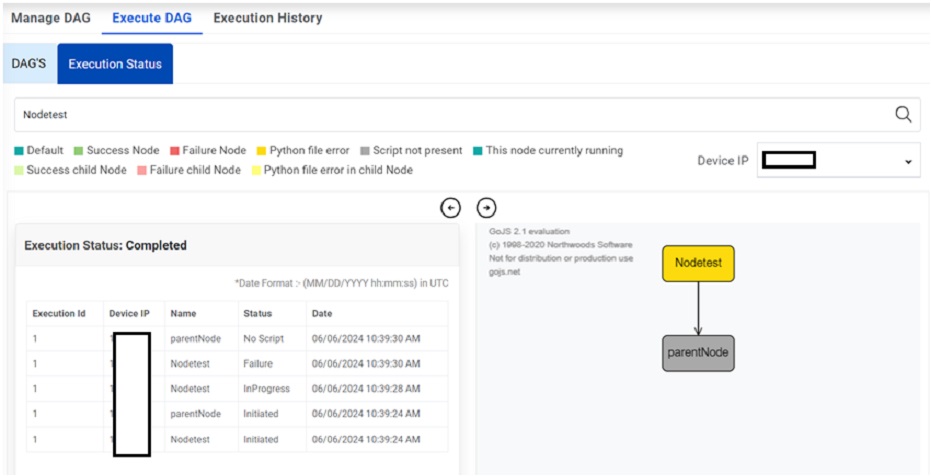 Note:To see the most recent execution status of any executed Dag/Node, users can navigate to Execute Status tab and search the Dag/Node in the search filter and can see the result for all the devices executed in most recent execution.