Viewing Analysis Report
To view the analysis report, click View Report. The user is available with different set of widgets named:
- Summary View – Provides a high-level summary of the analysis.
- Ticket Types (Unique Clusters) – Distinct number of ticket categories identified based on the nature of tickets from the overall ticket dataset uploaded.
- Runbooks Available – Ticket categories for which the runbooks are available based on system driven recommendations.
- KB Available – Number of Knowledge Articles, sourced from various web-based datasets, available for reference by end users.
- Scripts Available – Number of scripts available for use, to create automations which is not available in the out-of-the box runbook repository.
- Nothing Available – Number of ticket categories for which no KB articles / scripts are available.
-
Invalid Ticket Description – Number of ticket categories which has not enough
information for system to understand for processing.
Figure 1. SaaS based Ticket Analysis – Summary View 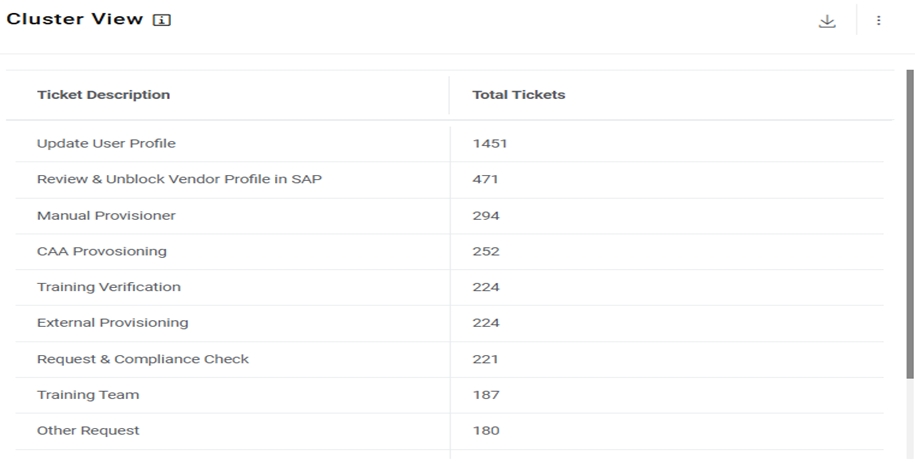
-
Top 10 Ticket Types (Unique Clusters)– Provides a view of the top 10 unique ticket
categories sorted by count and is indicative of the most voluminous issues in the
environment.
Figure 2. SaaS based Ticket Analysis – Chart view of Top 10 Ticket Types (Unique Clusters)
Figure 3. SaaS based Ticket Analysis – Tabular View of Top 10 Ticket Types (Unique Clusters)
-
Top 10 Ticket Types (No Automation Possible) – Provides a view of the top 10 unique
ticket categories sorted by count for which automations are not available within iAutomate.
Figure 4. SaaS based Ticket Analysis – Top 10 Ticket Types (Unique Clusters) with No Automation Possible (Chart View) Figure 5. SaaS based Ticket Analysis – Top 10 Ticket Types With no Ticket Available (Sorted by Ticket Count) 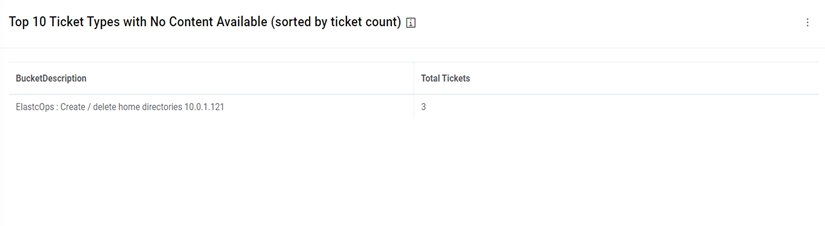
Figure 6. SaaS based Ticket Analysis – Top 10 Ticket Types (Unique Clusters) with No Automation Possible (Tabular View) .jpg)
-
Top 10 Ticket Types (Automation Possible) – Provides a view of the top 10 unique
ticket categories sorted by count for which automations are available within iAutomate. It
also presents a view of available runbooks, scripts and documents / knowledge articles.
Figure 7. SaaS based Ticket Analysis – Top 10 Ticket Types (Unique Clusters) with Possible Automation 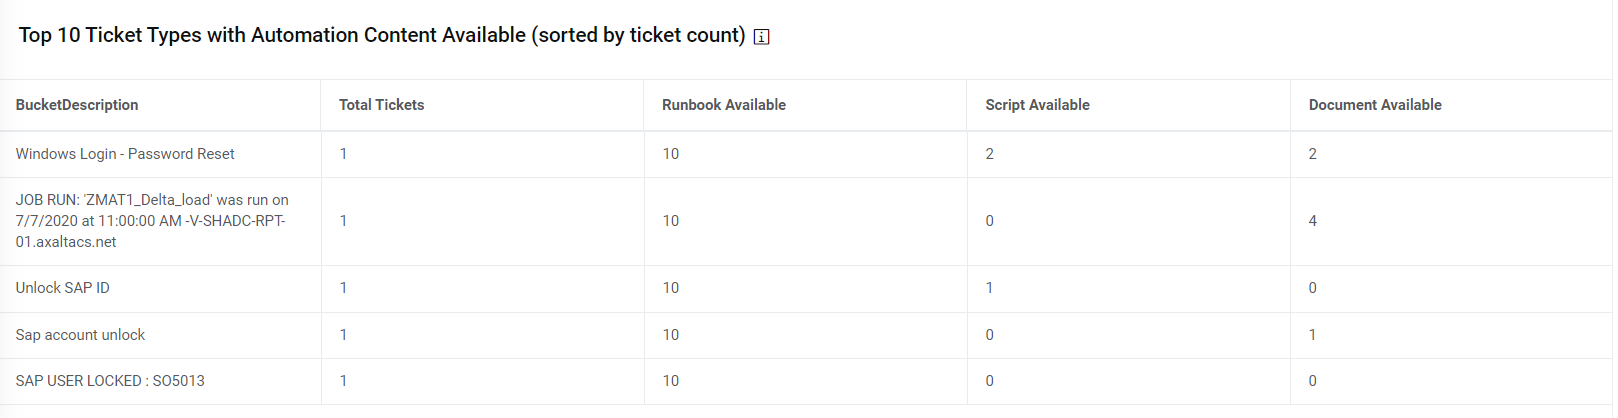
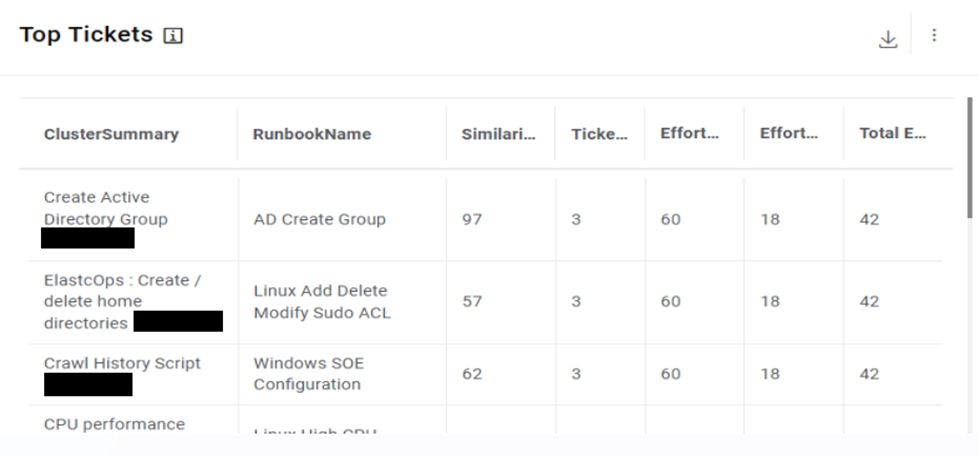
- Tiles View Dashboard - This widget highlights the top unique tickets which are automatable in nature (considering similarity score > 60), the recommended runbook and the potential effort savings which can be achieved through their automated remediation.
Users can also download the analysis report with the detailed ticket analysis which can be used to arrive at the automation percentage.
- Click Download PDF to download the pdf report.
- Click Invalid Ticket Details to download the CSV file which has no valid
description for processing.
Figure 9. SAAS Based Ticket Analysis - Download Report 
Important:
In the CSV file, all the ticket variations with
similarity score greater than 0.6 can be considered as potential automation candidates.