
The checklist detail page
The checklist detail page opens when you click a checklist name on the landing page. It displays a breadcrumb, three KPI cards, and the compliance charts, all scoped to that checklist and to the global filter that was active when you opened it.
The breadcrumb reads Security Compliance > <Checklist Name>.
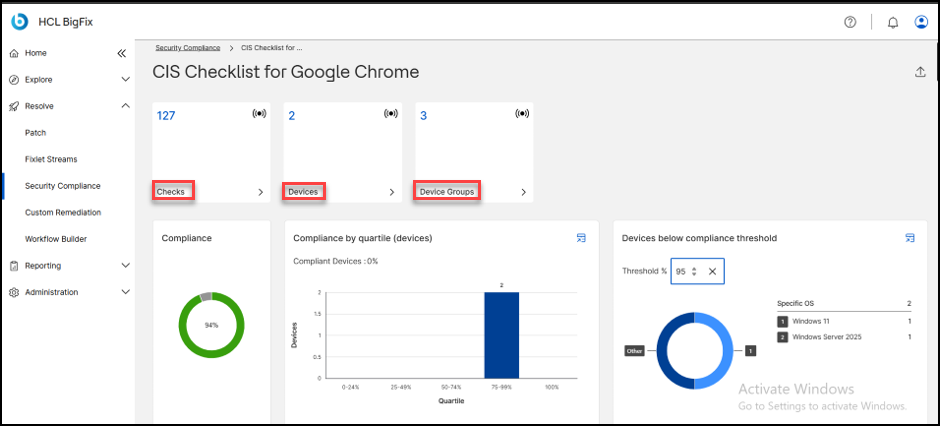
KPI cards
Three cards show the number of Checks, Devices, and Device Groups for this Checklist. Click a card to open the corresponding listing page (Fixlet Explorer, Devices, or Device Groups) scoped to the Checklist.
Compliance charts
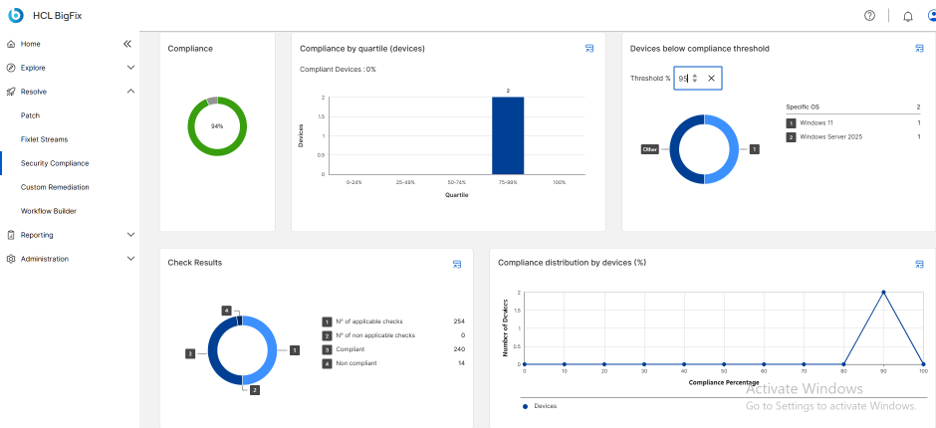
| Chart | What it shows |
|---|---|
| Compliance | Donut chart showing the overall compliance percentage for the checklist. |
| Compliance by quartile (devices) | Bar chart of device counts in each compliance band: 0–24%, 25–49%, 50–74%, 75–99%, and 100%. The header shows the percentage of fully compliant devices. |
| Devices below compliance threshold | Donut chart of devices grouped by operating system. Enter a value in Threshold
% to show only devices whose compliance is below that value. The
default threshold is 80%. The chart resets to its default when you clear the field
or reload the page.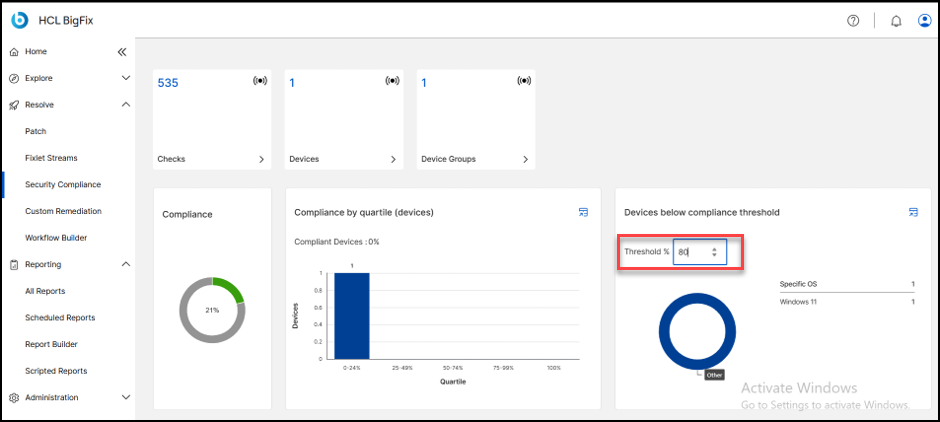 |
| Check Results | Donut chart showing the number of applicable checks, non-applicable checks, compliant results, and non-compliant results. Segments with a zero value are not drawn. |
| Compliance distribution by devices (%) | Line chart with compliance percentage on the X axis and number of devices on the Y axis. |
Checks grid
Below the charts, the checklist detail page also includes the checks grid, listing every Check in the Checklist with its current compliance data. See The checks grid for its columns and controls.