Dashboard
The dashboard provides a complete view of the system in your environment and helps spot trends in real-time. Each Dashboard User Interface (UI) element can instantly provide additional data insights, including a platform to create reports using the preconfigured widgets available on the dashboard.
To manage the dashboard, perform the following steps:
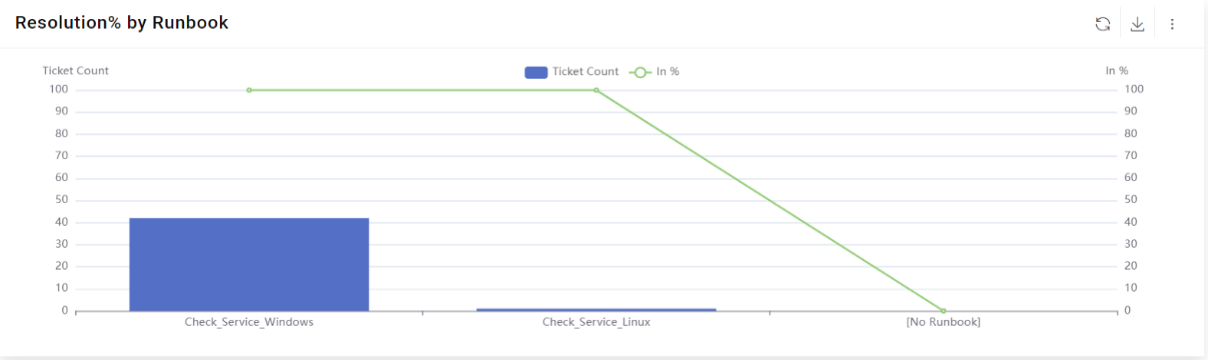
- On the main menu bar, click Dashboard. The Dashboard screen appears.
Figure 1. Dashboard 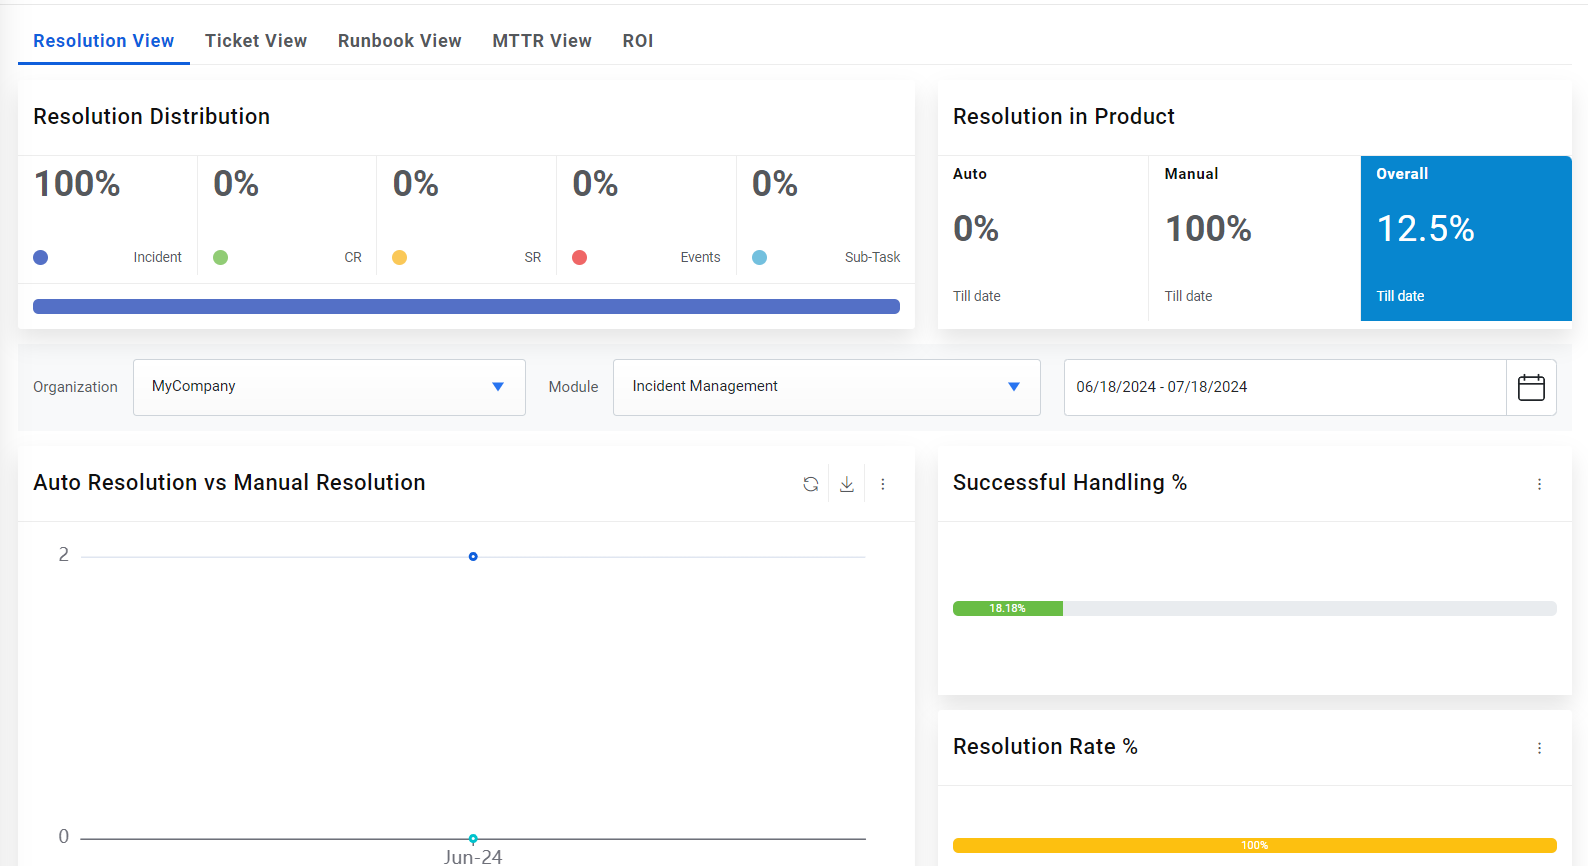
- Dashboard filters allow users to narrow the range of one or more reports on the active Dashboard tab. This filter lets you select a specific time frame, such as last month, this month, last quarter, or a range of dates.
- To configure a specific report, select the Organization from the drop-down list,
select the Module then select the time frame from the Calendar, and then
select the date range in the From Date and To Date fields.
Figure 2. Period 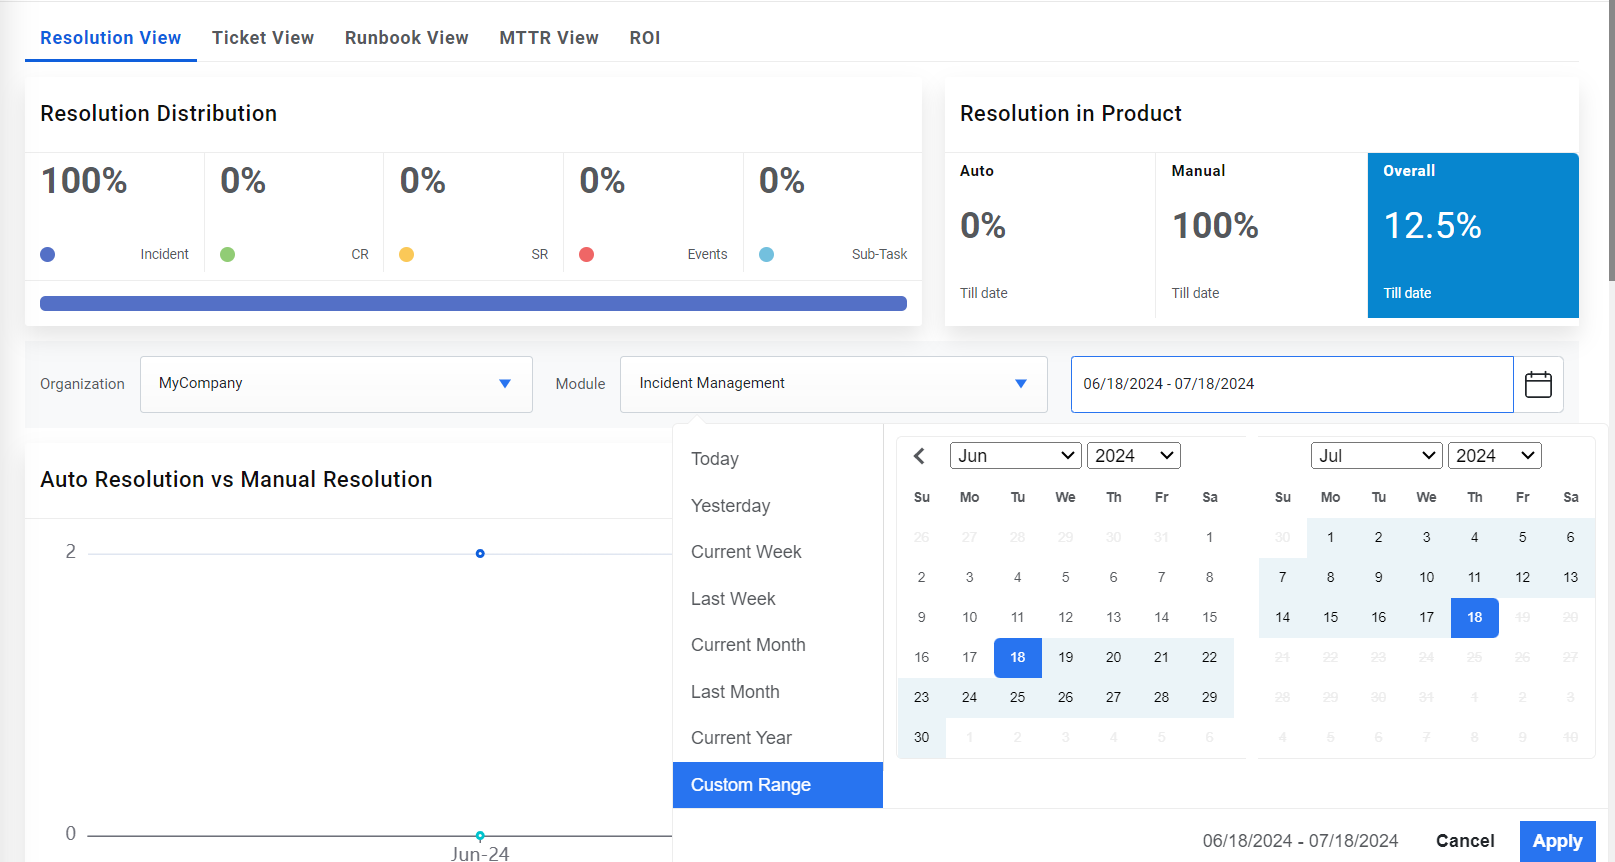
- Click Apply.
- These selections will recompile the data that appears in any report that is associated
with the date filter. All data beyond the selected range is excluded.
Figure 3. Widget 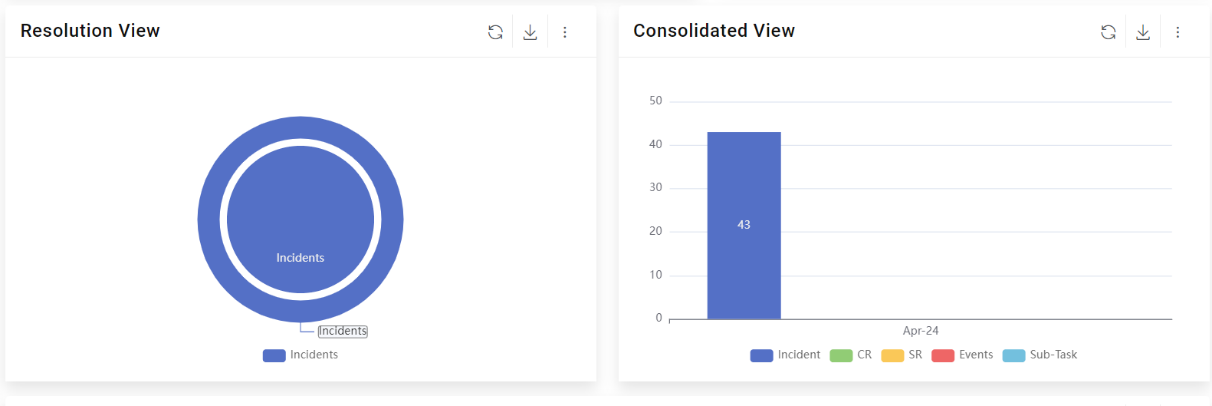
- You can use predefined widgets under the Dashboard Filters tab to add new widgets and
modify or remove existing widgets from the organization.
Figure 4. Dashboard Filter