Report Builder
The Report Builder is a wizard-based feature that you use to create visual reports from the data available in your BigFix environment. You can start from a pre-built template or build a report from scratch with full manual control.
To open the Report Builder, expand Reporting in the side navigation, and then select Report Builder.
Before you begin
Access to this application is controlled by the role that your administrator assigns to you. If your role does not grant the application, it does not appear in the side navigation, and the actions described in this topic are unavailable or dimmed.
- Your role must grant access to the Reports application, and your access level (Admin, Users, or Read only) determines what you can do here. See Managing Roles.
- The data sets and visualization options that are available depend on your permissions and on the data sources configured for the UI. For a description of each permission, see Permissions reference.
Ways to create a report
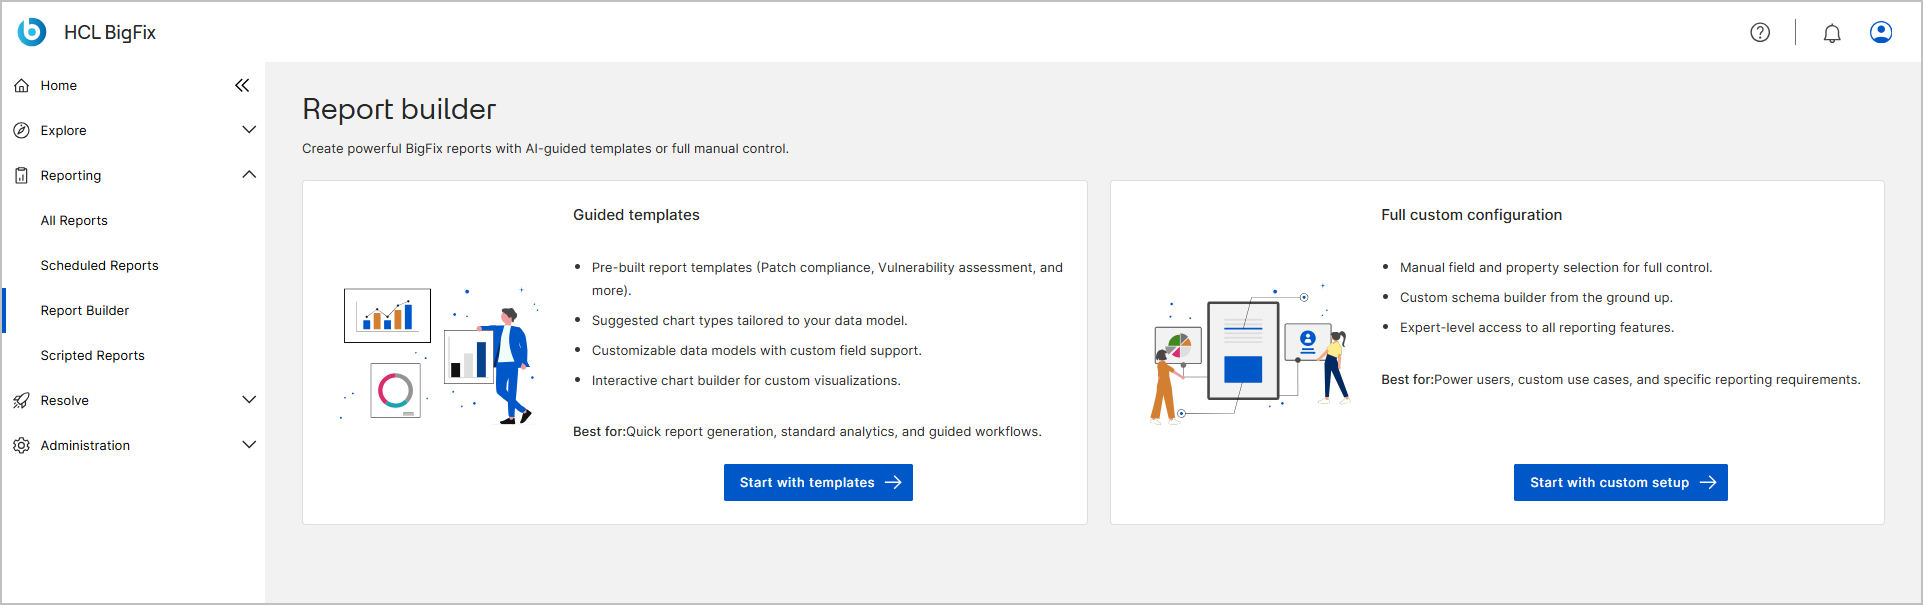
The Report builder page presents two cards. Each card starts a different report creation method:
- Guided templates – Start from a pre-built report template, customize its data model, and choose a variation. Select Start with templates.
- Full custom configuration – Select the data set, properties, and chart widgets yourself. Select Start with custom setup.
Guided templates
A guided template is a pre-built report definition that you customize instead of building a report from scratch. Each template supplies a data model, suggested fields, and a set of variations that narrow the report to a specific focus. The Guided templates card offers:
- Pre-built report templates, such as patch compliance and vulnerability assessment.
- Suggested chart types that suit the data model.
- Customizable data models with custom field support.
- An interactive chart builder for custom visualizations.
This method is best for quick report generation, standard analytics, and guided workflows.
When you select Start with templates, the Report templates page lists the templates that are available to you. After you select a template, the wizard creates the report in three steps: Customize, Variations, and Preview.
For a description of the templates page and the wizard steps, see Guided templates. For the procedure, see Create a report from a template.
Full custom configuration
Full custom configuration gives you manual control over every part of the report. The Full custom configuration card offers:
- Manual field and property selection for full control.
- A custom schema builder from the ground up.
- Expert-level access to all reporting features.
This method is best for power users, custom use cases, and specific reporting requirements.
When you select Start with custom setup, the Report Builder creates a report in a three-step process:
- Data Sets – Choose the source data set and the properties that you want to include in your report.
- Create Charts – Design one or more visualization widgets based on the selected properties.
- Preview Report – Enter a name and description, review the final layout, and generate the report.
For the procedure, see Create a report with custom configuration.
Data sets
Each data set corresponds to a data category within BigFix. The data set that you select in the Data Sets step determines which columns, filters, and data types are available in your report:
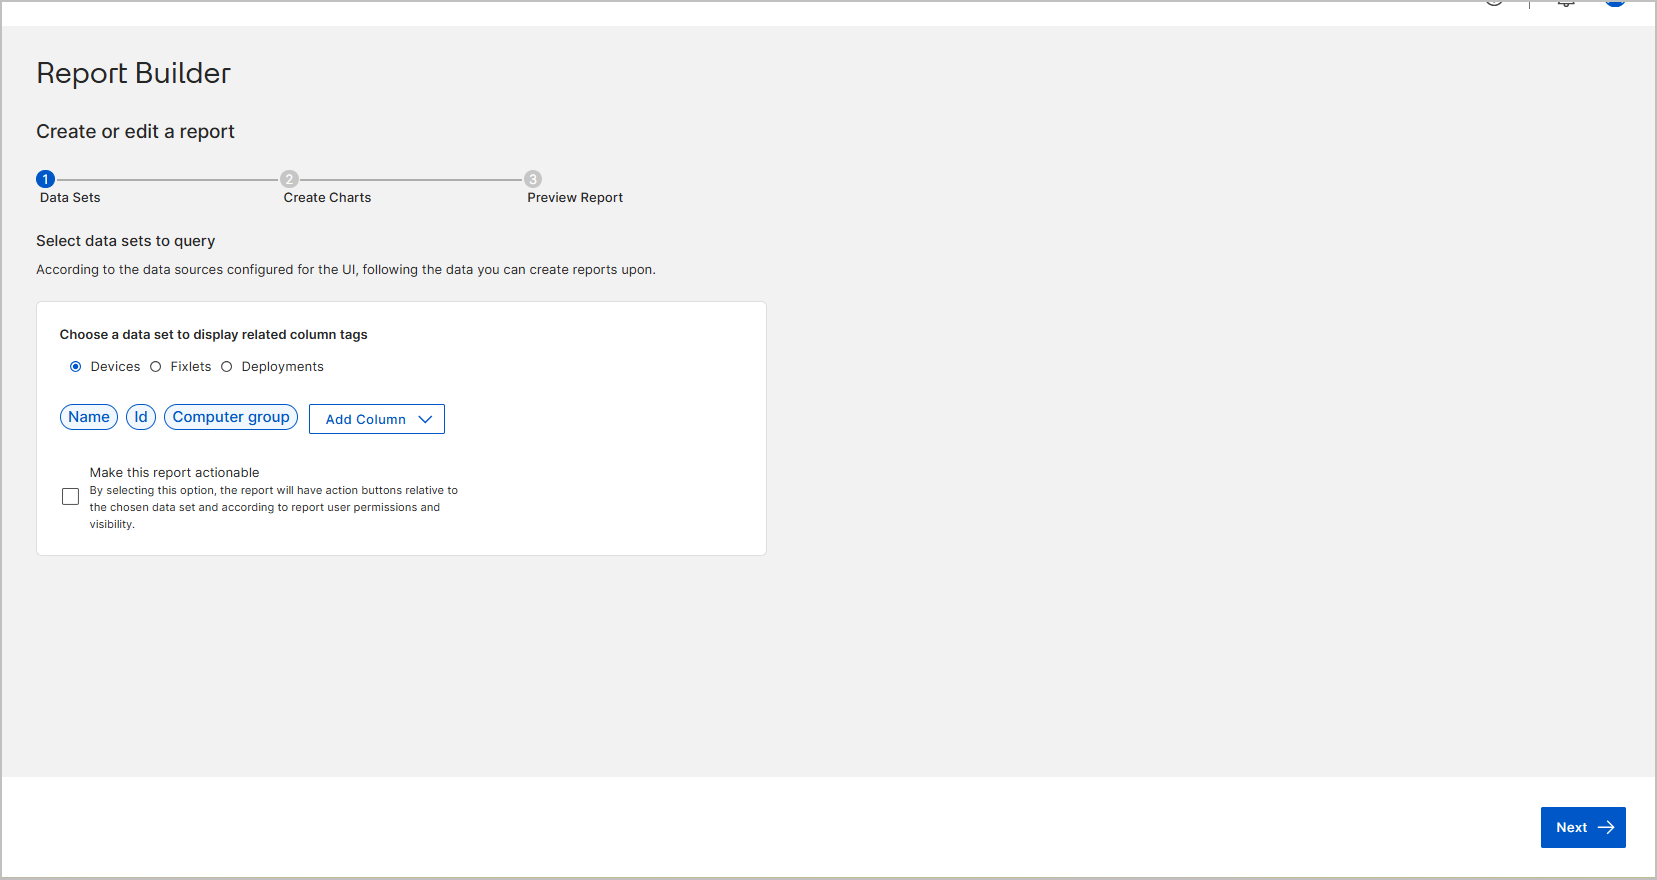
- Devices – Data related to managed endpoints, such as hostname, IP addresses, and operating system.
- Fixlets – Information about Fixlets, tasks, and baselines.
- Deployments – Details about deployment operations, targets, and results.
The Name, Id, and Computer group columns are included by default and cannot be removed.
For the complete list of properties that you can add as report columns for each data set, see Report Builder settings reference.
Chart widgets
The Create Charts step provides four widget categories, or five when the selected columns include DEX properties:
- Distribution over time – Displays how a DEX property changes over a selected time range, as a vertical bar or line chart. This widget category is available only when the selected columns include DEX properties, such as Dex Score or Dex Device Score. Set the reporting period with Time range. On the Preview Report step, you can also categorize the metric with Group By and change the aggregation interval with the View by list. See Working with Distribution over time charts.
- Percentage of a whole – Displays proportional data as a donut, gauge, or pie chart.
- Quick link – Displays a KPI as a link to a filtered view of the data. The link label is the count of the elements that match the filter criteria that you define.
- Composition – Displays how values compose a whole as a horizontal bar, pie, treemap, or vertical bar chart.
- Category breakdown – Shows how the values of a second property are distributed within each value of a first property, as a grouped or stacked bar chart with horizontal or vertical orientation. For example, Agent type broken down by Operating system.
For the visual formats and configuration settings of each widget category, see Report Builder settings reference.
Chart data table
Every chart provides a See data in data table format with download options icon in its upper-right corner, which opens the chart data as a table that you can copy or export. This control works the same way across BigFix UI. See Viewing chart data in a table.
For a Distribution over time chart, the table additionally provides the Aggregated data and Details by (Historical property) tabs. See Working with Distribution over time charts.
Report management
When you generate a report, it is automatically added to the All Reports page, where you can mark it as a favorite, set its visibility to Public or Private, reconfigure it, or delete it.
To open a report, select its name on the All Reports page. On the report details page, you can:
- Refresh the report data.
- Filter the report. See Global filter.
- Limit the report to selected device groups with View by group. This list is displayed only for reports that were created from a guided template.
- Export the report data. See Exporting Data.
- Duplicate the report. See Duplicate a report.
- Reconfigure the report. See Reconfigure a report.
Filtering and exporting behave the same way as they do elsewhere in BigFix UI. For more information, see Global filter and Exporting Data.