Create a report with custom configuration
Use the Report Builder wizard to select a data set, design chart widgets, and generate a custom report. Use this method when you want full manual control over the properties and charts in the report.
Before you begin
The data sets and visualization options that are available depend on your user permissions and the data sources configured for the UI.
About this task
The Report Builder guides you through three steps: Data Sets, Create Charts, and Preview Report.
Procedure
- Expand Reporting in the side navigation, and then select Report Builder.
-
On the Full custom configuration card, select
Start with custom setup.
The Data Sets step opens.
-
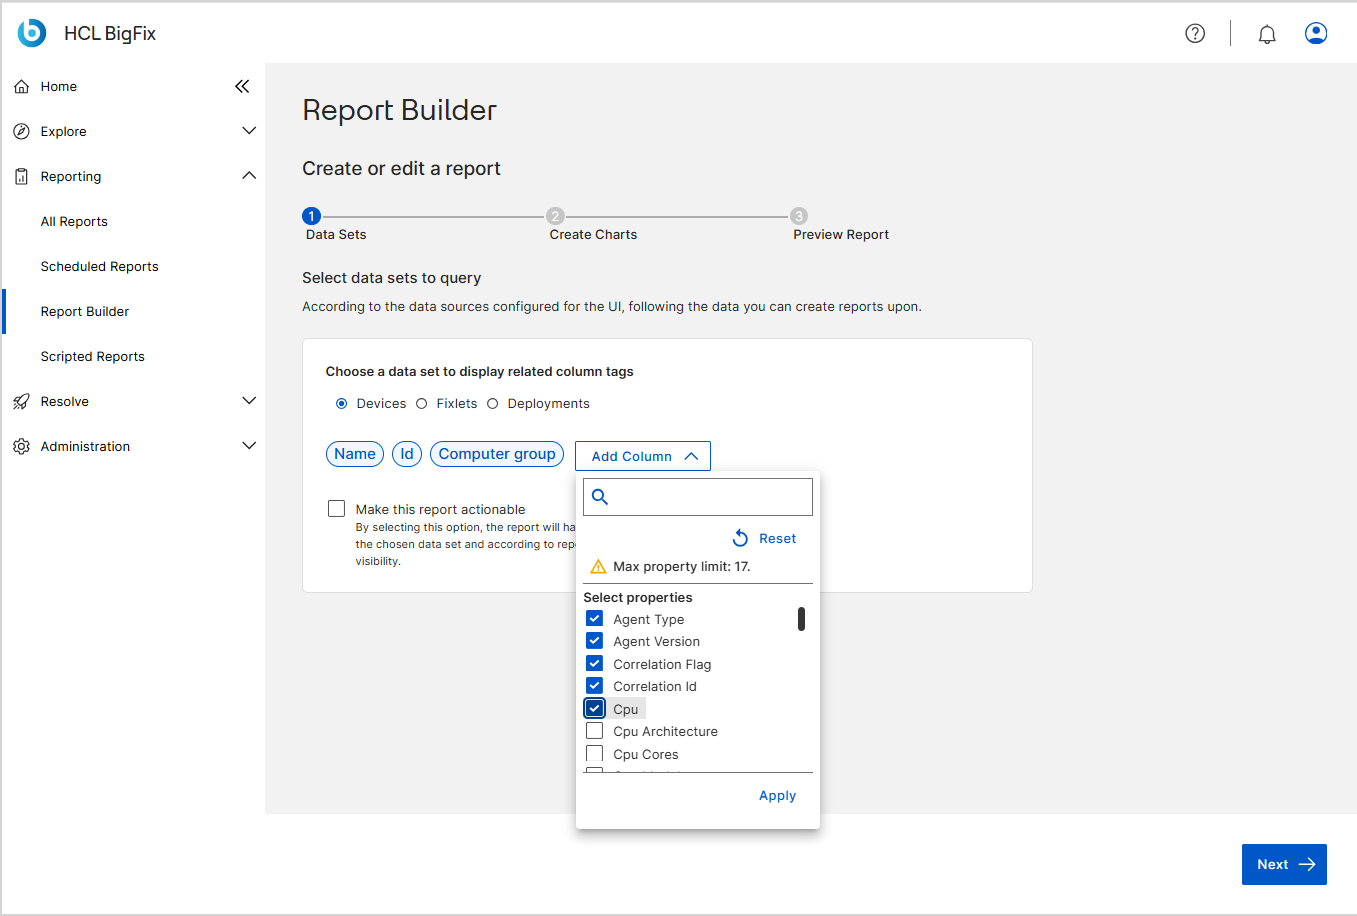
Under Choose a data set to display related column tags,
select one data set: Devices,
Fixlets, or
Deployments.
For the properties available in each data set, see Report Builder settings reference.
Note:The Name, Id, and Computer group columns are included by default and cannot be removed. -
Select Add Column to open the property selection
panel.
-
Optional: Select Make this report actionable to add
action buttons to the report.
The action buttons that are displayed depend on the chosen data set and on the permissions and visibility of the report user.
- Select Next to continue to the Create Charts step.
-
On the Create Charts page, select
Configure on the card of each widget type that you
want to add: Distribution over
time, Percentage of a whole,
Quick link, Composition, or
Category breakdown.
Each widget that you configure is added to the Charts details list. Newly added widgets appear at the top of the list.
Note:The page displays four widget cards. The Distribution over time card is displayed as a fifth card only when the columns that you selected in the Data Sets step include DEX properties, such as Dex Score or Dex Device Score.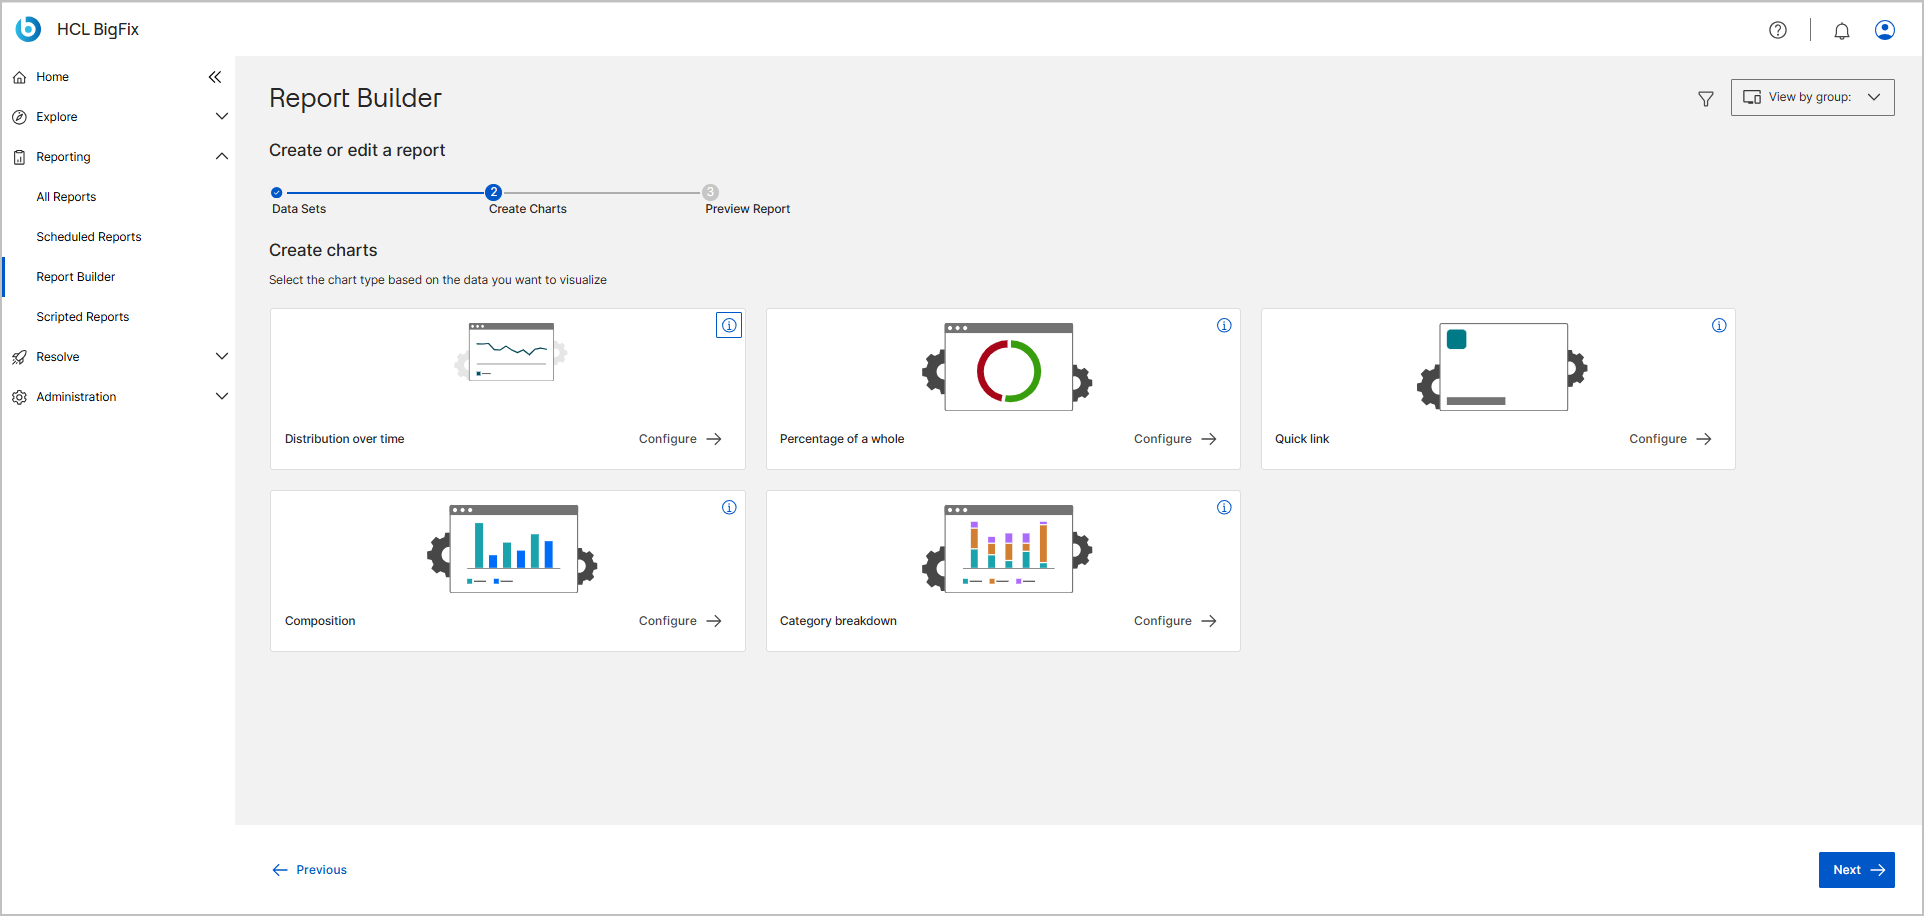
-
In each configuration panel under Charts details,
select the visual format next to Pick one type among these type
charts, and then complete the settings.
The settings differ by widget category. For the complete list of visual formats and settings, see Report Builder settings reference.
 Note:The property dropdown lists display only the columns that you selected in the Data Sets step.
- Optional: To delete a widget configuration, select Remove in the upper-right corner of its panel.
-
Optional: To refine the data displayed in the report, select the filter icon
in the upper-right corner of the page.
The Filter panel provides the Current filter, Saved filters, and Favourite filters tabs. For detailed steps, see Global filter.
-
Optional: To limit the report to specific device groups, select View
by group in the upper-right corner of the page, select the
check box of each group, and then select Apply.
In the Select Device group list, you can search for a group, select Select all, or select Reset to clear your selection.
Note:The View by group list is available on the Create Charts and Preview Report steps. On the report details page, it is displayed only for reports that were created from a guided template. -
Select Next to continue to the Preview
Report step.
Note:The Next button remains disabled until you provide all the required chart information. For example, the button remains disabled if two charts have the same name.
-
In the Configure Report Properties section, enter a
report Name and, optionally, a
Description that summarizes the report's
purpose.
Note:The Generate Report button stays dimmed until you enter a name.
-
Verify that the report content appears correctly.
The preview page displays the following sections:
- Quick link – Displays each configured quick link widget with the count of matching elements and its caption.
- Charts – Displays a visual preview of the configured charts, with the chart name in the upper-left corner and the See data in data table format with download options icon in the upper-right corner. In a bar chart, you can zoom in, zoom out, and select Reset Zoom. Where a chart has more values than it can display at one time, use the arrows below the chart to page through them.
- Content list – Displays a preview of the report columns and sample data rows. You can use the column headers to sort the data, and select More to load more rows.
Note:If the report includes a Distribution over time chart, the Content list is not displayed for any of the charts in the report.A Distribution over time chart provides additional controls in its header: a refresh icon, the Group By button, the View by list, and the Average Devices Score benchmark. See Working with Distribution over time charts.

-
Optional: To review the values behind a chart, select the See data
in data table format with download options icon in the
upper-right corner of the chart.
The chart data opens as a table that you can sort, copy, or export. For the steps, see Viewing chart data in a table.
Note:For a Distribution over time chart, the table also provides the Aggregated data and Details by (Historical property) tabs and its own View by list. See Working with Distribution over time charts. -
Select Generate Report.
A success message "Congratulations! You have successfully created a new report" appears in the upper-right corner of the UI. The page stays on the Preview Report step, and Generate Report is replaced by View Report.
-
Select View Report.
The report is added to the All Reports page, where you can:
- Mark the report as a favorite with the star icon
- Change its visibility between Public and Private with the edit icon in the Visibility column
- Assign tags, change the visibility of several reports at a time, or delete reports from the Select action list
- Select the report name to open the report details page, where you can reconfigure the report
