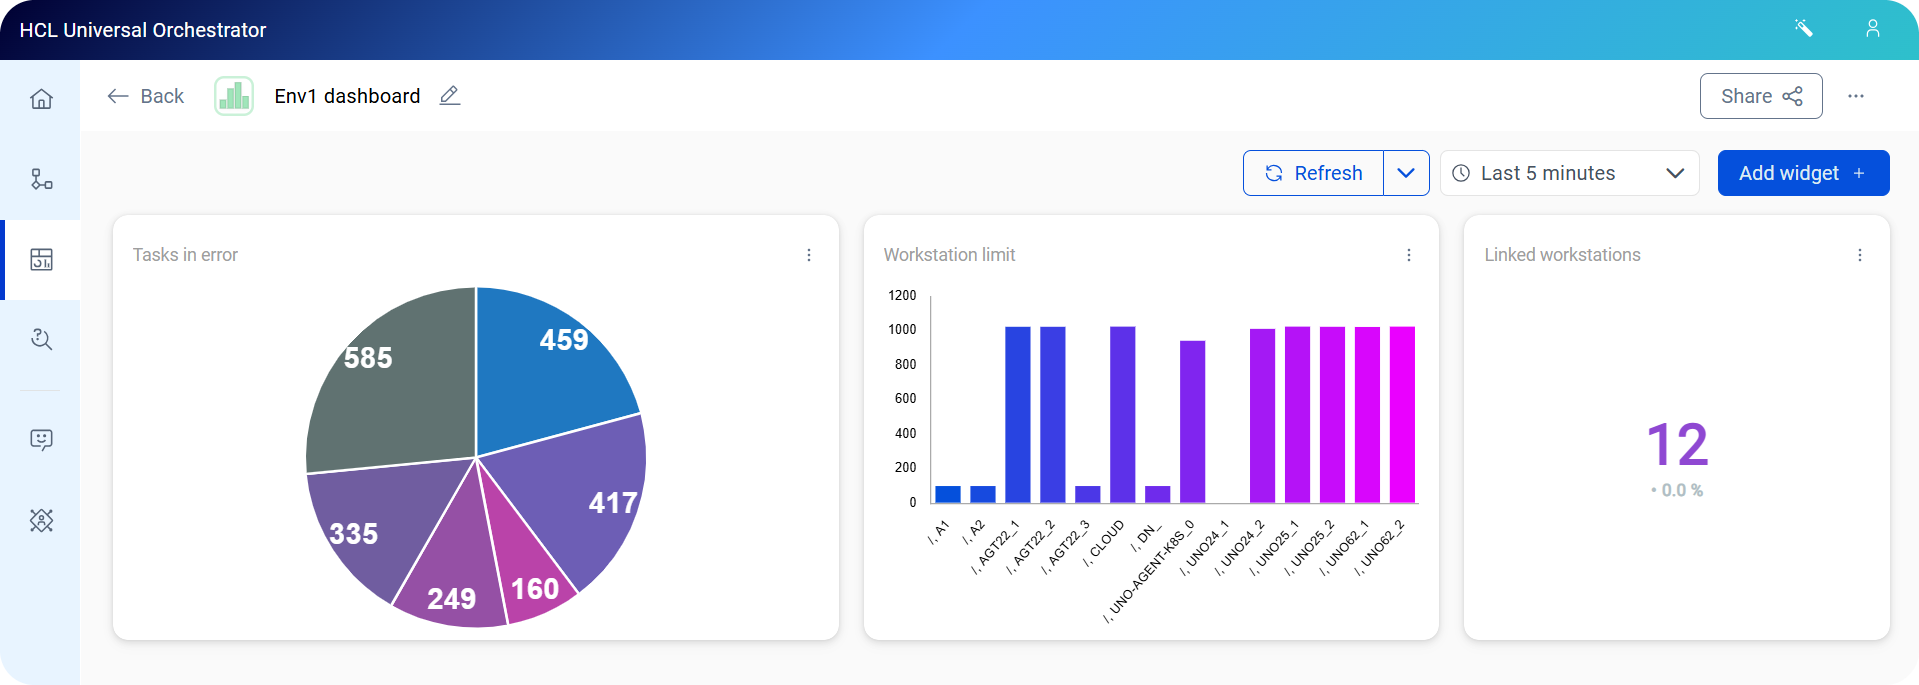
New and improved dashboards for greater control
With the new version of HCL Universal Orchestrator, you can use new widgets and intelligent querying capabilities on your dashboards.
With these updates you can get more comprehensive insights about your workload, with new AI governance metrics and AI-assisted OQL expression construction.
Expanded widget library: Three new widget
types are available to help you build tailored dashboards.
|
 |
| Comprehensive AI asset tracking: The new AI governance metrics and the related default dashboard provide detailed visibility into the consumption rates and operational efficiency of your AI assets. This capability enables precise monitoring and auditing of advanced resource usage over time. | |
|
Smarter widget management and visualization: Enhance widget
interaction with new features.
|
|
|
Advanced query building: Writing queries has never been
easier.
|
To customize your dashboard and gain more control on your environment, see: