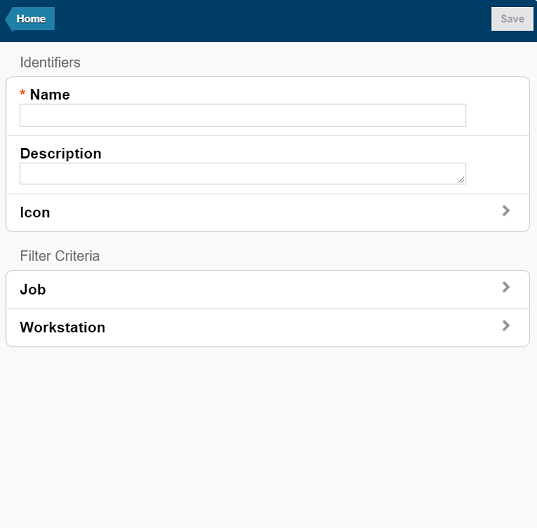
Create a dashboard to monitor jobs
Self-Service Dashboards are queries that you can create to display subsets of your jobs and workstations that you want to monitor.
Before you begin
- Self-Service Dashboards web address
where, host_name and port_number are the host name and port number of the Dynamic Workload Console to which you are connecting.https://host_name:port_number/dwc/mobile
- Required role
- Administrator, Mobile User
Note: If you define a dashboard to monitor
jobs, workstations, or both on z/OS engines, you cannot define filter
criteria. You can create a single dashboard that monitors all workstations
and all jobs for the specified engines.
About this task
Procedure
- Tap the Self-Service Dashboards section to launch the application.
- Tap Create to begin defining your dashboard.
- Specify a name, and optionally, specify a description to better identify it.
- Optionally, tap Icon and select an icon that you can associate to the dashboard from the
list of available icons.

- In Filter Criteria, tap Job to
specify filter criteria that determines the subsets of jobs in your
environment to be displayed in your dashboard.
- In Engine, select the engine connection associated to the jobs you want to monitor. You can select a single engine or all engines. The all engines option works for only distributed engines and not for z/OS engines.
- In Job, type Report* to specify a filter to include all jobs beginning with "Rep" to be included in your dashboard.
- In Workstation (Job), type Fin* to specify a filter to include all workstations where the job runs, beginning with "Fin" to be included in your dashboard.
- Click Add Filter to add an additional filter on the workstation name. In Workstation (Job), type Mktg* to specify a filter to include all workstations beginning with "Mktg" to be included in your dashboard.
- Click Back and save the dashboard.
- On the Self-Service Dashboards page, tap Roles and then the dashboard to open the list of roles that can be associated to this dashboard. Select only the roles that you want to authorize to see and use this dashboard. If the new dashboard is not associated to any role, by default it is only available to users with the Administrator role.