MCP Tool Health Monitoring
Overview
The MCP Server Health Monitoring feature provides a basic mechanism to monitor the availability of MCP servers after they are discovered and registered as tools in BigFix AEX. It periodically checks whether MCP endpoints remain operational and displays their current health status in Gateway Client UI.
Accessing the MCP Health Monitor
- After installing the Gateway Client build, launch the application, enter the product key and region, and click Verify.
- Open the Tools grid (the grid icon at the top right of the page) and
select MCP Health Monitor.
Figure 1. Gateway Client Tools Grid 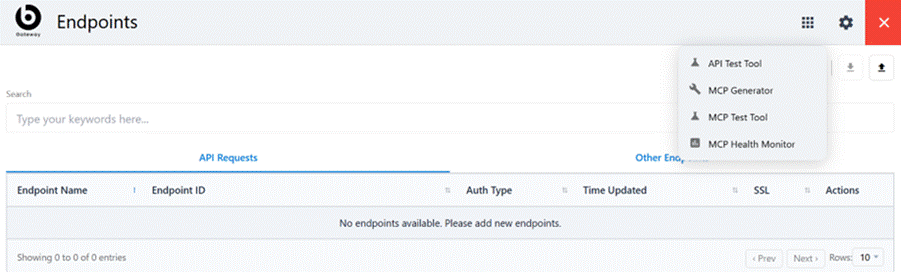
- The MCP Health Monitor dashboard opens showing summary counts and the
Endpoints Health Table.
Figure 2. MCP Health Monitor Dashboard 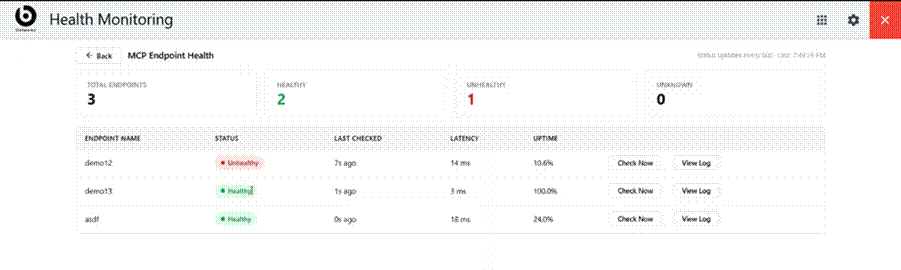
- The Health Monitoring menu item remains available while you navigate across Gateway Client pages.
Health Monitoring Dashboard
The dashboard gives an overview of the configured MCP endpoints and their current health status. An MCP server is marked as Healthy when the listTools() call completes successfully and returns a valid response.
The header at the top right shows the refresh interval and the time of the last update (for example, "Status updates every 60s").
| Metric | Description |
| Total Endpoints | Total number of configured MCP endpoints. |
| Healthy | Number of endpoints currently reporting a healthy status. |
| Unhealthy | Number of endpoints currently reporting an unhealthy status. |
| Unknown | Number of endpoints currently reporting an unknown status. |
The overview counts correspond to the health status of the endpoints shown in the health table. When no MCP endpoints are configured, all values are displayed as 0.
Endpoints Health Table
The Endpoints Health Table displays health information for each configured MCP endpoint.
| Column | Description |
| Endpoint Name | Name of the MCP endpoint. |
| Status | Current health status of the endpoint. |
| Last Checked | When the endpoint was last checked. |
| Latency | Endpoint response latency. |
| Uptime | Endpoint uptime information. |
| Actions | Provides the Check Now option to manually verify whether the endpoint is operational, and View Log to open the audit log. |
- Healthy: green badge.
- Unhealthy: red badge.
- Unknown: gray badge.
Figure 3. Endpoints Status 
The Last Checked value shows when the endpoint was most recently checked. Recent timestamps appear in a human-readable relative format, such as 2s ago.
Manually Checking Endpoint Health
- In the Endpoints Health Table, locate the required endpoint.
- Select Check Now.
- The following View Log buttons in the Actions column of each endpoint row
appears on the screen.
Figure 4. MCP Endpoint Health 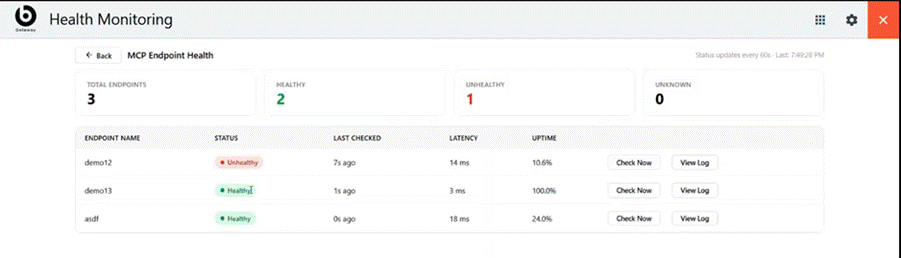
- Wait for the health check to complete.
- Review the updated Status and Last Checked information.Note:While a check is in progress, the Check Now button shows a loading state and blocks duplicate health-check requests. When the check completes, the status and last-check time are updated with the latest results.
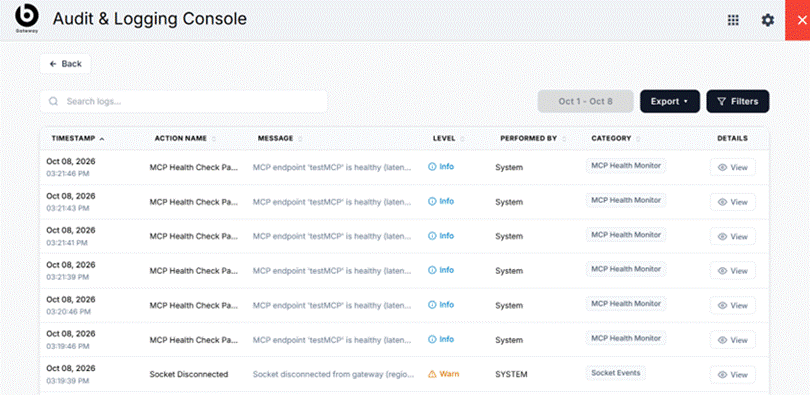
Viewing Logs