
Gateway Logging Console
Audit & Logging Console
Overview
The Gateway Client Audit and Logging Console gives Gateway administrators a central place to monitor and trace administrative activities, system events, and API interactions. Relevant events are captured automatically and are searchable, reviewable, and exportable, so you can quickly determine who performed an action, what was changed, and when it happened.
The console also supports automatic log cleanup, so stored audit data is managed without manual maintenance. Together, these capabilities improve operational transparency, simplify troubleshooting, and provide a complete audit trail for Gateway Client activity.
Access the Audit & Logging Console
- Log in to the Gateway application.
- Select the Settings (gear) icon in the upper-right corner.
- Select Audit Console.
- The Audit & Logging Console page is displayed.
Figure 1. Select Audit Console 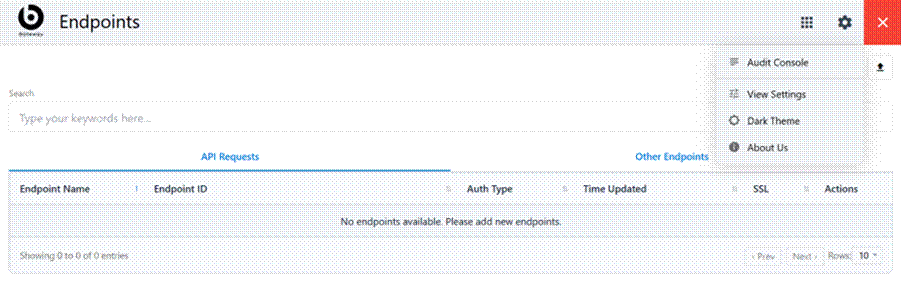
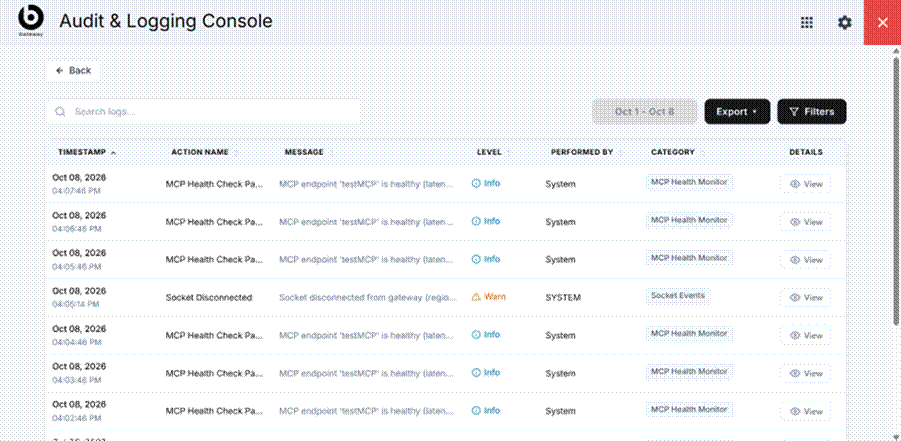
Understand the Log Table
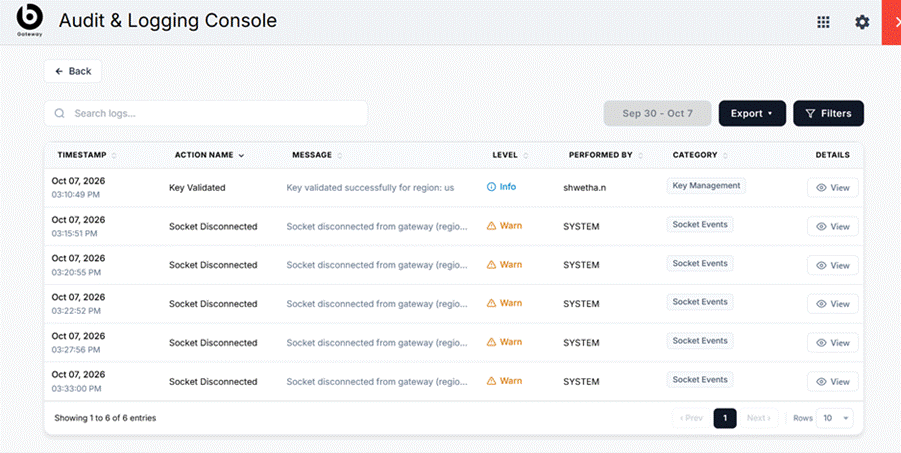
The log table displays the following columns (see Figure 2):
| Column | Description |
| TIMESTAMP | Date and time when the activity occurred. |
| ACTION NAME | Name of the action performed. |
| MESSAGE | Information associated with the logged activity. |
| LEVEL | Severity or type of the log message. |
| PERFORMED BY | User or system that performed the action. |
| CATEGORY | Category associated with the log. |
| DETAILS | Access to detailed information about the log entry. |
Search Audit Logs
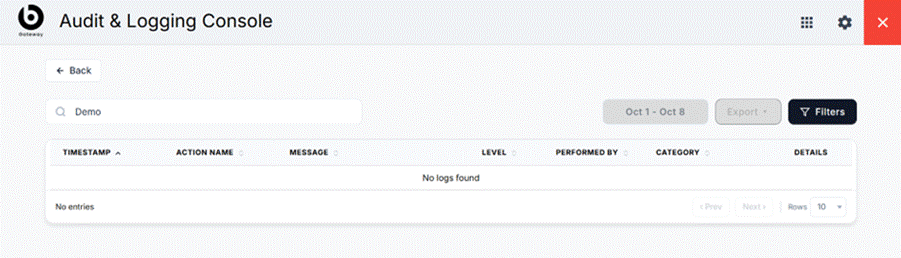
Use the search field to quickly locate logs based on the available log information.
-
Enter a search term in the Search logs... field.
-
The table is filtered based on the text you entered.
-
To clear the search, remove the entered text.
The search supports text containing spaces, alphanumeric characters, and special characters. If no records match, the console displays a No records found or No logs found message
Filter Audit Logs
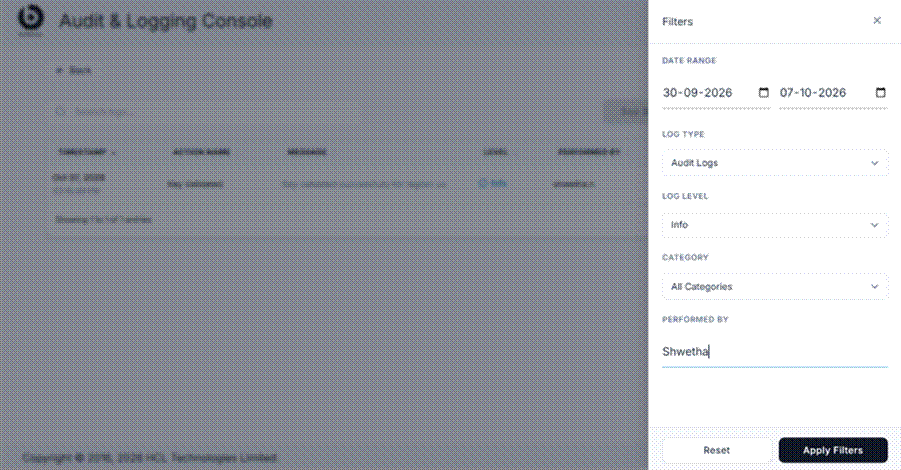
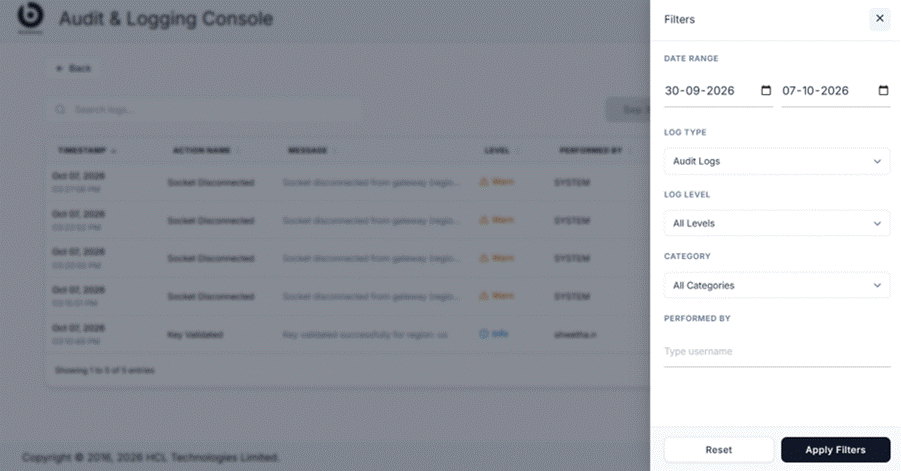
Use Filters to narrow the logs by specific criteria.
- Select Filters.
- The Filters drawer opens from the right side (Figure 4).
- Specify one or more filter criteria.
- Select Apply Filters. The console applies all selected criteria together and displays the matching records.
Date Range
Specify the period for which you want to view logs.
From — the start date.
To — the end date.
Dates use the DD-MM-YYYY format.
The maximum supported date range is 31 days.
Log Type
Select the type of logs you want to view.
| Log Type | Description |
| Audit Logs | Provide logs related to frontend activities |
| Application Logs | Provide logs related to backend activities. |
Log Level
Filter logs by severity or level.
| Log Level | Description |
| All Levels | Logs across all available log levels. |
| Info | Informational messages about system or application activities. |
| Warn | Warning messages that may require attention. |
| Error | Error messages indicating failures or problems. |
| Debug | Detailed information useful for troubleshooting and debugging. |
Select a category from the Category list. The default value is All Categories.
Enter a username in the Performed By field to show only logs performed by that user or system.
To remove applied filters, select Reset in the Filters drawer. The filter fields return to their default values and the table displays the unfiltered data.
Close the Filters Drawer
To close the drawer without applying changes, do one of the following:
- Select X in the upper-right corner of the drawer.
- Select the area outside the drawer.
Sort Audit Logs
You can sort the log table using the column headers (the active sort column shows an arrow
Sort by Timestamp
Select TIMESTAMP to sort logs chronologically. Select the column again to reverse the sorting order.
Sort by Action Name
Select ACTION NAME to sort the logs alphabetically by action name.
View Log Details
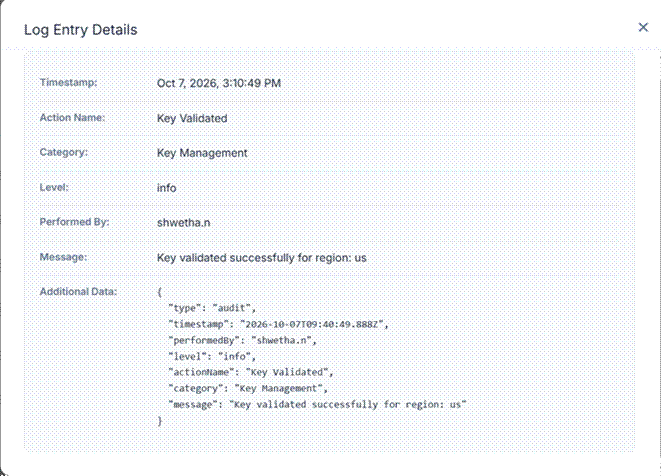
Use the View button in the DETAILS column to see complete information about a log entry.
- Locate the required log entry.
- Select View.
- The Log Entry Details modal opens
- Review the available log properties. Nested JSON metadata is displayed in a readable format under Additional Data.
To close the details modal:
- Select X, or
- Select the area outside the modal.
The LEVEL column identifies the type or severity of each entry. Each level is shown with its own icon and a distinct color to help you tell them apart at a glance (see the Info and Warn indicators in Figure 2).
| Log Level | How it appears in the UI |
| Info | Displayed with an informational icon. |
| Error | Displayed with an error icon. |
| Warn / Warning | Displayed with a warning icon. |
| Debug | Displayed with a debug icon. |
Export Audit Logs
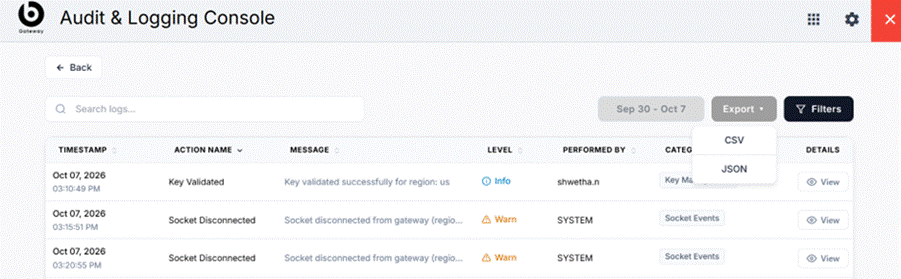
You can export audit log data in CSV or JSON format.
- Select Export. A format menu
- Select CSV or JSON.
- The file is generated and downloaded to your local machine.
The exported data should correspond to the records displayed for the applied search or filter criteria.
Export data in JSON format
{"exportDate":"2026-10-15T07:47:48.120Z","totalRecords":3946,
"filters":{"fromDate":"2026-10-08","toDate":"2026-10-15","category":"all","level":"all"},
"data":[{"timestamp":"2026-10-15T07:47:30.228Z","actionName":"Logs Exported",
"message":"Audit logs exported as CSV — 3945 record(s) (logType: audit)",y
"level":"info","performedBy":"xxxxxx","category":"Audit Operations",
"metadata":{"type":"audit","timestamp":"2026-10-15T07:47:30.228Z",
"performedBy":"xxxx","level":"info","actionName":"Logs Exported",
"category":"Audit Operations",
"message":"Audit logs exported as CSV — 3945 record(s) (logType: audit)"}},
{"timestamp":"2026-10-15T07:47:02.126Z","actionName":"MCP Health Check Passed",
"message":"MCP endpoint 'testMCP' is healthy (latency: 16ms)","level":"info",
"performedBy":"System",
"category":"MCP Health Monitor","metadata":{"type":"audit","timestamp":"2026-10-15T07:47:02.126Z",
"performedBy":"System","level":"info","actionName":"MCP Health Check Passed",
"category":"MCP Health Monitor","message":"MCP endpoint 'testMCP' is healthy (latency: 16ms)"}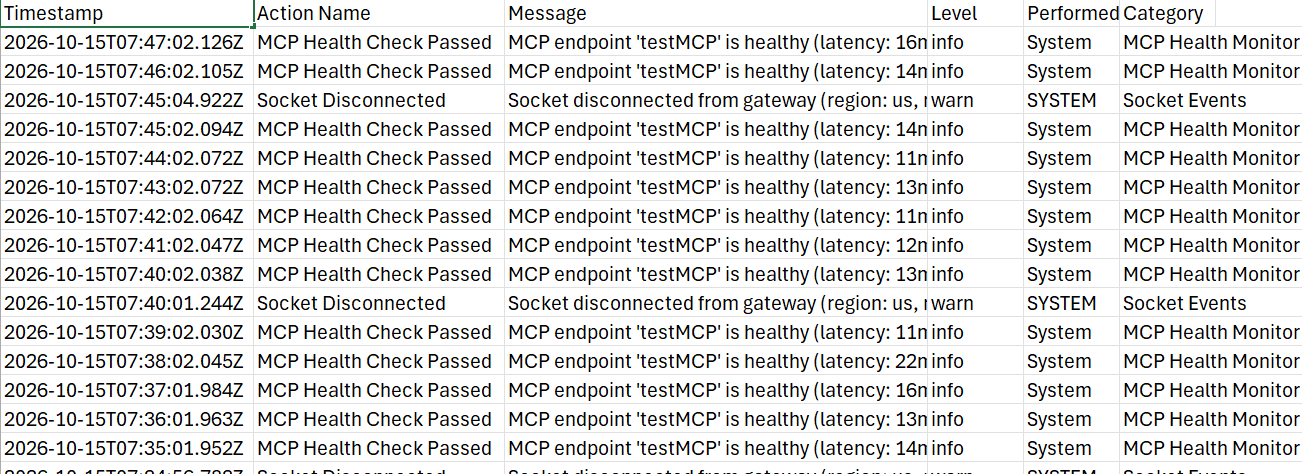
Important Notes
- The maximum selectable date range is 31 days.
- Applying a new search or filter resets pagination to page 1.
- Export supports CSV and JSON formats.
- You can view detailed metadata for individual log entries.
- Filter criteria can be combined to narrow search results.
Quick Reference
| I want to… | Do this |
| Open the console | Settings (gear) icon → Audit Console |
| Find a specific log | Type in Search logs... |
| Narrow by date, type, level, category, or user | Filters → set criteria → Apply Filters |
| Clear all filters | Filters → Reset |
| Re-order the table | Select TIMESTAMP or ACTION NAME header |
| See full log metadata | View in the DETAILS column |
| Download logs | Export → CSV or JSON |