Health Check
As a Master Operator, use the Health Check page in the MCM application to monitor the health of your MCM deployments.
Overview
The Health Check dashboard is a centralized monitoring tool within the MCM application that provides a visual representation of the operational status of your MDM Servers (Apple, Android, Windows) and MDM Plugin. It leverages BESUEM analyses to gather detailed operational state information, offering granular insights into potential issues.
How to access
- Login to the WebUI as a Master Operator.
- From the WebUI main page, select .
- On the Modern Client Management home page, click . The Health Check page is displayed as
follows.

Prerequisites for analysis
All relevant BESUEM/BESUEM Mobile analyses must be activated for the MCM app and the Health Check to work as expected. If they are deactivated, the correct health status won't be displayed.
Insights from the Health Check Dashboard
- Readiness check:
- Server Initialization: Basic server startup and configuration.
- Google Enterprise Registration: Status of enterprise registration with Google.
- WNS Connectivity: Windows Notification Service connectivity status.
- TLS Certificate Configuration: Verification of required certificates.
- BoltDB Database: Connection and initialization status.
- RabbitMQ Connectivity: Message queue connection status.
- Google API Connectivity: API connection status (including PubSub).
- LDAP Connectivity: If enabled.
- Default Profile Configuration: Verification of the default enterprise profile.
- Enrollment Endpoints: Whether they are working.
- Device Refresh Messages: Whether messages are being received from the plugin portal.
- Accurate MDM Server Status: The dashboard displays the actual operational state of your Apple, Android, and Windows MDM Servers.
- Enhanced Analyses: MDM Server analyses for Apple, Android, and Windows are enhanced to expose more granular opstate data.
- Specific Problem Detection: The dashboard identifies specific problems detected at runtime, including issues with MDM server connection, WNS certificates, TLS certificates, LDAP configurations, RabbitMQ connectivity, or Google API reachability.
- Clear Health Indicators: Components are displayed with color-coded
indicators:
- Green: Ready and operating normally.
- Yellow: Warning and less critical issues that may need attention.
- Red: Critical problem or action needed, requiring immediate
attention.
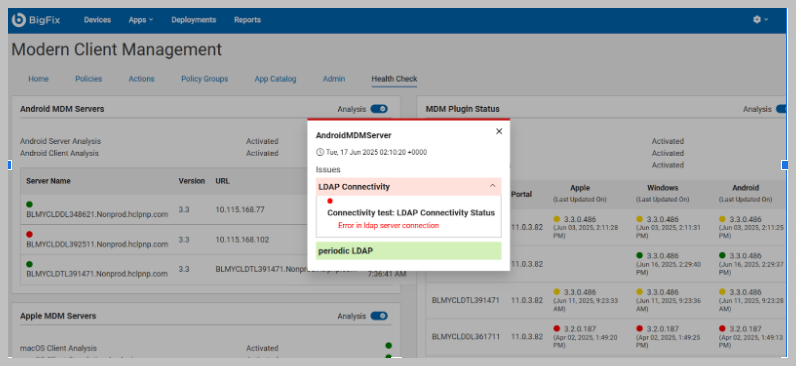
Example:

- Hierarchical Drill-down for Troubleshooting:
- When an indicator shows yellow or red, you can click on it to reveal
a detailed, hierarchical breakdown of the underlying issues. This
helps in quickly pinpointing the exact problem.
Example:
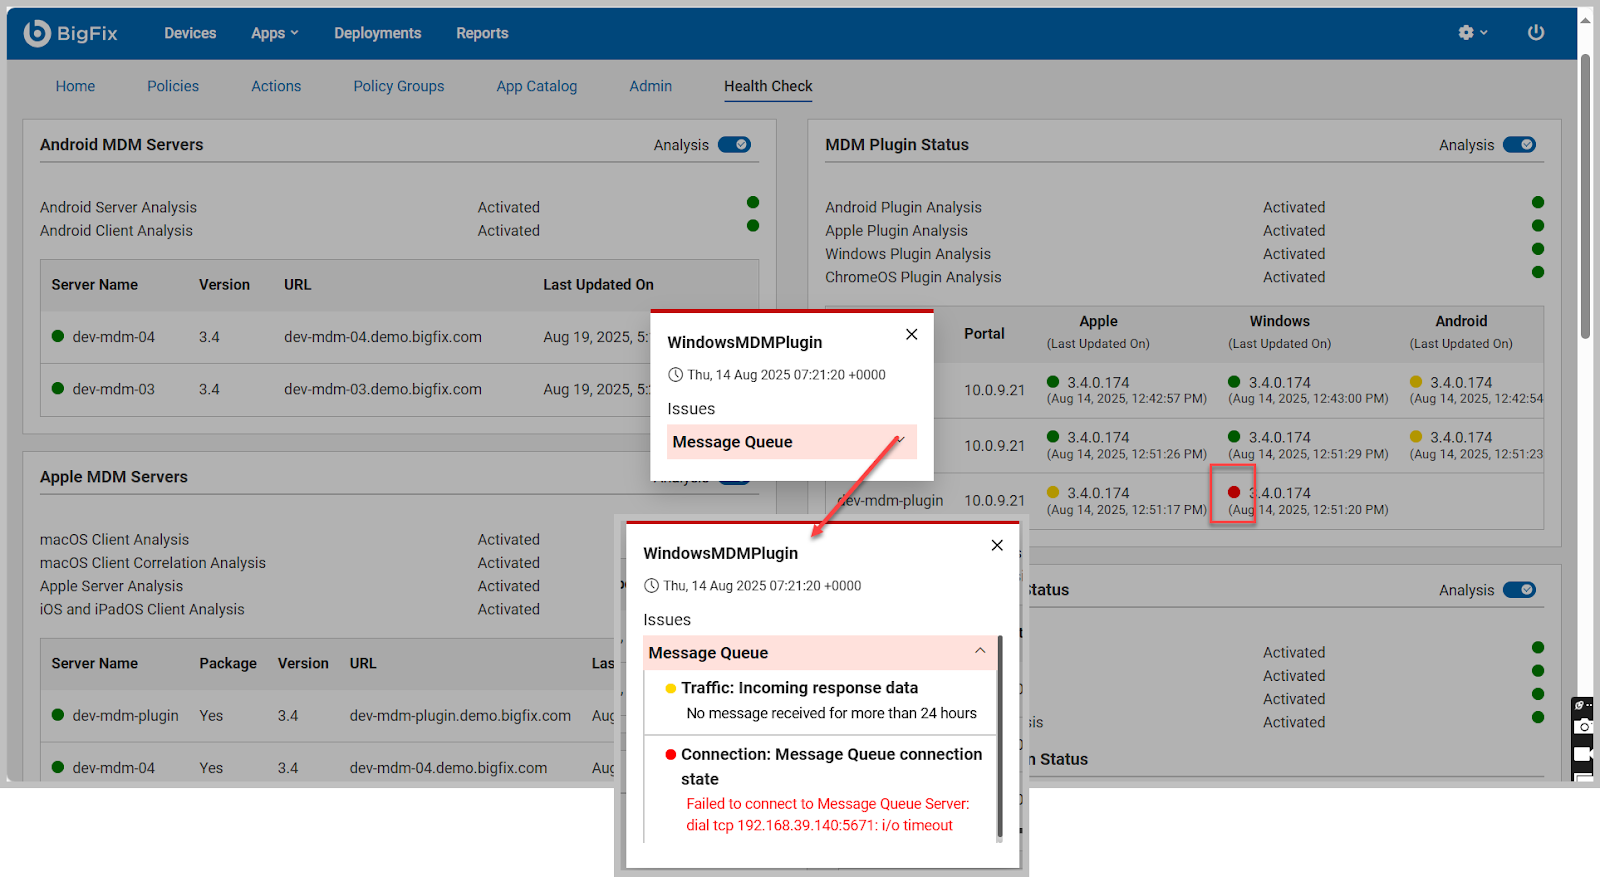
- This includes information about specific components, categories, and items that are failing or misconfigured, along with a description and detailed error information.
- When an indicator shows yellow or red, you can click on it to reveal
a detailed, hierarchical breakdown of the underlying issues. This
helps in quickly pinpointing the exact problem.
- Packages: Reports the statuses of pre-staged installers for Apple and
Windows. It indicates whether BigFix Agent installer packages (macOS
installer for Apple,
.msifor Windows) have been pre-staged, which is crucial for successful agent deployment via MDM. - Version: Reports the current version of installed MDM servers and Plugin.
- URL: Displays the configured MDM URL for Android, Apple, and Windows servers.
- Last Updated On: Reports when the specific server was last updated.
- Root Server Status: Checks if any PPKG files are created on the BES Server.
- MDM Full Disk Encryption Status: Reports on FDE analysis activation, Recovery key escrow plugin configuration (server, time interval), and Vault Escrow Server status.
- Time Format Change: The plugin and server status timestamps have been changed to a 12-hour format. This aims to make the timestamps easier to read and understand.
- Scrollbar for Server Name: A scrollbar has been added to the server table. This is particularly helpful when server names associated with the plugin status are long, preventing the table from breaking and ensuring that the full server name is visible.
- Android MDM Servers
- Apple MDM Servers
- Windows MDM Servers
- ChromOS MDM Servers
- Root Server Status
- MDM Plugin Status
- MDM Full Disk Encryption Status
- Server Rules
- Android MDM Servers
-
- Server Name: Reports the list of Android MDM servers that are detected. If there are no Android MDM servers, displays ‘No servers detected’. For information on setting up Android MDM Server, see Install BigFix MDM Service for Android.
- Version: Shows the current version of the Android MDM server installed.
- URL: Displays the configured MDM URL for Android server.
- Last Updated On: Reports when the Android server was last updated.
- Apple MDM Servers
-
- Server Name: Reports the list of Apple MDM servers that are detected. If there are no Apple MDM servers, ‘No servers detected’ is displayed. For information on setting up the Apple MDM Server, seeInstall BigFix MDM Service for Apple.
- Package: Indicates whether a BigFix Agent macOS installer package has been pre-staged on the MDM server. This is needed to successfully deploy a BigFix agent on OSX devices via MDM. If the package has been pre-staged correctly, users can see a green tick mark. If the package is missing and if you want to add the package, see Prestage macOS BigFix installer.
- Version: Shows the current version of the Apple MDM server installed.
- URL: Displays the MDM URL of the configured sever. If the server URL is not detected, ensure the server is set up properly. To set up the server, see Install BigFix MDM Service for Apple.
- Windows MDM Servers
-
- Server Name: Reports the list of Windows servers that are detected. If there are no Windows servers, displays ‘No servers detected’. For information on setting up the Windows MDM Server, see Install BigFix MDM Service for Windows.
- Package: Indicates whether a BigFix Agent Windows .msi installer package has been pre-staged on the MDM server. This is needed to successfully deploy a BigFix agent on Windows devices via MDM. If a package has been pre-staged correctly, the check shows a green tick mark against the relevant sever. If the package is missing and if you want to add the package, see Prestage Windows BigFix Installer.
- Version: Shows the current version of the Windows MDM server installed.
- URL: Displays the MDM URL of the configured sever. If the server URL is not detected, ensure the server is set up properly. To set up the server, see Install BigFix Windows MDM Server.
- ChromeOS MDM Servers
-
-
Server Name: Reports the list of ChromeOS servers that are detected. If there are no ChromeOS servers, it displays ‘No servers detected’. For information on setting up the ChromeOS MDM Server, see Install BigFix MDM Service for ChromeOS.
-
Version: Shows the current version of the ChromeOS MDM server installed.
-
URL: Displays the MDM URL of the configured MDM server. If the server URL is not detected, ensure the server is set up properly. To set up the server, see Install BigFix ChromeOS MDM Server.
-
- Root Server Status
-
This analysis checks the BES Server to find if there are any PPKG files created.
Note: PPKG created on BES Server is automatically moved to MDM Servers and is used from MDM servers when PPKG actions are taken. - MDM Plugin Status
- Reports the list of all the installed Plugin Portal names, versions along with the versions of the installed Apple MDM Plugin, Windows MDM Plugin, and Android Plugin. If component is not installed, it displays ‘None.’
- MDM Full Disk Encryption Status
- Reports the Full Disk Encryption status.
- It shows if the FDE analysis is activated or not.
- Recovery key escrow plugin status: It displays if the Recovery key escrow plugin is configured; if yes, in which server, and the time interval in which it prompts. If not configured, it displays a link through which you can configure.
- Vault Escrow Server Status: It shows if the Vault Escrow Server is configured or not. If configured, it shows the name of the Vault Escrow Server.
- Server Rules
-
This section provides an overview of all device rules, organized by the operating system in separate tabs. Each tab displays details such as the device group, enrollment type, OS type, user attribute rules, device attribute rules, and the associated policy group.
It reflects the rules deployed to the MDM server through policy groups and includes key information like:
-
Deployment timestamp – when the rule was applied
-
Device grouping details – group, enrollment type, and OS type
-
Attribute rules – user and device attributes
-
Policy group association – which policy group pushed the rules
-
How to Troubleshoot Using the Health Check Dashboard
- Monitor Indicators: Regularly check the dashboard for any yellow or red indicators.
- Drill Down into Issues: When a warning (yellow) or critical (red) indicator appears, click on it.
- Analyze Hierarchical Details: The popup panel will provide a detailed, hierarchical breakdown of the problem. Examine the "Category," "Item," and "Detail" fields for specific error messages and their root causes.
- Address Configurations: Based on the detailed error, you can then:
- Correct the incorrect configuration details (e.g., upload a valid WNS certificate, fix LDAP parameters).
- Investigate connectivity issues (e.g., ensure RabbitMQ or Google API is accessible, check firewall rules).
- Restart services if indicated by the error.Verify Resolution: After making changes, monitor the Health Check dashboard again. The indicator should eventually turn green, confirming the resolution. Note that some status changes (e.g., from "initial" to "periodic") can take up to 30 minutes to reflect fully.
General Troubleshooting Tips
- Leverage Hierarchical Details: Always click on the yellow or red indicators to get the specific error message and its context. This is the most powerful feature of the enhanced Health Check.
- Verify Basic Connectivity: Use `ping`, `telnet`, or `net
Known behaviors and workarounds
-
Delay in Status Reflection
-
Behavior: Certain status changes (for example, from initial to periodic or after configuration changes) may take up to 30 minutes to fully reflect on the dashboard based on the server and Plugin analysis.
-
Workaround: Allow a maximum of 30 minutes time for the updates to appear. If delays persist beyond 30 minutes, refresh the Health Check dashboard or recheck the configuration.
Documentation for Remediation
-
Behavior: Some error messages may appear highly technical and might not include step-by-step remediation details.
-
Workaround: Where possible, refer to the product help documentation or knowledge base for guidance. Our team is actively expanding error message documentation to make troubleshooting easier for all users.
-
-
Incomplete Coverage of Situations
-
Behavior: The Health Check currently detects and reports on most scenarios, but not every possible situation is covered yet. This may result in certain anomalies not being flagged.
-
Workaround: If you encounter an unreported issue, please contact support with details. Continuous improvements are planned to expand coverage in future releases.
-
Errors and troubleshooting
This section outlines frequently encountered errors along with their corresponding solutions. Please note that this is not an exhaustive list. It will be updated periodically as new issues and resolutions are identified.
| Error | Solution |
|---|---|
| Following AD/Azure AD parameter(s) not configured or missing | Provide valid LDAP configuration |
| Error in LDAP server connection | Provide valid LDAP URL |
| Invalid bind Credentials | Provide proper LDAP bind credentials while configuring the LDAP from WebUI |
| WNS credentials are invalid |
Provide a valid credential while installing Windows MDM server |
|
Category: RabbitMQ Description: "Incoming response data" |
Execute the following commands: |
|
Description: "RabbitMQ connection state", Detail: "Connection lost, pending retry" |
Execute the following
commands:
|
Frequently Asked Questions (FAQ)
- Can I see detailed information about a problem?
- Yes. When a health indicator for an MDM Server or Plugin shows yellow or red, you can click on it. This will open a popup panel displaying a hierarchical breakdown of the underlying issues and their specific details.
- What kind of problems can the enhanced Health Check identify?
-
It can identify a wide range of issues, including incorrect configurations (e.g., WNS certificates, LDAP settings), connectivity problems (e.g., RabbitMQ, Google API), and other runtime anomalies affecting MDM functionality.
- What if my server name is very long in the dashboard?
-
A scrollbar has been added to the server table to accommodate long server names, preventing the table layout from breaking and ensuring all information is visible.
- Does the Health Check provide proactive alerts?
-
While it doesn't send out alerts, the clear visual indicators (RED/YELLOW) on the dashboard allow you to proactively identify components that are not functioning optimally, enabling you to address problems before they significantly impact operations. "Opstate" refers to the operational state of various components within the MCM system. "Opstate information" is the detailed data collected about these components' health, status, and any detected problems at runtime, which is then presented in the Health Check dashboard.